. 2025 Jun 3;24(1):162.
doi: 10.1186/s12943-025-02374-y.

Establishing 3D organoid models from patient-derived conditionally reprogrammed cells to bridge preclinical and clinical insights in pancreatic cancer

Affiliations

Establishing 3D organoid models from patient-derived conditionally reprogrammed cells to bridge preclinical and clinical insights in pancreatic cancer

Jin Su Kim et al. Mol Cancer. .

Abstract

Background: Pancreatic cancer is a highly lethal malignancy with limited treatment response. Despite advancements in treatment, systemic chemotherapy remains the primary therapeutic approach for over 80% of patients, with no established biomarkers to guide drug selection. Traditional two-dimensional (2D) culture models fail to replicate the tumor microenvironment, necessitating the development of more advanced models, such as three-dimensional (3D) organoid models.

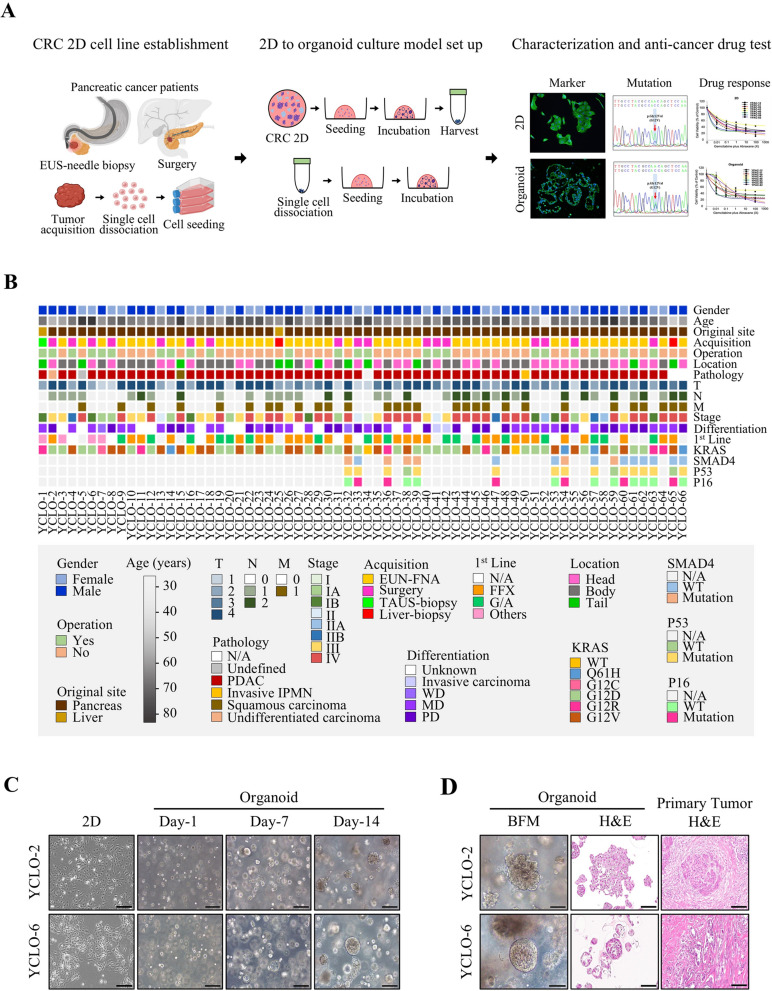
Methods: We established 3D organoid cultures using patient-derived conditionally reprogrammed cell (CRC) lines, originally cultured under 2D conditions. These CRC organoids were developed using a Matrigel-based platform without organoid-specific medium components to preserve the intrinsic molecular subtypes of the cells. Morphological, molecular, and drug sensitivity analyses were performed to compare the clinical responses of 3D CRC organoids with those of their 2D counterparts and clinical responses.

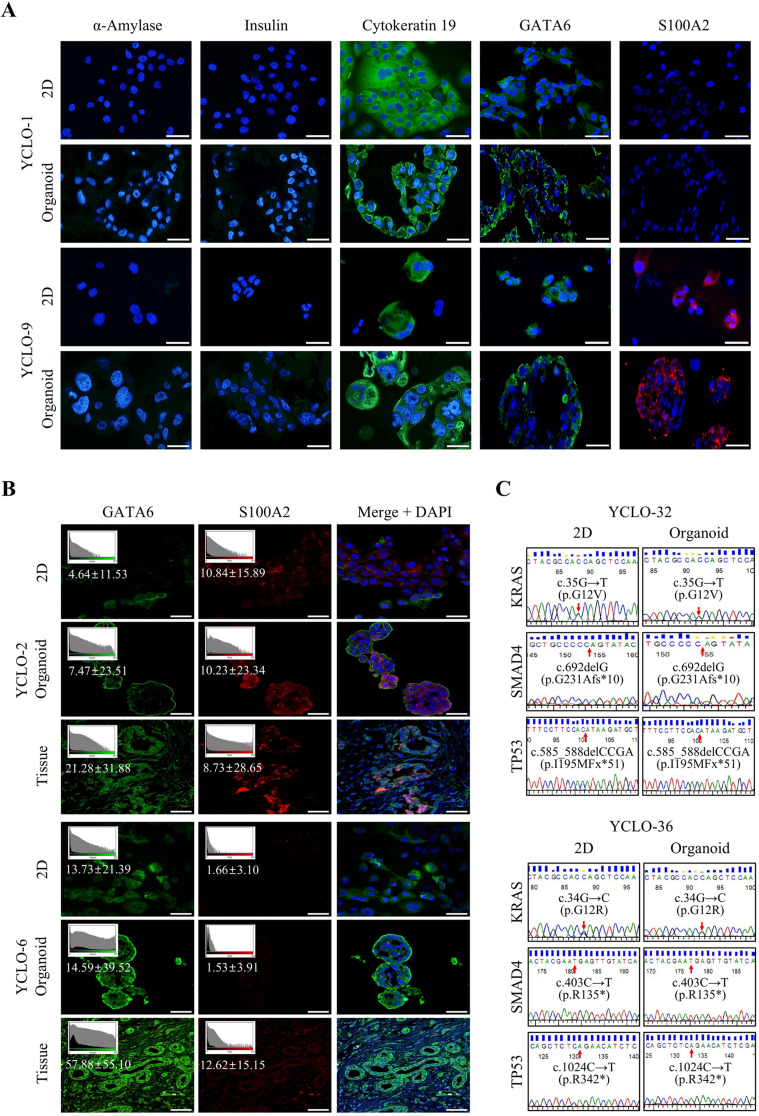
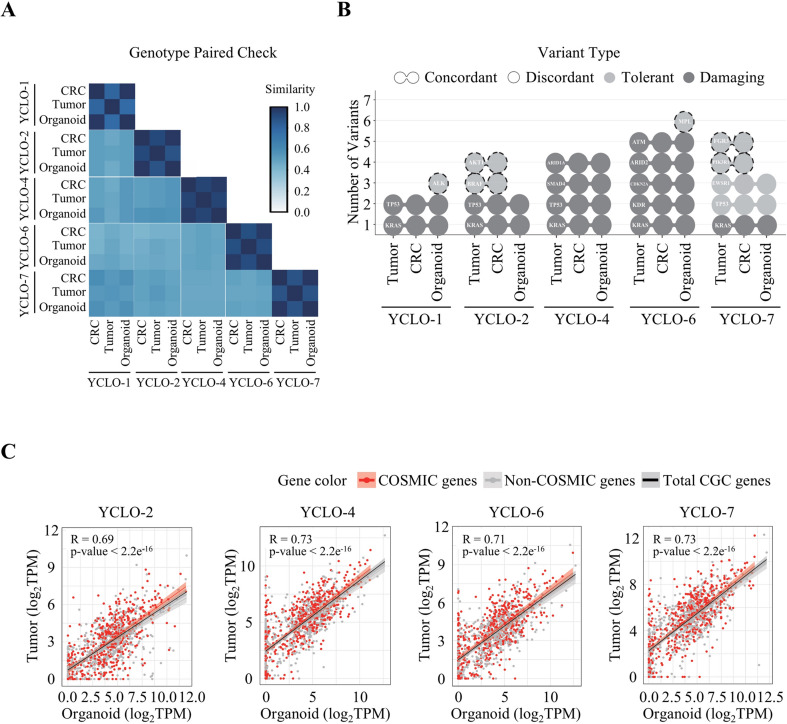
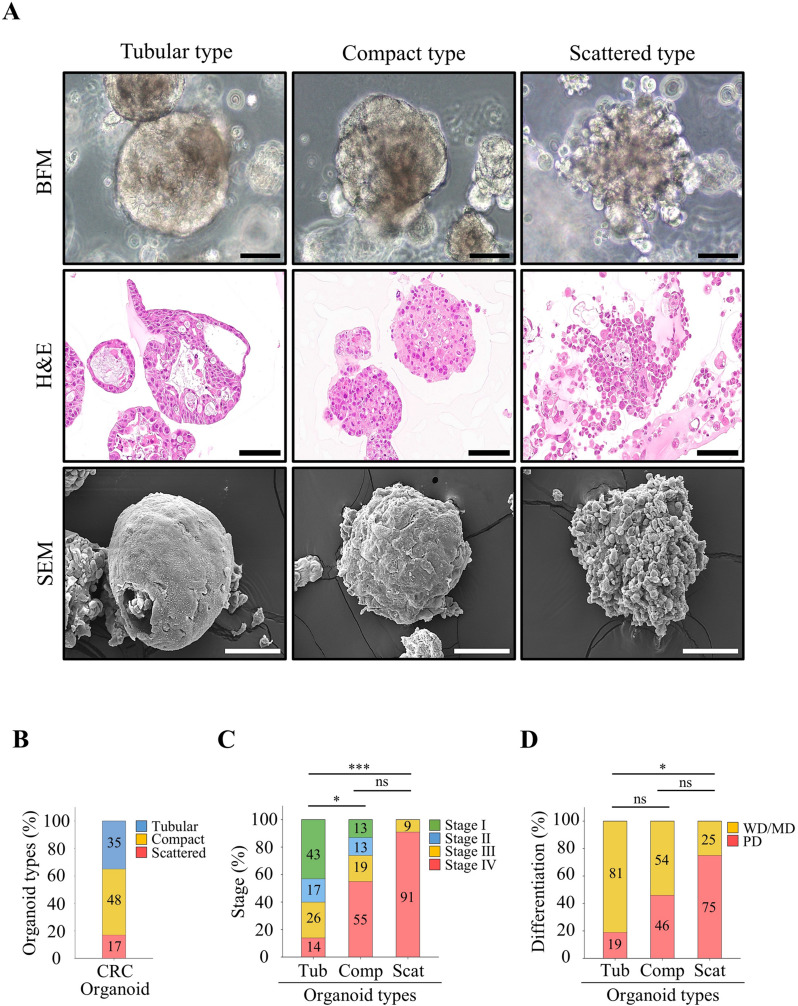
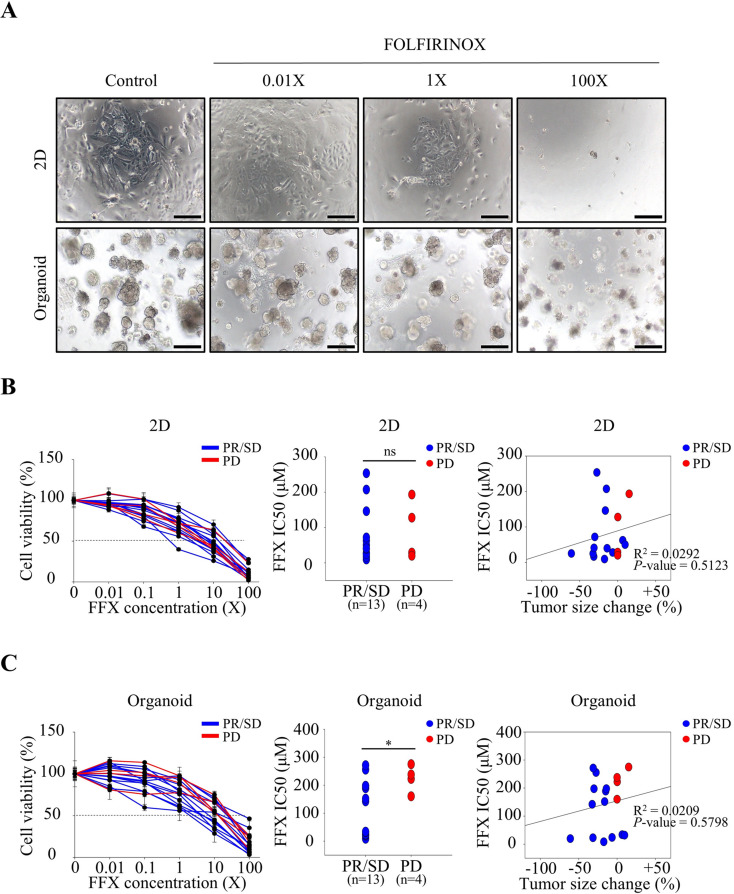
Results: The 3D CRC organoids retained the molecular characteristics, transcriptomic and mutational profiles of the parental tumors and displayed distinct morphologies corresponding to cancer stages and differentiation. Drug response profiling of gemcitabine plus nab-paclitaxel (Abraxane) and FOLFIRINOX demonstrated that the 3D organoids more accurately mirrored patient clinical responses than the 2D cultures. Notably, the IC50 values for the 3D organoids were generally higher, reflecting the structural complexity and drug penetration barriers observed in vivo.

Conclusion: Matrigel-based 3D organoid culture models provide a robust platform for pre-clinical drug evaluation, overcoming the limitations of 2D models. Although time- and resource-intensive, integrating both 2D and 3D platforms enables efficient initial screening and validation. This approach holds promise for identifying predictive biomarkers and advancing precision medicine in pancreatic cancer treatment.

Keywords: 3D organoid culture; Conditionally reprogrammed cell (CRC) organoids; Drug sensitivity screening; FOLFIRINOX; Gemcitabine plus nab-paclitaxel (Abraxane); Pancreatic cancer; Precision medicine.


Conflict of interest statement

Declarations. Ethics approval and consent to participate: This study was approved by the Institutional Review Board of Yonsei University Medical Center (number 4-2019-0614). Consent for publication: Written informed consent was obtained from all the patients. Competing interests: The authors declare no competing interests.

Figures

Fig. 1
Fig. 1
The establishment of a Matrigel-based 3D organoid culture model for pancreatic cancer utilized established CRC cell lines derived from patients with pancreatic cancer. (A) A research scheme for transitioning from 2D to organoid culture models was developed in our laboratory, successfully producing CRC organoids. These organoids were characterized and utilized by assessing their morphological phenotypes, marker expression, target gene mutations, and multi-drug screening. (B) Clinical information heatmaps for established CRC organoids. (CD) Established CRC organoids showing morphological and histological correspondence with primary tumors. Scale bar: 200 μm. (C) CRC cell line 2D images and growing CRC organoids. (D) Representative matching images of CRC organoids under bright-field microscopy (BFM) and hematoxylin and eosin (H&E) staining, along with H&E staining images of primary tumor tissues. Scale bar: 100 μm. Abbreviations: CRC, conditionally reprogrammed cell lines; BFM, bright-field microscopy; H&E, hematoxylin and eosin staining; N/A, not available
Fig. 2
Fig. 2
Characterization of established CRC organoids. (A) Immunofluorescence (IF) staining of representative 2D and organoid models using selected marker antibodies. IF staining was performed for cytokeratin 19 (an epithelial marker), α-amylase and insulin (markers for normal pancreas cells), and GATA6 (classical subtype marker), and S100A2 (basal subtype marker). Scale bar: 50 μm. (B) Validation of subtype marker expression patterns among parental tumor tissues, 2D CRCs, and corresponding organoids. Immunofluorescence staining for the classical marker GATA6 and basal marker S100A2 was performed on CRC 2D cultures, organoids, and matched primary tumor tissues from YCLO-2 and YCLO-6. Fluorescence intensity (mean ± SD) showed consistent expression patterns between 2D and organoid cultures, closely matching the original tissues and supporting subtype-specific feature preservation. Scale bar: 50 μm. (C) Representative sanger sequencing results showing identical mutations in KRAS (c.35G→T, c.34G→C), SMAD4 (c.692delG, c.403 C→T), and TP53 (c.585_588delCCGA, c.1024 C→T) in matched 2D and organoids. Red arrows indicate mutation sites. Abbreviations: YCLO, YPAC cell line organoid; Mut, mutation; Del, deletion
Fig. 3
Fig. 3
Pairwise genetic similarity of sample types. (A) Heatmap representing the concordance ratio of germline single-nucleotide polymorphisms (SNP) among three sample types—CRC, tumor, and organoid—across five individual samples. Similarity scores are calculated based on pairwise SNPs concordance, with values ranging from 0 to 1; higher scores (closer to 1) indicate greater genetic similarity and are shown in blue, while lower scores are shown in white. All five samples contain the three sample types, allowing assessment of genetic concordance and validation of patient-derived models relative to their original tissues. The results demonstrate strong genetic relationships between tumor, CRC, and organoid samples, confirming the genetic fidelity of patient-derived models. (B) Somatic mutation concordance across matched primary tumor, CRC, and organoid. Each circle represents a somatic mutation, with connected circles indicating mutations shared between two or more sample types, and single circles representing mutations unique to one sample type. Mutations are color-coded by predicted functional impact: light grey denotes tolerated mutations (e.g., synonymous or intronic), and dark grey indicates deleterious mutations (e.g., missense or frameshift). A dashed line highlights this exception. Organoid-specific and Tumor/CRC-specific mutations were also identified within the three patient-matched triplets. (C) Correlation between tumor and organoid gene expression profiles across four patient-derived samples. Each scatter plot shows the log₂-transformed TPM (Transcripts Per Million) values of CGC genes in matched tumor and organoid samples. Red dots represent genes listed in the COSMIC database, while grey dots represent non-COSMIC genes among the CGC gene set. The black regression line corresponds to the linear fit across all CGC genes, with a shaded area indicating the 95% confidence interval. Pearson correlation coefficients (R) and associated p-values are reported in each panel. COSMIC genes demonstrate strong concordance between tumor and organoid expression, indicating a strong concordance between tumor and organoid expression profiles for cancer-relevant genes
Fig. 4
Fig. 4
Various morphological types of established CRC organoids. (A) CRC organoids displayed compact, tubular, and scattered morphologies. Scale bars: 100 μm. (B) Distribution of organoid morphologies among the established CRC organoids. Compact-type organoids were the most common (48%), followed by tubular (35%) and scattered (17%) types. (C) A comparison of organoid types with cancer stages revealed an increase in scattered types as cancer stages progressed, while tubular types decreased. (D) A comparison of organoid types with cancer differentiation showed that poorly differentiated (PD) tumors were associated with increased prevalence of scattered types, followed by compact and tubular types. Fisher’s exact test was performed to evaluate associations between organoid morphological types, cancer stages, and tumor differentiation. Abbreviations: BFM, bright-field microscopy; H&E, hematoxylin and eosin staining; SEM, scanning electron microscopy; WD, well-differentiated; MD, moderately differentiated; PD, poorly differentiated; ns, not significant. *P < 0.05. ***P < 0.001
Fig. 5
Fig. 5
G/A combination drug response of established CRC cell lines in 2D and organoid culture conditions. (A) Representative bright-field microscopy (BFM) images of CRC cell lines treated with increasing concentrations (0.01X, 1X, 100X) of G/A under 2D and organoid culture conditions. Scale bar: 200 μm. (B) In the 2D culture condition, cell viability curves (left), IC50 values (middle), and their correlation with tumor size change (right) were analyzed between the PR/SD and PD groups. No statistically significant differences or correlations were observed. (C) In the organoid culture condition, IC50 values were significantly lower in the PR/SD group compared to the PD group (P < 0.05), and a significant positive correlation was observed between IC50 values and tumor size change (R² = 0.5691, P = 0.001), supporting the clinical relevance of the organoid model. Two-tailed unpaired t-tests with Welch’s correction (accounting for unequal variances) were conducted to compare IC50 values between independent groups. Linear regression analysis was performed to examine the correlation between IC50 values and tumor size changes. Abbreviations: G/A, gemcitabine plus nab-paclitaxel (Abraxane); IC50, inhibitory concentration 50; PR, partial response; SD, stable disease; PD, progressive disease; ns, not significant. *P < 0.05
Fig. 6
Fig. 6
FOLFIRINOX combination drug response of established CRC cell lines in 2D and organoid culture conditions. (A) Representative bright-field microscopy (BFM) images showing the morphological responses of patient-derived CRC cell lines to increasing concentrations (0.01X, 1X, 100X) of FOLFIRINOX under 2D and organoid culture conditions. Scale bar: 200 μm. (B) In the 2D culture condition, cell viability curves (left), IC50 values (middle), and correlation with tumor size change (right) showed no significant differences between the PR/SD and PD groups. (C) In the organoid culture condition, IC50 values were significantly lower in the PR/SD group compared to the PD group (P < 0.05), while correlation analysis between IC50 values and tumor size change was not statistically significant. Two-tailed unpaired t-tests with Welch’s correction (accounting for unequal variances) were conducted to compare IC50 values between independent groups. Linear regression analysis was performed to examine the correlation between IC50 values and tumor size changes. Abbreviations: FFX, FOLFIRINOX; IC50, inhibitory concentration 50; PR, partial response; SD, stable disease; PD, progressive disease; ns, not significant. *P < 0.05

References

    1. Siegel RL, Miller KD, Wagle NS, Jemal A. Cancer statistics, 2023. CA Cancer J Clin. 2023;73:17–48. - PubMed
    1. Rahib L, Wehner MR, Matrisian LM, Nead KT. Estimated projection of US Cancer incidence and death to 2040. JAMA Netw Open. 2021;4:e214708. - PMC - PubMed
    1. Biankin AV, Waddell N, Kassahn KS, Gingras M-C, Muthuswamy LB, Johns AL, Miller DK, Wilson PJ, Patch A-M, Wu J, et al. Pancreatic cancer genomes reveal aberrations in axon guidance pathway genes. Nature. 2012;491:399–405. - PMC - PubMed
    1. Jones S, Zhang X, Parsons DW, Lin JC-H, Leary RJ, Angenendt P, Mankoo P, Carter H, Kamiyama H, Jimeno A, et al. Core signaling pathways in human pancreatic cancers revealed by global genomic analyses. Science. 2008;321:1801–6. - PMC - PubMed
    1. Hu H-f, Ye Z, Qin Y, Xu X-w, Yu X-j. Zhuo Q-f, Ji S-r: mutations in key driver genes of pancreatic cancer: molecularly targeted therapies and other clinical implications. Acta Pharmacol Sin. 2021;42:1725–41. - PMC - PubMed

MeSH terms

LinkOut - more resources