. 2025 Jun 3;23(1):413.
doi: 10.1186/s12951-025-03500-0.

Targeting CD39 boosts PD-1 blockade antitumor therapeutic efficacy via strengthening CD8 + TILs function and recruiting B cells in cervical cancer

Affiliations

Targeting CD39 boosts PD-1 blockade antitumor therapeutic efficacy via strengthening CD8 + TILs function and recruiting B cells in cervical cancer

Lili Jiang et al. J Nanobiotechnology. .

Abstract

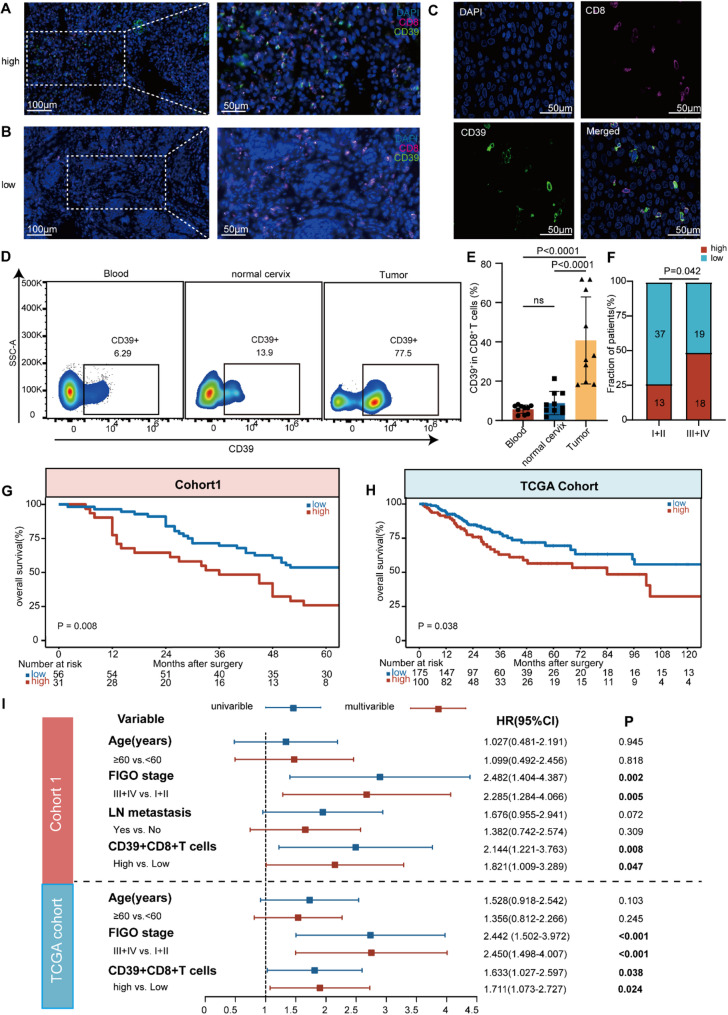
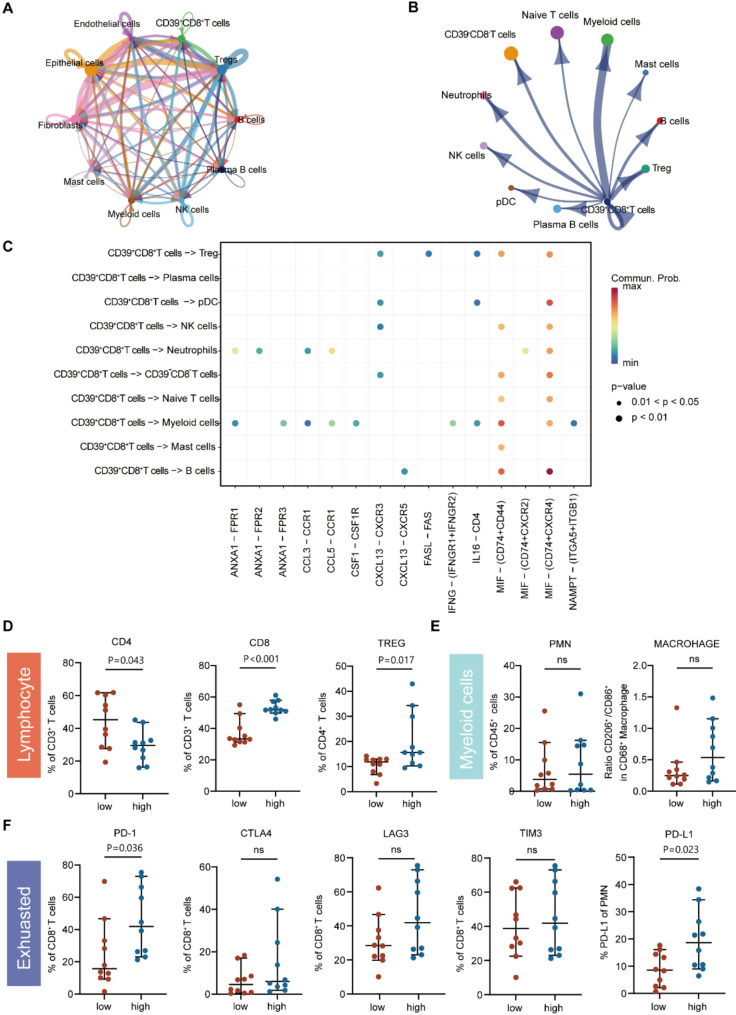
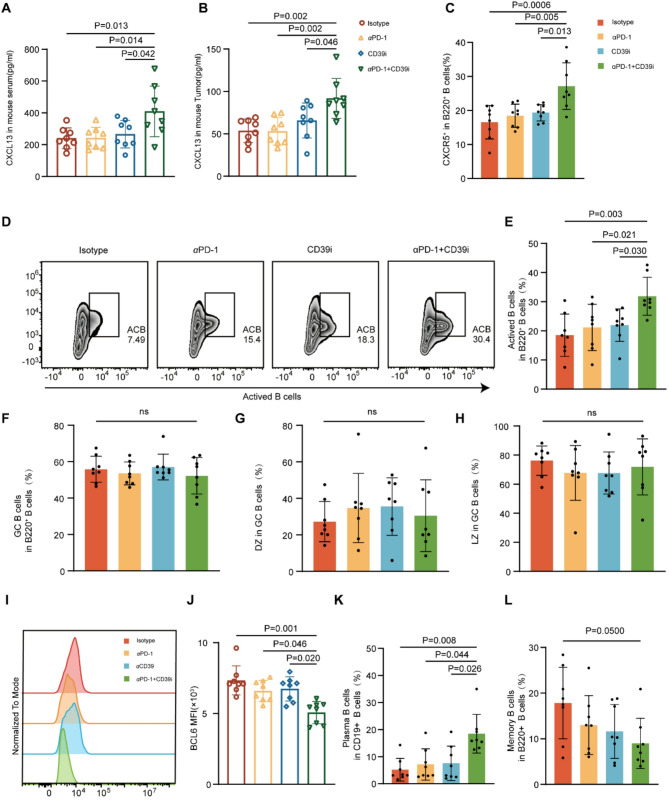
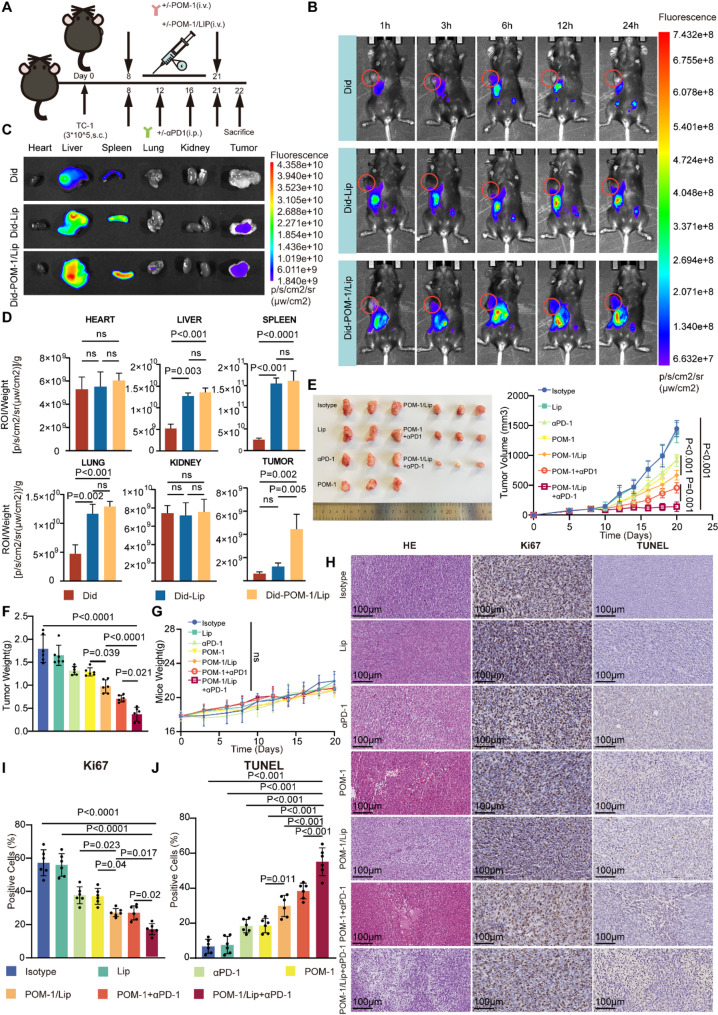
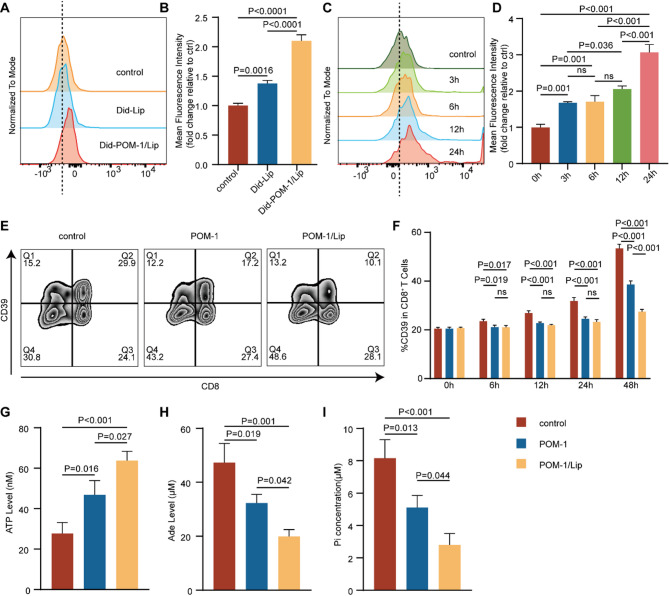
Although the programmed cell death protein 1 (PD-1) blockade has been authorized for the treatment of recurrent and metastatic cervical cancer (CC) patients, a significant proportion of CC patients show low objective response rates (ORR) to immune checkpoint blockades (ICBs). Therefore, identifying novel combination treatment strategies to enhance ICBs therapeutic efficacy for CC patients is urgently needed. Here, we discovered that CD39 was highly expressed in exhausted CD8 + T cells from 10 CC patients in our center via single-cell RNA sequencing (scRNA-seq). Furthermore, we validated that CC patients with CD39 highly expressed in CD8 + T cells associated with poor prognosis and immunoevasive subtype of CC both in cohort from our center and the Cancer Genome Atlas (TCGA) database. Moreover, it was also confirmed that CD39-inhibiting not only enhanced the cytotoxicity of CD8 + tumor-infiltrating lymphocytes (TILs) but also promoted the infiltration of B cells through increasing CXCL13 secretion both in vitro experiments and subcutaneous tumor models, thereby amplifying anti-tumor immunity of PD-1 blockade. What was more, we have developed a liposome containing POM-1, which effectively enhanced the anti-tumor effect of POM-1. Our findings provide compelling evidence that targeting CD39 represents a promising "two birds with one stone" strategy for cervical cancer treatment.

Keywords: B cells; Cervical cancer (CC); Exhausted T cells; Immune checkpoint blockage (ICB); Tumor microenvironment; αCD39.


Conflict of interest statement

Declarations. Ethical approval and informed consent: This study received ethical approval from the Ethics Committee of the Fudan University Obstetrics and Gynecology Hospital (2023 − 107) and the Animal Ethics Committee of Fudan University (202312014 S). The study was conducted in accordance with the principles of the Declaration of Helsinki. All the patients involved in this study provided written informed consent for sample collection and data analysis. Consent for publication: All authors of this study agreed to publish. Competing interests: The authors declare no competing interests.

Figures

Fig. 1
Fig. 1
CD39 + CD8 + T cells showed immune exhaustion and clonal proliferation in the CC microenvironment. (A) Uniform Manifold Approximation and Projection (UMAP) plots showed CD8 + T cell subsets (cohort 3, n = 10) in CC, of which subsets 2, 5, 9, 10 and 11 represent CD39 + groups. (B) Violin plots illustrated differences in the expression of genes related to exhaustion, activation, and proliferation between CD39 + CD8 + T and CD39 − CD8 + T cells. (C) Monocle predicted the developmental trajectories of CD39 + CD8 + T and CD39 − CD8 + T cells. (D) Kyoto Encyclopedia of Genes and Genomes plots displayed CD39 + CD8 + T cell enriched pathways. (E-G) Flow cytometry verified the expression of exhaustion-related, activation-related, and proliferation-related molecules in CD39 + CD8 + T and CD39 − CD8 + T cells (cohort 2, P1–P30) in patients with CC. (B) and (E-G) plots passed the Wilcoxon test. *, P < 0.05; **, P < 0.01; ***, P < 0.001; ns, no statistical difference. Abbreviations: PDCD1, programmed cell death protein 1; CTLA4, cytotoxic T lymphocyte-associated antigen-4; HACVR2, hepatitis a virus cellular receptor 2; LAG3, lymphocyte activation gene-3; TNF, tumor necrosis factor; IFNG, interferon gamma; LAMP1, lysosomal associated membrane protein 1; GZMB, granzyme B; PRF1, perforin 1; Th17 cell, T helper cell 17; Th1 cell, T helper 1 cell; Th2 cell, T helper 2 cell; PD-L1, programmed cell death ligand 1;PD-1, programmed Death Receptor 1; IL, Interleukin
Fig. 2
Fig. 2
CD39 increased in CD8 + TILs and CD39hi CD8 + TILs were closely associated with CC progression and poor prognosis. (A-C) Immunofluorescence staining was performed on tissue samples from patients with cervical cancer (CC) in our center between 2016 and 2018 (cohort 1, n = 87). (A) showed high CD39 expression in tumor-infiltrating CD8 + T cells, while (B) displayed low CD39 expression in these cells. (D) Representative flow cytometry dot plots illustrated the expression of CD39 in CD45 + CD8 + T cells in normal cervix, CC patients paired peripheral blood and tumor lesion. (E) Ratio of CD39 expression in CD45 + CD8 + T cells of normal cervix, CC patients paired peripheral blood and tumor (cohort 2, P1–P10). (F) The proportion of CD39 expression levels in CD8 + T cells across different International Federation of Gynecology and Obstetrics (FIGO) stages was displayed, with the numbers in each box representing the corresponding patient count (cohort 1). (G) Cohort 1 was divided into high and low expression groups based on the ratio of CD39 expression in tumor-infiltrating CD8 + T cells, and overall survival (OS) was compared between these groups. (H) Based on TCGA data, the patients were categorized into high and low expression groups according to the ratio of CD39 expression in tumor-infiltrating CD8 + T cells, and Kaplan–Meier curves were generated to compare OS between these groups (n = 275). (I) Univariate and multivariate Cox regression analysis of clinical pathological variables in cohort 1 (n = 87) and The Cancer Genome Atlas (TCGA) validation cohort (n = 275). The values were obtained using the Mann–Whitney U test (E), Fisher’s exact test (F), the log-rank test (G-H), and Cox regression (I). *, P < 0.05; **, P < 0.01; ***, P < 0.001; significant P values (P < 0.05) were bolded. Abbreviations: TCGA, The Cancer Genome Atlas; FIGO, International Federation of Gynecology and Obstetrics; LN, lymph node
Fig. 3
Fig. 3
CD39 + CD8 + T cells played a vital role in shaping the immunosuppressive microenvironment in CC. (A-B) Chord diagram showed the strength of the receptor–ligand interaction network for all cell clusters. (C) Bubble plots showed the receptor–ligand pathway strength of interaction between CD39 + CD8 + T cells with each cell cluster. Red and blue indicated high and low communication intensity, respectively, and the size of the dots indicates the range of p-values. (D-E) Flow cytometry was used to distinguish CD39-high (red) and CD39-low (blue) groups in cohort 1 (n = 20) according to CD39 expression in CD8 T cells, and to examine the proportion of lymphocytes (D) and myeloid cells (E) in different groups. (F) Flow cytometry analysis of PD-1, CTLA4, LAG3, and TIM3 expression in CD8 + T cells and PD-L1 expression in PMN-MDSCs in different groups. The values were obtained using the Mann–Whitney U test. *, P < 0.05; **, P < 0.01; ***, P < 0.001; ns, no statistical difference. Tregs, regulatory T cell; PMN-MDSCS, polymorphonuclear myeloid-derived suppressor cells; PD-1, programmed death receptor 1; TIM3, T cell immunoglobulin and mucin domain-containing protein 3; CTLA4, cytotoxic T lymphocyte-associated antigen-4; LAG3, lymphocyte activation gene-3; PD-L1, programmed cell death ligand 1
Fig. 4
Fig. 4
Combination of CD39i and αPD-1 enhanced CD8 + TILs function ex vivo. (A) As shown, primary cells were extracted from 16 CC tissues and cultured. (B) Representative flow cytometry data (left) and summary plots (right) showed apoptosis of CD45 − cells from a CC specimen after treatment with αPD-1 and/or CD39i or IgG control for 24 h (cohort 2, P15–P30; n = 16). (C-G) Dot plots showed the percentage of effector cytokines (C, D) and cytolytic markers (E-G) expressed by CD8 + T cells after 24 h of treatment with αPD-1 and/or CD39i or IgG control (n = 16). The values were obtained using the Friedman test (B-G). *, P < 0.05; **, P < 0.01; ***, P < 0.001; ns, not significant. Abbreviations: CC, cervical cancer; IT, intratumor; CTL, cytotoxic T lymphocyte; TNF, tumor necrosis factor; IFN, eukaryotic interferon; GZMB, granzyme B
Fig. 5
Fig. 5
CD39 inhibitor combined with PD-1 blockade improved the anti-tumor effect and CD8 + T cell restoration in vivo. (A) C57BL/6 mice were subcutaneously injected with 3×10⁵ TC-1 tumor cells on d 0. αPD-1 (clone RMP1-14) and isotype (n = 8 mice per group) were injected intraperitoneally on d 8, 12, 16, and 21. CD39i (POM-1) were injected intraperitoneally every day (d 8-d 21). (B) Representative photographs of tumors in each group at d 24. (C) Tumor size in mice at different time points after injection treatment (n = 8 mice per group). (D) Comparison of tumor weight in mice in each group on d 24(n = 8 mice per group). (E) Percentage of Ki67 + cells in CD45 - cells in the tumors from each group of mice on d 24 (n = 8 mice per group). (F) Percentage of CD8 + T cells in CD3 + T cells in the tumors from each group of mice on d 24 (n = 8 mice per group). (G-K) Fold change in the percentage of effector cytokines (G, H) and cytolytic markers (I-K) expressed by CD8 + T cells from the tumor of each group of mice on d 24 (n = 8 mice per group). (C) was obtained using two-way Anova and (D-K) were obtained from Kruskal-Wallis test. *, p < 0.05; **, p < 0.01; ***, p < 0.001; ns, not significant. Abbrebiations: TNF, tumor necrosis factor; IFN, eukaryotic interferon; GZMB, granzyme B
Fig. 6
Fig. 6
CD39 inhibitor combined with PD-1 blockade improved therapeutic efficacy by promoting CXCL13 release and B cell activation. (A) Enzyme-linked immunosorbent assay (ELISA) was used to detect the content of CXCL13 in the serum samples of isotype, αPD-1, CD39i, and combined treatment groups of mice. (B) The content of CXCL13 in murine tumors was detected using ELISA. (C) Flow cytometry allowed detection of the proportion of CXCR5 + B cells in murine tumors. (D-E) Flow cytometry (D) and dot plots (E) showed the proportion of activated B cell infiltration in murine tumors. (F) The dot plot displayed the proportion of GCB cells in tumor B220 + B cells. (G, H) Dot plots showed the proportion of dark zone (DZ) (G) and light zone (LZ) (H) in GCB cells in mouse tumors. (I, J) Representative histograms (I) and summarized Mean Fluorescence Intensity (MFI) diagram (J) showed the expression of BCL6 in GCB cells. (K) The dot plot showed the proportion of plasma cells among CD19 + B cells of mouse tumors. (L) The dot plot displayed the proportion of memory B cells in mouse tumor B220 + B cells. The values were obtained using the Kruskal–Wallis test. *, P < 0.05; **, P < 0.01; ***; P < 0.001; ns, not significant. Abbreviations: GCB, geminal center B cells; DZ, dark zone; LZ, light zone
Fig. 7
Fig. 7
Preparation and characterization of POM-1/Lip. (A) Synthesis of POM-1/Lip. (B) Hydrodynamic size distribution profiles of Lip and (C) POM-1/Lip nanoliposomes. (D) Representative transmission electron microscopy (TEM) image of POM-1/Lip. Scale bar, 50 nm.(E) Hydrodynamic size distribution of Lip and POM-1/Lip nanoparticles. (F) Zeta potential analysis of Lip and POM-1/Lip formulations. (G) Colloidal stability assessment: visual appearance and Tyndall effect of POM-1/Lip dispersion. (H-I) In vitro hemocompatibility evaluation: hemolytic activity of POM-1/Lip at varying concentrations. The values were obtained using the One-way ANOVA test. *, P < 0.05; **, P < 0.01; ***; P < 0.001; ns, not significant. Abbreviations: Lip, liposome
Fig. 8
Fig. 8
In vivo evaluation of POM-1/Lip in biodistribution, anti tumor efficacy, and systemic safety assessment. (A) Schematic diagram of the experimental design and therapeutic regimen of the in vivo model. C57BL/6 mice were subcutaneously injected with TC-1 cells on d 0. Lip, POM-1/Lip, and POM-1 were administered intravenously every day (d 8-d 21). Isotype and αPD-1 were administered intraperitoncally on d 8, 12, 16 and 21. (n = 6 mice per group). (B) Biodistribution of Did, Did-Lip, and Did-POM-1/Lip in tumor-bearing mice after 1, 3, 6, 12, and 24 h. (C) Fluorescence images of major organs and tumor of tumor-bearing mice. (D) Quantitative biodistribution analysis of Did fluorescence intensity in tumors and major organs at 24 h post-injection (n = 6). (E) Representitive tumor growth kinetics and (F) corresponding growth curves following various treatments (n=6 mice per group) 6. (G) Body weight monitoring throughout the treatment period (n = 6). (H) Representative tumor section images showing: TUNEL staining (apoptotic cells in brown), Ki67 immunostaining (proliferating cells in brown), and H&E staining. Scale bar, 100 μm. (I) Quantitative analysis of apoptotic index (TUNEL +) and proliferation index (Ki67+) in different groups. The values were obtained using the One-way ANOVA test. *, P < 0.05; **, P < 0.01; ***; P < 0.001; ns, not significant. Abbreviations: Lip, liposome; s.c., subcutaneous injection. i.p., intraperitoneal injection. i.v., intravenous injection
Fig. 9
Fig. 9
In vitro efficacy assessment of POM-1/Lip. (A-B) Comparative cellular uptake of Did-labeled Lip versus POM-1/Lip by CD8 + T cells after 6 h incubation, quantified by flow cytometry. (C-D) Time-dependent uptake kinetics of Did-POM-1/Lip in CD8 + T cells assessed at 3, 6, 12, and 24 h. (E-F) CD39 expression on CD8 + T cells following treatment with POM-1 or POM-1/Lip at indicated timepoints. (G-I) CD39 enzymatic activity analysis after 48 h treatment: (G) extracellular ATP accumulation, (H) Adenosine (Ade) production, and (I) inorganic phosphate release from ATP hydrolysis. The values were obtained using the One-way ANOVA test. *, P < 0.05; **, P < 0.01; ***;P < 0.001; ns, not significant. Abbreviations: Lip, liposome; ATP, adenosine triphosphate; Ade, Adenosine

References

    1. Sung H, et al. Global Cancer statistics 2020: GLOBOCAN estimates of incidence and mortality worldwide for 36 cancers in 185 countries. CA Cancer J Clin. 2021;71(3):209–49. - PubMed
    1. Canfell K, et al. Mortality impact of achieving WHO cervical cancer elimination targets: a comparative modelling analysis in 78 low-income and lower-middle-income countries. Lancet. 2020;395(10224):591–603. - PMC - PubMed
    1. NCCN Clinical Practice Guidelines in Oncology (NCCN Guidelines) Cervical Cancer Version 1.2025.
    1. Institute NC. Cancer STAT facts: cervix uteri cancer. Available from: https://seer.cancer.gov/statfacts/html/cervix.html
    1. Balar AV, et al. Pembrolizumab monotherapy for the treatment of high-risk non-muscle-invasive bladder cancer unresponsive to BCG (KEYNOTE-057): an open-label, single-arm, multicentre, phase 2 study. Lancet Oncol. 2021;22(7):919–30. - PubMed

MeSH terms