. 2025 Jun 3;17(1):92.
doi: 10.1186/s13148-025-01889-x.

Maternal loss of mouse Nlrp2 alters the transcriptome and DNA methylome in GV oocytes and impairs zygotic genome activation in embryos

Affiliations

Maternal loss of mouse Nlrp2 alters the transcriptome and DNA methylome in GV oocytes and impairs zygotic genome activation in embryos

Zahra Anvar et al. Clin Epigenetics. .

Abstract

Background: NLRP2 is a subcortical maternal complex (SCMC) protein of mammalian oocytes and preimplantation embryos. SCMC proteins are encoded by maternal effect genes and play a pivotal role in the maternal-to-zygotic transition (MZT), early embryogenesis, and epigenetic (re)programming. Maternal inactivation of genes encoding SCMC proteins has been linked to infertility and subfertility in mice and humans, but the underlying molecular mechanisms for the diverse functions of SCMC proteins, and specifically the role of NLRP2, are incompletely understood.

Results: We profiled the DNA methylome of pre-ovulatory germinal-vesicle (GV) oocytes from Nlrp2-null, heterozygous (Het), and wild-type (WT) female mice and assessed the transcriptome of GV oocytes and 2-cell embryos from WT and Nlrp2-null females. The absence or reduction of NLRP2 did not alter the distinctive global DNA methylation landscape of GV oocytes, including their unique bimodal methylome patterns and methylation at the germline differentially methylated regions (gDMRs) of imprinted genes. However, altered methylation was observed in a small subset of oocyte-characteristic hyper- and hypomethylated domains and within a minor fraction of genomic regions, particularly in Nlrp2-null oocytes. Transcriptome profiling revealed substantial differences between the Nlrp2-null and WT GV oocytes, including deregulation of many crucial factors involved in oocyte transcriptome modulation and epigenetic reprogramming. Moreover, maternal absence of NLRP2 significantly altered the transcriptome of heterozygous embryos from Nlrp2-null females compared to WT embryos, whereas the transcriptome of heterozygous embryos from Nlrp2-null males was not significantly different from that of WT embryos. Maternal absence of NLRP2 also negatively impacted MZT, as evidenced by the deregulation of a large subset of zygotic genome activation (ZGA)-related genes.

Conclusions: This study demonstrates that NLRP2 is essential for shaping the transcriptome of GV oocytes and preimplantation embryos. Maternal loss of Nlrp2 negatively impacts ZGA. Our findings that the DNA methylome of Het and Nlrp2-null oocytes was subtly changed, and that gene-body DNA methylation differences did not correlate with gene expression differences, suggest that posttranscriptional changes in transcript stability, rather than altered transcription itself, are primarily responsible for the changed transcriptome of Nlrp2-null oocytes.

Keywords: DNA methylation; Imprinted genes; Oocyte; Subcortical maternal complex.


Conflict of interest statement

Declarations. Ethics approval and consent to participate: There is no human participant in this study. All experiments were approved by the Institutional Animal Care and Use Committee (IACUC) at Baylor College of Medicine (BCM) under study protocol (AN-2035) and conducted according to institutional and governmental regulations concerning the ethical use of animals. Consent for publication: Not applicable. Competing interests: The authors declare that they have no competing interests.

Figures

Fig. 1
Fig. 1
a Experimental design. GV oocytes were isolated from WT, Het, and Nlrp2-null females. Each library (biological replicate) was prepared from a pool of 60–80 GV oocytes isolated from both ovaries of one female. b Follicle distribution in ovaries from WT, Het, and Nlrp2-null mice at P24. We counted five biological replicates of follicles in both ovaries per genotype. Follicle distributions are represented as percentages of total follicular counts (*** = p < 0.001, ** = p < 0.01, * = p < 0.05). c Hematoxylin and eosin (H&E) staining of ovarian sections from wild-type (WT), heterozygous (Het), and Nlrp2-null mice. Ovaries from Het and Nlrp2-null mice exhibit a significant reduction in secondary, antral, and ovulatory follicles compared to WT. Additionally, Het and Nlrp2-null ovaries show an increase in atretic follicles relative to WT (P: Primary, S: Secondary, An: Antral, O: Ovulatory, Ar: Atretic). d Expression levels of Nlrp2 in GV oocytes by locus-specific qRT-PCR. Gene expression was normalized to oocyte housekeeping gene Rpl19.(* = p < 0.05, **** = p < 0.0001)
Fig. 2
Fig. 2
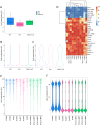
a Box plot of overall CpG methylation levels for each genotype. The mean CpG methylation levels for each oocyte pool (represented by dots) and the median for each group are indicated. b, c Violin plots of methylation levels of promoters (b) and gene bodies (c). Analysis was performed on 3 WT, 4 Het, and 4 Nlrp2-null oocyte pools. d Heatmap of methylation levels of maternal and paternal gDMRs in 3 WT, 4 Het, and 4 Nlrp2-null oocyte pools (0–100 represents % methylation). e Methylation levels of oocyte-specific CGIs in WT, Het, and Nlrp2-null oocyte pools. Box plots show median (center line), upper and lower quartiles (box limits), 1.5X interquartile range (whiskers), and outliers (points). f Violin plot of genome-wide DNA methylation in 100-CpG tiles on selected pools of 3 WT, 4 Het, and 4 Nlrp2-null oocytes. These libraries exhibit the expected highly bimodal pattern, but with more variability in Het and Nlrp2-null oocyte pools
Fig. 3
Fig. 3
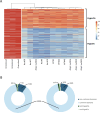
a Heatmap of distribution of HyperDs and HypoDs: HyperDs (upper cluster) and HypoDs (lower cluster) of selected oocyte pools (right 11 lanes) compared to granulosa cells (three left lanes) are shown. (0–100 scale represents relative methylation levels.) b Doughnut graphs of maintained and lost HyperDs and HypoDs in Het and Nlrp2-null oocyte pools. Each donut represents the 71,941 analyzed domains in this comparison. Colors and numbers indicate maintained domains (sum of dark and light blue), lost HyperDs (dark green), and lost HypoDs (light green) in Het (left) and Nlrp2-null (right) oocytes
Fig. 4
Fig. 4
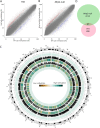
Scatterplots of average methylation values of 10 Kb tiles: (a) Comparison between Het (n = 4) and WT oocyte pools (n = 3), and (b) Nlrp2-null (n = 4) and WT oocyte pools (n = 3). Each dot is one tile. Red is hypermethylated in Het or Nlrp2-null and blue is hypomethylated in Het or Nlrp2-null compared to WT oocytes. c Circos graph comparing genome-wide methylation levels in Nlrp2-null versus WT and Het versus WT oocytes by chromosome. From outer to inner circle: Chromosomes number and size, G-banding pattern, 87 common DMRs, all informative tiles in Nlrp2-null versus WT in light blue, a brush indicating occupancy of DMRs out of all informative tiles in black, the 2300 DMRs identified in Nlrp2-null versus WT in brown to green, a brush indicating the occupancy of DMRs out of all informative tiles in black, the 977 DMRs identified in Het versus WT in brown to green, all informative tiles in Het versus WT in light blue (Brown to green represents low to high methylation differences). d Venn diagram of the number of unique and common DMRs between Nlrp2-null versus WT (green) and Het versus WT (pink) comparison
Fig. 5
Fig. 5
a Correlation matrix for GV oocyte RNA-seq libraries. This heatmap shows the pairwise Euclidean distances between RNA-seq libraries after applying a variance stabilizing transformation (VST) to the gene count data. Each cell corresponds to the calculated distance between two RNA-seq libraries, providing a visual representation of library similarity, where a value of 1 is an ideal correlation. b PCA Plot of Genotype Clustering. Dots in the plot represent an RNA-seq library colored by genotype (WT: blue, Nlrp2-null: green). The two genotypes exhibit clear separation along the principal components. X-axis: Principal Component (PC) 1 and Y-axis: PC2. c Box plot showing total number of expressed genes in oocytes from WT and Nlrp2-null. The mean number of expressed genes for each library (represented by dots) and the median for each group are indicated (* = p < 0.05)
Fig. 6
Fig. 6
a Volcano plot of DEGs between Nlrp2-null and WT oocyte pools. Note: we removed Nlrp2 for better visualization of the other DEGs but refer to Supplementary Fig. 5A for volcano plot that includes Nlrp2 (Red: overexpressed genes; blue: underexpressed genes; gray: genes without significant expression difference; vertical dashed lines: Log2 FC cutoff; horizontal dashed lines: significance level). b MA plots of Log2 fold changes (y-axis) over mean expression levels (x-axis) in Nlrp2-null versus WT oocyte pools (with same colors for DEGs)
Fig. 7
Fig. 7
Volcano plots of DEGs between Het paternal effect and WT embryo pools (a), DEGs between Het maternal effect and WT embryo pools (b), and DEGs between Het maternal and Het paternal effect embryos (c). Red: overexpressed genes; blue: underexpressed genes; gray: genes without significant expression difference; vertical dashed lines: Log2 FC cutoff; horizontal dashed lines: significance level. d Venn diagram of the number of unique and common DEGs between Het maternal effect versus WT and Het maternal effect versus Het paternal effect comparisons
Fig. 8
Fig. 8
Schematic showing the strategy to investigate the role of DEGs during MZT. The reference list was obtained by comparing RNA-seq data from WT GV oocytes and WT 2-cell embryos (middle panel). Left and right panels represent the DEGs identified in Het maternal effect versus WT embryos and in Het maternal effect versus Het paternal effect embryos, respectively. Curved arrows on the left and right represent the comparison between these lists of DEGs and the reference list

Similar articles

References

    1. Lucifero D, La Salle S, Bourc’his D, Martel J, Bestor TH, Trasler JM. Coordinate regulation of DNA methyltransferase expression during oogenesis. BMC Dev Biol. 2007;7:36. - PMC - PubMed
    1. Winata CL, Korzh V. The translational regulation of maternal mRNAs in time and space. FEBS Lett. 2018;592(17):3007–23. - PMC - PubMed
    1. Lee MT, Bonneau AR, Giraldez AJ. Zygotic genome activation during the maternal-to-zygotic transition. Annu Rev Cell Dev Biol. 2014;30:581–613. - PMC - PubMed
    1. Li L, Zheng P, Dean J. Maternal control of early mouse development. Development. 2010;137(6):859–70. - PMC - PubMed
    1. Aoki F. Zygotic gene activation in mice: profile and regulation. J Reprod Dev. 2022;68(2):79–84. - PMC - PubMed

Substances

LinkOut - more resources