. 2025 Jun;15(6):e70337.
doi: 10.1002/ctm2.70337.

Elevation of ISG15 promotes diabetic kidney disease by modulating renal tubular epithelial cell pyroptosis

Affiliations

Elevation of ISG15 promotes diabetic kidney disease by modulating renal tubular epithelial cell pyroptosis

Lingzhi Huang et al. Clin Transl Med. 2025 Jun.

Abstract

Background: Fibrosis and inflammation in the renal tubular epithelial cells (TECs) are key contributors to the pathology of diabetic kidney disease (DKD). Nevertheless, the precise triggers of these processes remain unclear. This study aimed to explore the role of interferon-stimulated gene 15 (ISG15) in the injury of TECs induced by high glucose (HG) conditions and its implications for the development of DKD.

Methods: ISG15 knockout (ISG15 KO) mice injected with streptozotocin-treated mice on a high-fat diet were used to investigate its role in DKD. Cellular models with ISG15 knockdown were exposed to HG conditions to assess the effects of ISG15 on cellular responses. Subsequently, we evaluated the impact of ISG15 on pyroptosis, a form of programmed cell death, to understand its potential role in DKD pathology. Furthermore, RNA sequencing (RNA-seq) and molecular biology techniques were employed to explore the signalling pathways potentially regulated by ISG15.

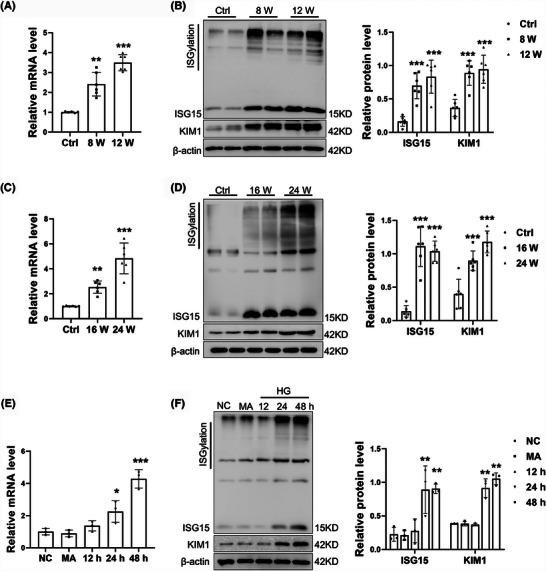
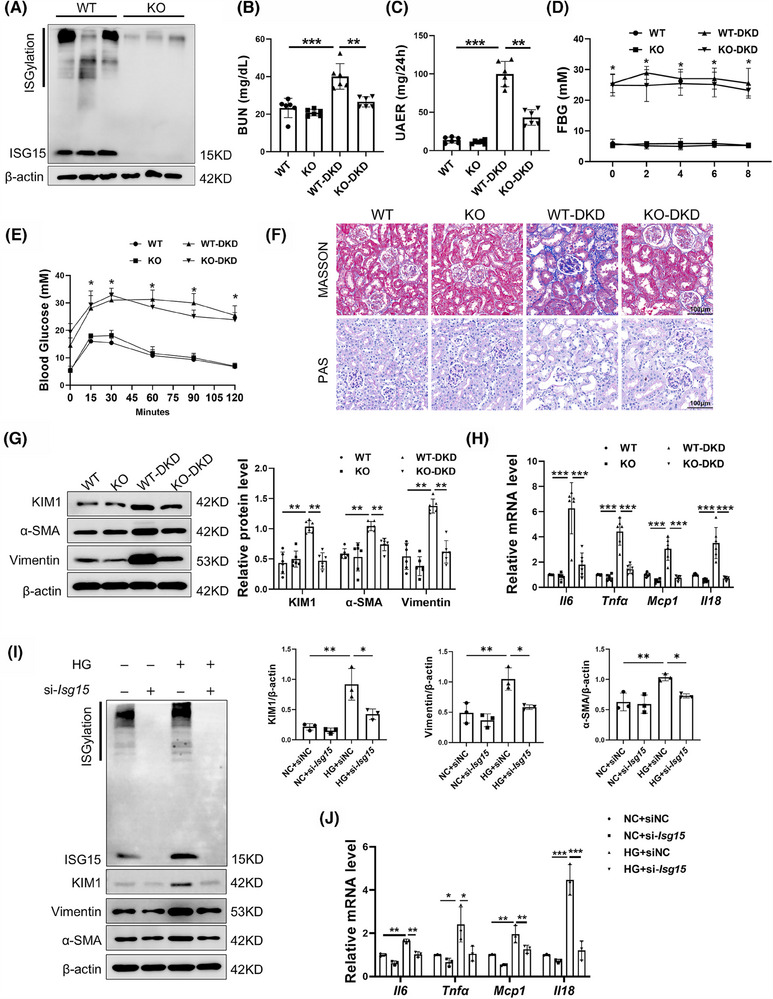
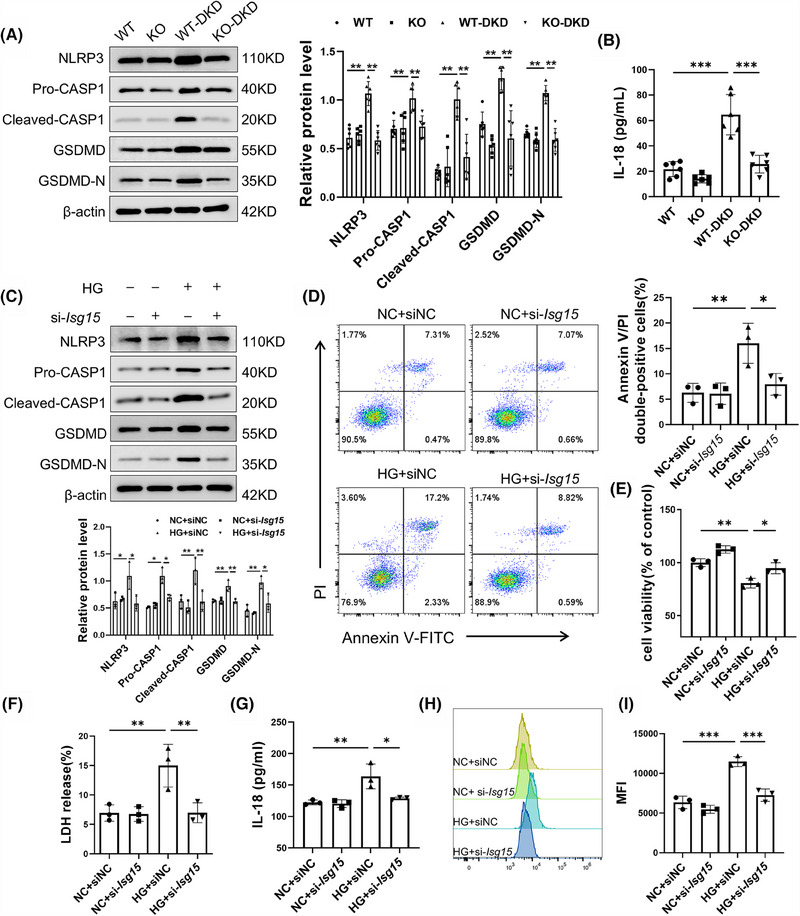
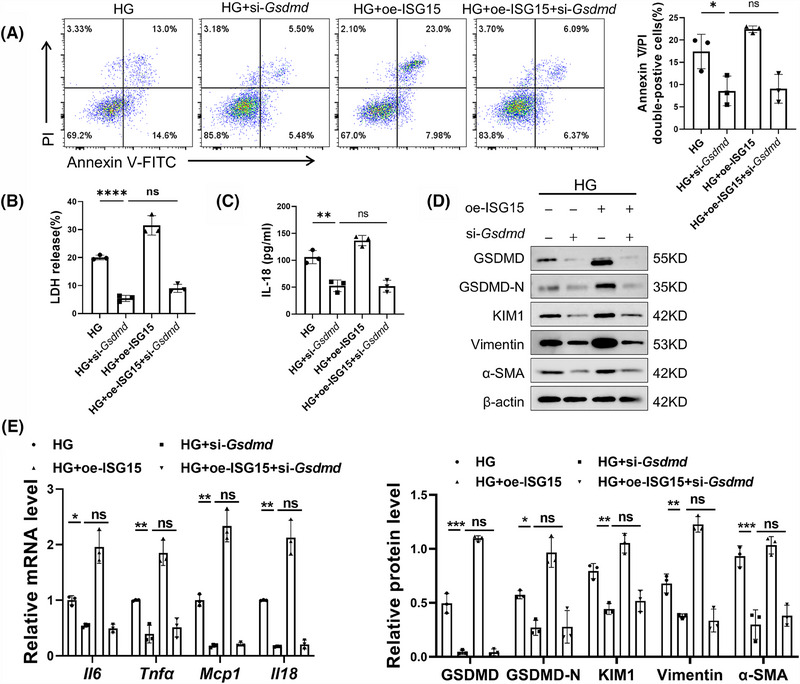
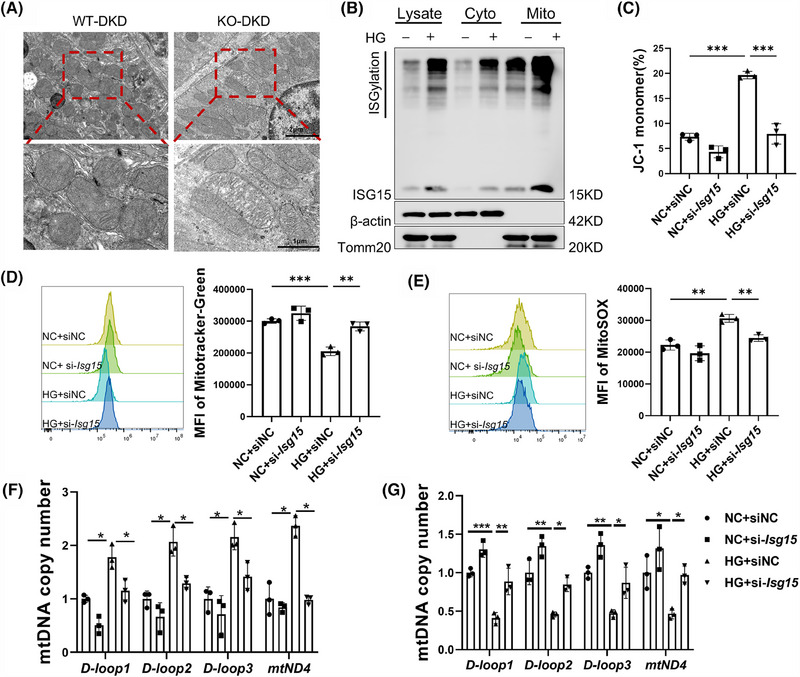
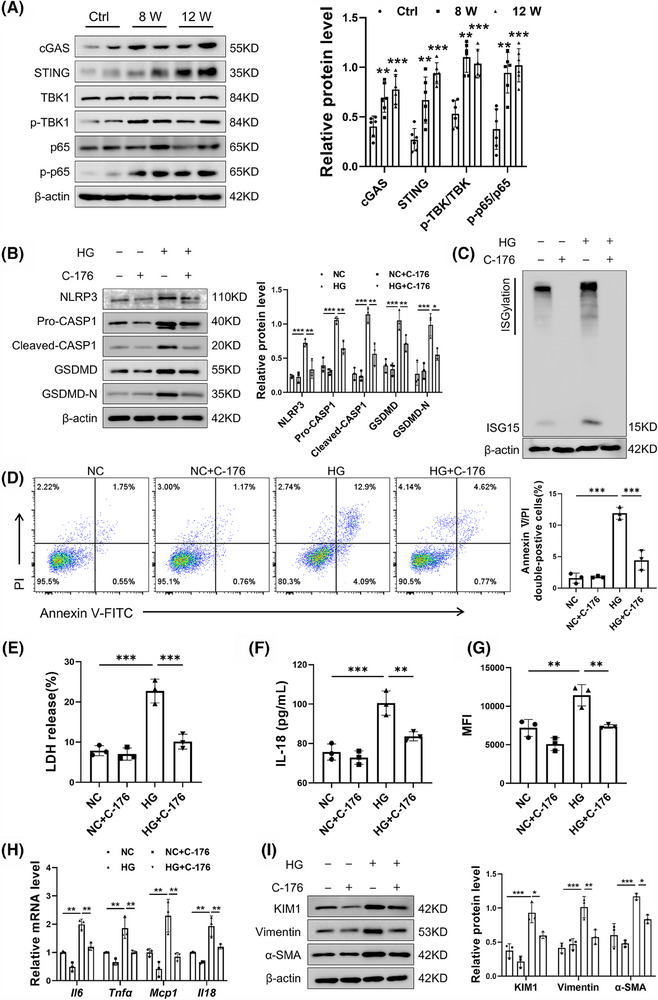
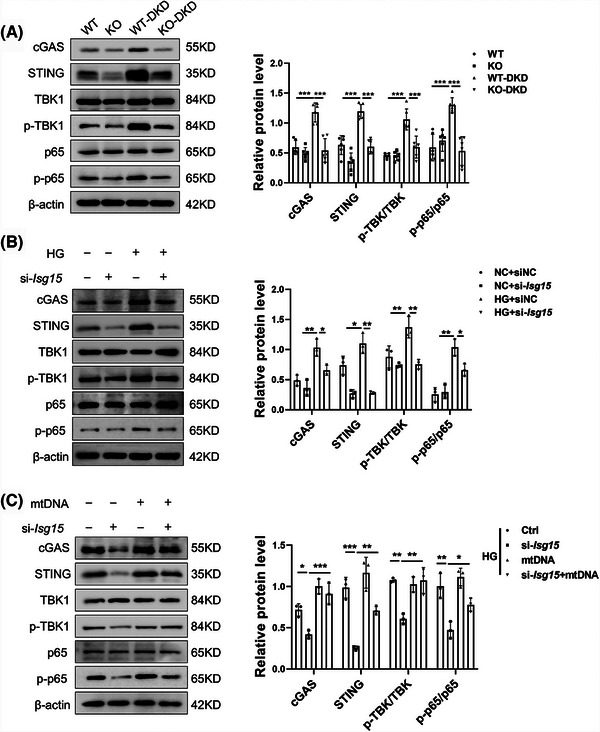
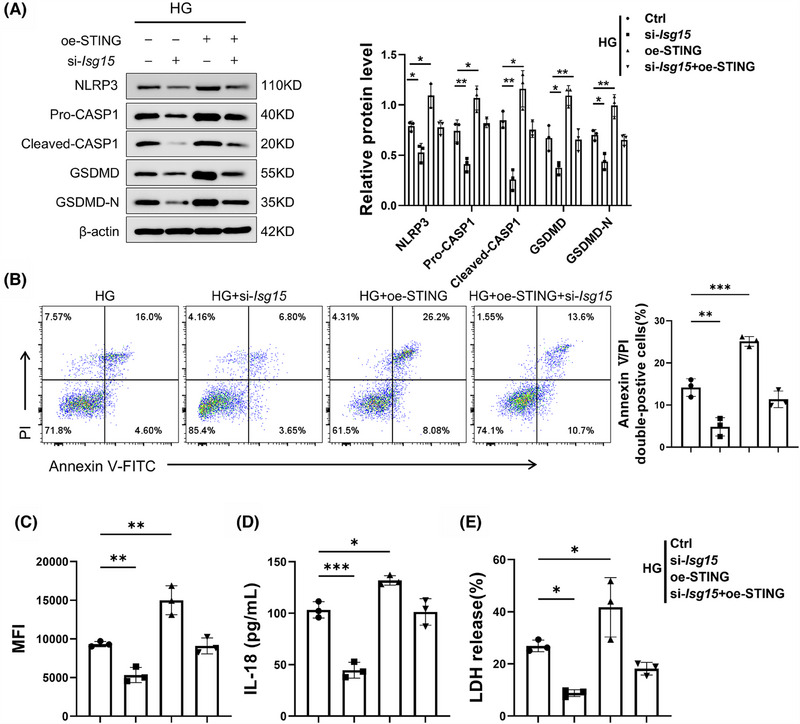
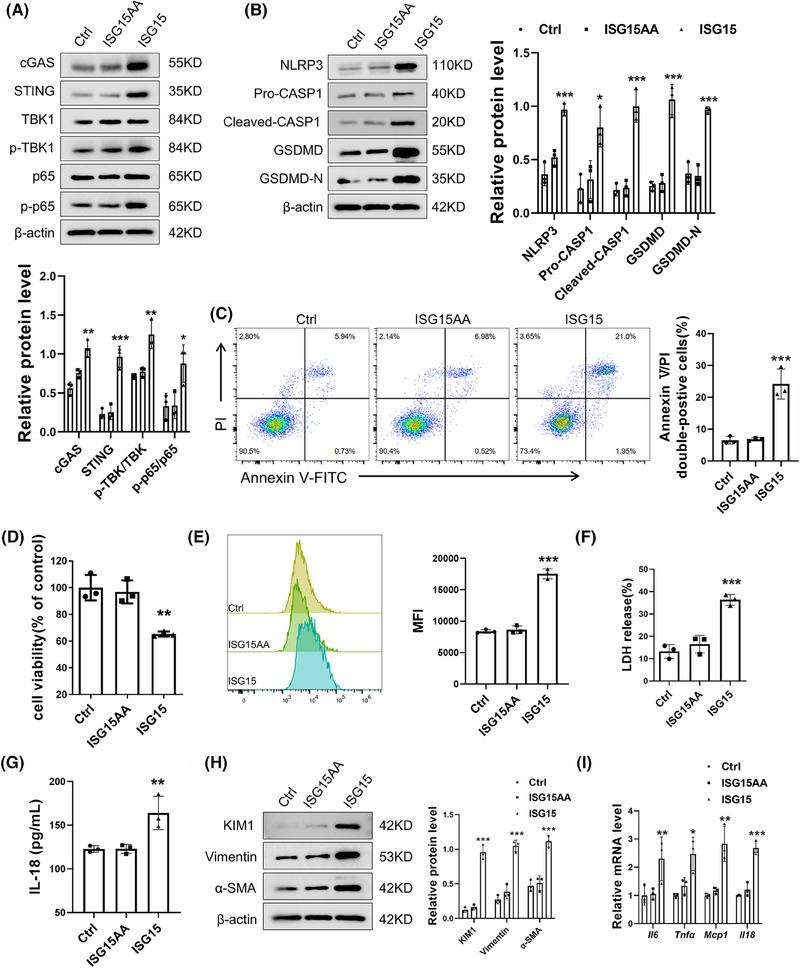
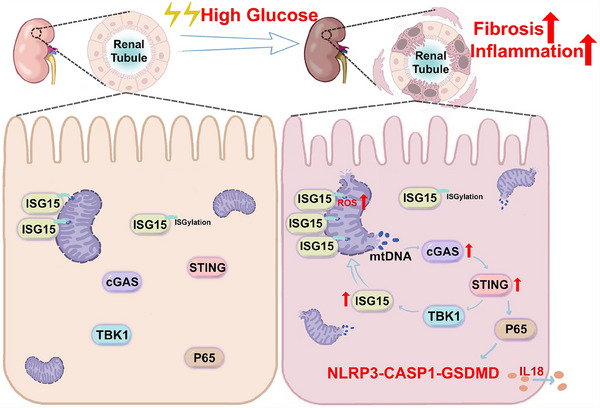
Results: We first confirmed an up-regulation of ISG15 within the renal tubule in DKD. The deletion of ISG15 alleviated renal functional damage, fibrosis and inflammation, which correlated with reduced ISGylation levels. Mechanistic investigation revealed that HG stimulation in TECs disrupted the mtDNA-cGAS-STING signalling, which exacerbates the DKD through the NLRP3-CASP1-GSDMD axis. Furthermore, we uncovered a bidirectional regulatory loop between STING and ISG15, with STING enhancing ISG15 expression upstream and ISG15 modulating STING expression through ISGylation.

Conclusion: ISG15-mtDNA-STING emerges as a critical hub that integrates the processes of pyroptosis, fibrosis and inflammation. Therapeutic interventions that target this signalling network at various levels may pave the way for innovative treatments for DKD.

Key points: ISG15 is highly expressed in both DKD mice and renal tubular epithelial cell cultured in HG condition. ISG15 promotes DKD pyroptosis via NLRP3-CASP1-GSDMD axis. ISG15-mtDNA-STING emerges as a critical hub that integrates the processes of pyroptosis.

Keywords: ISG15; diabetic kidney disease; fibrosis; pyroptosis; renal tubular epithelial cells.


Conflict of interest statement

The authors declare no conflicts of interest.

Figures

FIGURE 1
FIGURE 1
High ISG15 expression in DKD mice. (A) Relative mRNA level of Isg15 in the kidney cortical tissues from WT mice and STZ/HFD‐induced DKD mice (n = 6). (B) Western blot analysis and quantification of ISG15/ISGylation and KIM‐1 expression in kidney cortical tissues from WT mice and STZ/HFD‐induced DKD mice (n = 6). (C) Relative mRNA level of Isg15 in the kidney from db/m, 16 W db/db and 24 W db/db mice (n = 6). (D) Western blot analysis and quantification of ISG15/ISGylation and KIM‐1 expression in kidney cortical tissues from db/m, 16 W db/db and 24 W db/db mice (n = 6). (E) Relative mRNA level of Isg15 in the TECs cultured in normal medium, MA or HG for 48 h (n = 3). (F) Western blot analysis and quantification of ISG15/ISGylation and KIM‐1 expression in the TECs (n = 3). DKD, diabetic kidney disease; HFD, high‐fat diet; HG, high glucose; STZ, streptozotocin; MA, mannitol. Results are expressed as the mean ± SD. *p < .05; **< .01; ***p < .001.
FIGURE 2
FIGURE 2
ISG15 deletion was protective against renal injury. (A) Western blot analysis and densitometric quantification of ISG15 expression in kidney tissues from WT and KO mice (n = 6). (B–E) BUN (B), UAER (C), FBG (D) and OGTT (E) levels in WT and KO mice treated with vehicle or STZ (n = 6). (F) Representative images of MASSON and PAS staining of the kidney (n = 6). (G) Western blot analysis and densitometric quantification of KIM1, α‐SMA and Vimentin expression in kidney tissues from WT and KO mice treated with vehicle or STZ (n = 6). (H) Relative mRNA level of pro‐inflammatory factors (Il6, Tnfa, Mcp1 and Il18) in the kidney tissues from WT and KO mice treated with vehicle or STZ (n = 6). (I) Western blot analysis and densitometric quantification of ISG15/ISGylation, KIM1, α‐SMA and Vimentin expression in TECs (n = 3). (J) Relative mRNA level of pro‐inflammatory factors (Il6, Tnfa, Mcp1 and Il18) in TECs (n = 3). TECs were transfected with sinc (50 nM) or si‐Isg15 (50 nM), and then cultured in HG medium for 48 h. BUN, blood urea nitrogen; UAER, urinary albumin excretion rates; FBG, fasted blood; OGTT, oral glucose tolerance. Results are expressed as the mean ± SD. *p < .05; **p < .01; ***p < .001.
FIGURE 3
FIGURE 3
Ablation of ISG15 decreased pyroptosis of TECs under HG stimulation. (A) Western blot analysis and densitometric quantification of pyroptosis‐related proteins (NLRP3, Pro‐CASP1, Cleaved‐CASP1, GSDMD, GSDMD‐N) expression in kidney tissues from WT and KO mice treated with vehicle or STZ (n = 6). (B) Level of IL‐18 in the serum from WT and KO mice treated with vehicle or STZ (n = 6). (C) Western blot analysis of pyroptosis‐related proteins (NLRP3, Pro‐CASP1, Cleaved‐CASP1, GSDMD, GSDMD‐N) expression in TECs (n = 3). (D) Flow cytometry analysis and quantitative data depicting the TECs Annexin V/PI double‐positive cells rate (n = 3). (E) CCK‐8‐kit activity assay quantified cell viability (n = 3). (F–I) Level of LDH (F), IL‐18 (G), ROS (H and I) in TECs (n = 3). TECs were transfected with sinc (50 nM) or si‐Isg15 (50 nM), and then cultured in HG medium for 48 h. Results are expressed as the mean ± SD. *p < .05; **p < .01; ***p < .001.
FIGURE 4
FIGURE 4
Inhibition of pyroptosis blocked TECs damage and fibrosis induced by ISG15. (A) Flow cytometry analysis and quantitative data depicting the Annexin V/PI double‐positive cells rate (n = 3). (B and C) Levels of LDH (B), IL‐18 (C) in TECs (n = 3). (D) Western blot analysis and densitometric quantification of GSDMD, GSDMD‐N, KIM1, α‐SMA and Vimentin expression in TECs (n = 3). (E) Relative mRNA level of pro‐inflammatory factors (Il6, Tnfa, Mcp1 and Il18) in TECs (n = 3). TECs were transfected with si‐Gsdmd (50 nM) or oe‐ISG15 (4 µg), and then cultured in HG medium for 48 h. Results are expressed as the mean ± SD. *p < .05; **p < .01; ***p < .001.
FIGURE 5
FIGURE 5
ISG15 was involved in HG‐induced mitochondrial impairment and mtDNA release. (A) Representative TEM images of kidney tissues from WT and KO mice treated with STZ (n = 6). (B) Western blot analysis ISG15/ISGylation expression in TECs treated with vehicle or HG (n = 3). (C–E) Flow cytometry analysis and quantitative data depicting the mitochondrial membrane potential (C), mitochondrial mass (D) and mtROS (E) (n = 3). (F and G) qPCR analysis the mtDNA (Loop1‐3 and mt‐Nd4) copy number in the cytosolic compartments (F) and mitochondria (G) (n = 3). TECs were treated with vehicle or C‐176 (10 µM), and then cultured in HG medium for 48 h. Results are expressed as the mean ± SD. *p < .05; **p < .01; ***p < .001; ns, not significant.
FIGURE 6
FIGURE 6
The cGAS–STING pathway was activated in the DKD mice. (A) Western blot analysis and densitometric quantification of cGAS, STING, TBK1, p‐TBK1, p65, p‐p65 expression in DKD mice (n = 6). (B) Western blot analysis and densitometric quantification of NLRP3, Pro‐CASP1, Cleaved‐CASP1, GSDMD, GSDMD‐N expression in TECs (n = 3). (C) Western blot analysis ISG15/ISGylation expression in TECs (n = 3). (D) Flow cytometry analysis and quantitative data depicting the Annexin V/PI double‐positive cells rate (n = 3). (E–G) Levels of LDH (E), IL‐18 (F), ROS (G) in TECs (n = 3). (H) Relative mRNA level of pro‐inflammatory factors (Il6, Tnfa, Mcp1, Il18) in TECs (n = 3). (I) Western blot analysis and densitometric quantification of KIM1, α‐SMA and Vimentin expression in TECs (n = 3). TECs were transfected with vehicle or C‐176 (10 µM), and then cultured in HG medium for 48 h. Results are expressed as the mean ± SD. *p < .05; **p < .01; ***p < .001.
FIGURE 7
FIGURE 7
ISG15 promoted STING signalling via cytosolic mtDNA and established a positive feedback loop. (A) Western blot analysis and densitometric quantification of cGAS, STING, TBK1, p‐TBK1, p65, p‐p65 expression in WT and KO mice treated with vehicle or STZ (n = 6). (B and C) Western blot analysis and densitometric quantification of cGAS, STING, TBK1, p‐TBK1, p65, p‐p65 expression in TECs (n = 3). TECs were transfected with mtDNA (4 µg) or si‐Isg15 (50 nM), and then cultured in HG medium for 48 h. Results are expressed as the mean ± SD. *p < .05; **p < .01; ***p < .001.
FIGURE 8
FIGURE 8
ISG15–STING loop‐maintained HG‐induced injury in TECs. (A) Western blot analysis and densitometric quantification of NLRP3, Pro‐CASP1, Cleaved‐CASP1, GSDMD and GSDMD‐N expression in TECs (n = 3). (B) Flow cytometry analysis and quantitative data depicting the Annexin V/PI double‐positive cells rate (n = 3). (C–E) Levels of ROS (C), IL‐18 (D), LDH (E) in TECs (n = 3). TECs were transfected with oe‐STING (4 µg) or si‐Isg15 (50 nM), and then cultured in HG medium for 48 h. Results are expressed as the mean ± SD. *p < .05; **p < .01; ***p < .001.
FIGURE 9
FIGURE 9
ISG15 contributed to TECs injury in an ISGylation‐dependent manner. (A) Western blot analysis and densitometric quantification of cGAS, STING, TBK1, p‐TBK1, p65, p‐p65 expression in TECs (n = 3). (B) Western blot analysis and densitometric quantification of NLRP3, Pro‐CASP1, Cleaved‐CASP1, GSDMD, GSDMD‐N expression in TECs (n = 3). (C) Flow cytometry analysis and quantitative data depicting the Annexin V/PI double‐positive cells rate (n = 3). (D) CCK‐8 activity assay quantified cell viability (n = 3). (E–G) Levels of ROS (E), LDH (F), IL‐18 (G) in TECs (n = 3). (H) Western blot analysis and densitometric quantification of KIM1, α‐SMA and Vimentin expression in TECs (n = 3). (I) Relative mRNA level of pro‐inflammatory factors (Il6, Tnfa, Mcp1 and Il18) in TECs (n = 3). TECs were transfected with empty vector, ISG15AA or ISG15 (4 µg). Results are expressed as the mean ± SD. *p < .05; **p < .01; ***p < .001.
FIGURE 10
FIGURE 10
ISG15 up‐regulation in TECs aggravated DKD progression via mtDNA mediated cGAS–STING signalling. The up‐regulation of ISG15 in TECs under HG stimulation disrupted mitochondrial homeostasis and triggered the release of mtDNA into the cytosol, which in turn activated the NLRP3‐mediated pyroptosis in a cGAS–STING‐dependent manner, and promoted the progression of DKD.

Similar articles

References

    1. Mohandes S, Doke T, Hu H, Mukhi D, Dhillon P, Susztak K. Molecular pathways that drive diabetic kidney disease. The Journal of Clinical Investigation. 2023;133(4):1‐12. doi:10.1172/JCI165654 - DOI - PMC - PubMed
    1. Xu C, Ha X, Yang S, Tian X, Jiang H. Advances in understanding and treating diabetic kidney disease: focus on tubulointerstitial inflammation mechanisms. Front Endocrinol (Lausanne). 2023;14:1232790. doi:10.3389/fendo.2023.1232790 - DOI - PMC - PubMed
    1. Hu Q, Chen Y, Deng X, et al. Diabetic nephropathy: focusing on pathological signals, clinical treatment, and dietary regulation. Biomed Pharmacother. 2023;159:114252. doi:10.1016/j.biopha.2023.114252 - DOI - PubMed
    1. Xu F, Jiang H, Li X, et al. Discovery of prdm16‐mediated trpa1 induction as the mechanism for low tubulo‐interstitial fibrosis in diabetic kidney disease. Adv Sci (Weinh). 2024;11(7):e2306704. doi:10.1002/advs.202306704 - DOI - PMC - PubMed
    1. Dikun KM, Tang XH, Fu L, Choi ME, Lu C, Gudas LJ. Retinoic acid receptor alpha activity in proximal tubules prevents kidney injury and fibrosis. Proc Natl Acad Sci USA. 2024;121(7):e1983164175. doi:10.1073/pnas.2311803121 - DOI - PMC - PubMed