

Carrier-Free Silibinin/Sorafenib Microparticles Alleviate Metabolic Dysfunction-Associated Steatotic Liver Disease by Modulating Fatty Acid Metabolism
- PMID: 40462832
- PMCID: PMC12132069
- DOI: 10.2147/IJN.S515107
Carrier-Free Silibinin/Sorafenib Microparticles Alleviate Metabolic Dysfunction-Associated Steatotic Liver Disease by Modulating Fatty Acid Metabolism
Abstract
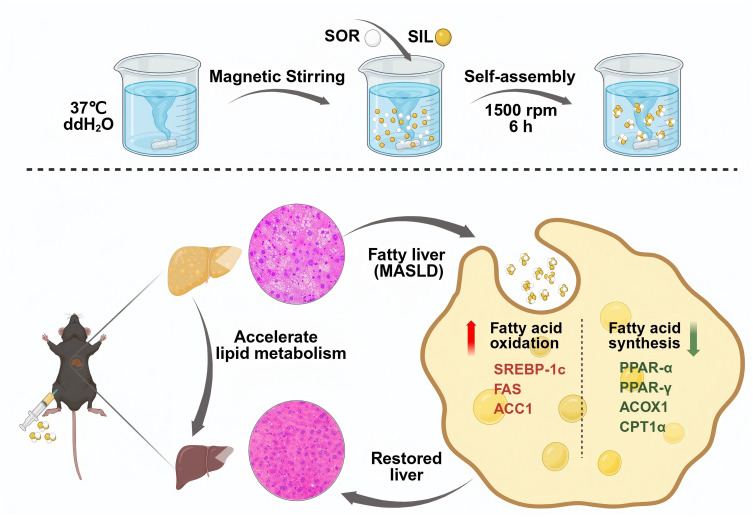
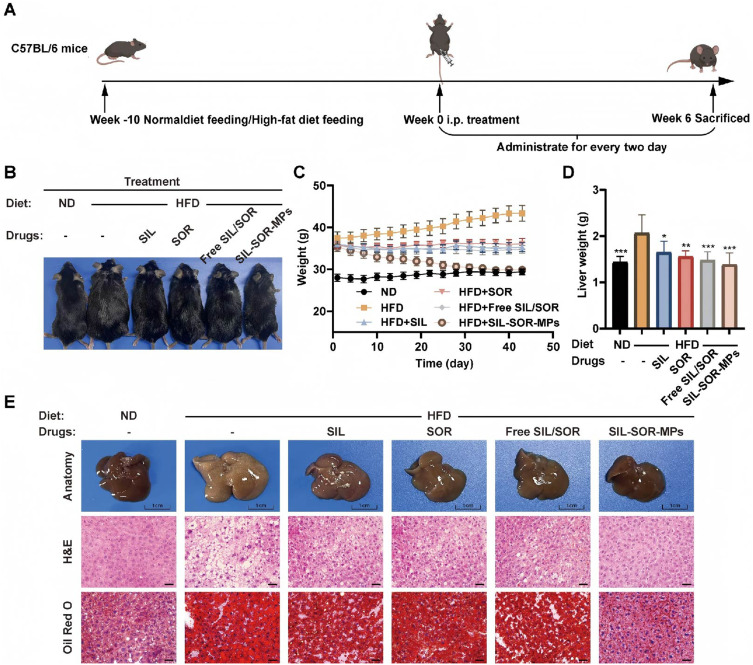
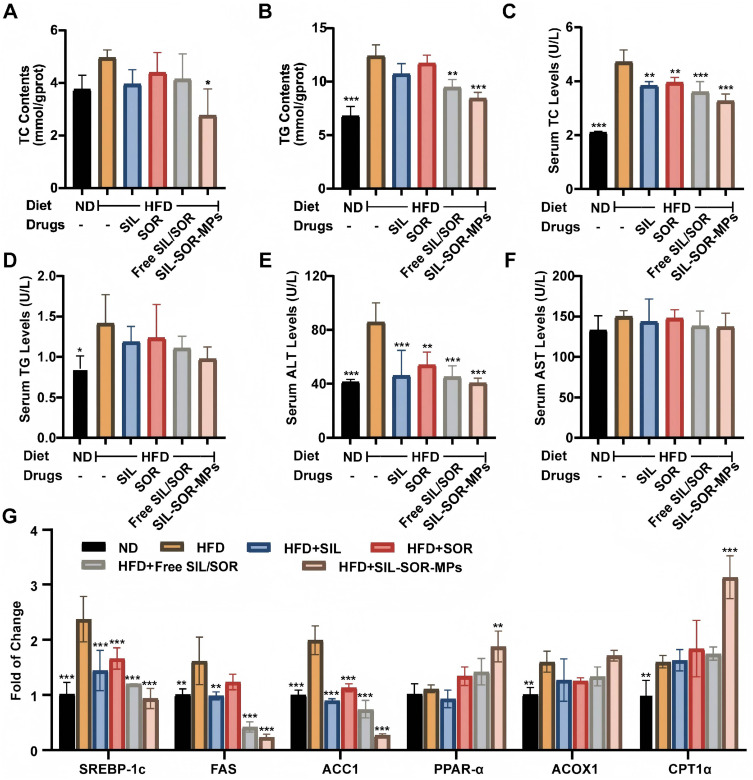
Introduction: Metabolic dysfunction-associated steatotic liver disease (MASLD), characterized by excessive fat accumulation in the liver, is the most prevalent cause of chronic liver disease globally. The clinical use of pharmacological agents such as silibinin and sorafenib is limited due to poor water solubility, low bioavailability, and potential side effects, necessitating innovative therapeutic approaches.
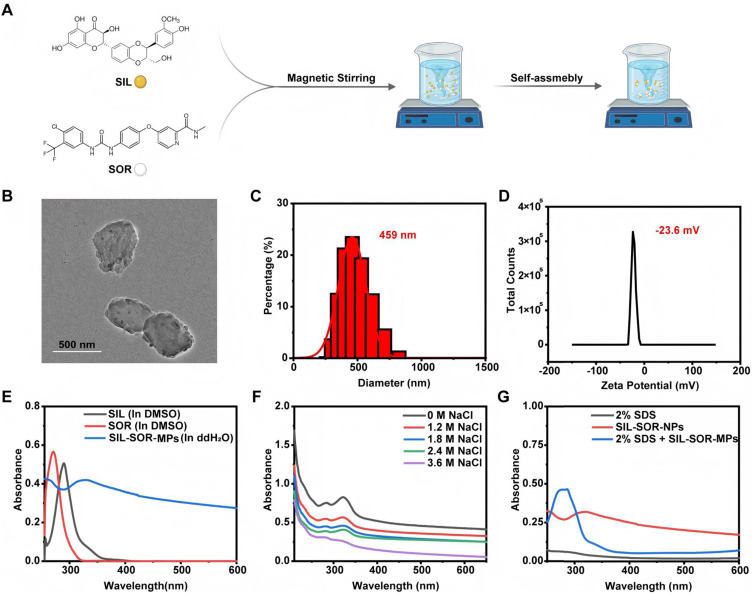
Methods: In this study, we developed self-assembled, carrier-free microparticles of silibinin and sorafenib (SIL-SOR-MPs) using magnetic stirring and evaluated their therapeutic effects on MASLD both in vitro and in vivo.
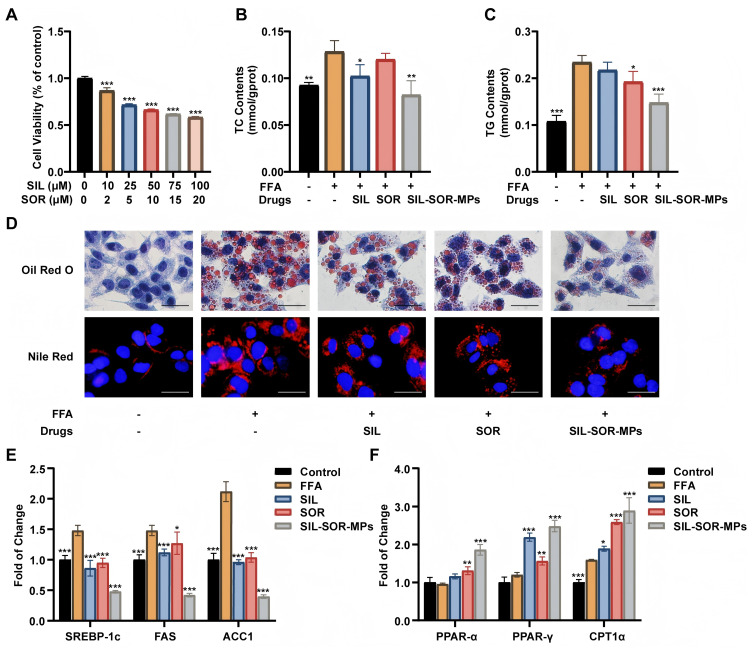
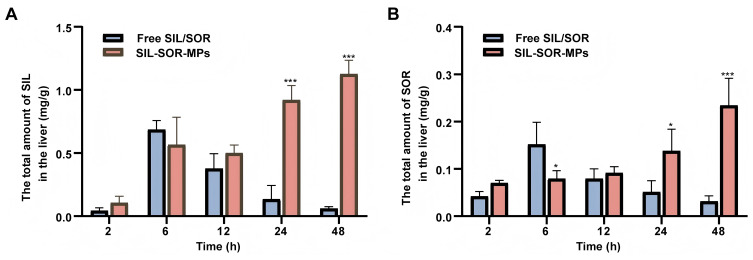
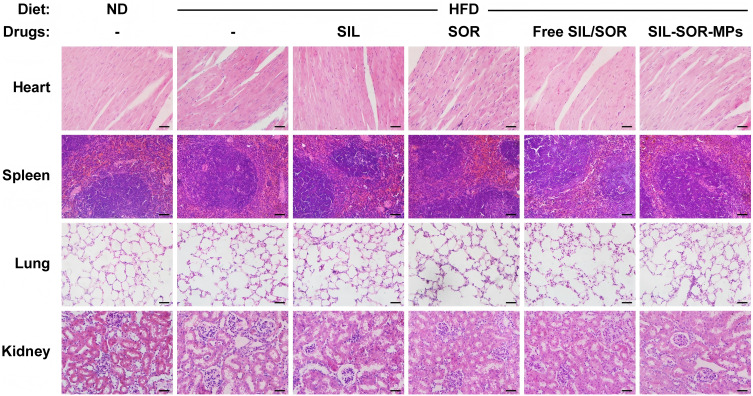
Results: Compared to free SIL and free SOR, SIL-SOR-MPs significantly reduced lipid accumulation in HepG2 cells and effectively alleviated hepatic steatosis and liver damage in mice. Mechanistic investigations further showed that SIL-SOR-MPs more effectively down-regulated lipid synthesis genes and up-regulated genes involved in lipid oxidation.
Discussion: In summary, our study highlights that carrier-free SIL-SOR-MPs demonstrate the ability to reverse the progression of MASLD and present a promising therapeutic strategy.
Keywords: fatty acid metabolism; metabolic dysfunction-associated steatotic liver disease; self-assembled carrier-free microparticles; silibinin; sorafenib.
© 2025 Han et al.
Conflict of interest statement
The authors declare that they have no known competing financial interests or personal relationships that could have appeared to influence the work reported in this paper.
Figures
Similar articles
-
Polyoxometalates Ameliorate Metabolic Dysfunction-Associated Steatotic Liver Disease by Activating the AMPK Signaling Pathway.Int J Nanomedicine. 2024 Oct 25;19:10839-10856. doi: 10.2147/IJN.S485084. eCollection 2024. Int J Nanomedicine. 2024. PMID: 39479173 Free PMC article.
-
2,5-Dihydroxybenzoic Acid Ameliorates Metabolic Dysfunction-Associated Steatotic Liver Disease by Targeting the CCL2-CCR2 Axis to Reduce Lipid Accumulation.Nutrients. 2025 May 28;17(11):1835. doi: 10.3390/nu17111835. Nutrients. 2025. PMID: 40507104 Free PMC article.
-
Tat-Beclin-1 Peptide Ameliorates Metabolic Dysfunction-Associated Steatotic Liver Disease by Enhancing Hepatic Autophagy.Int J Mol Sci. 2024 Nov 18;25(22):12372. doi: 10.3390/ijms252212372. Int J Mol Sci. 2024. PMID: 39596437 Free PMC article.
-
Influence of Lipid Class Used for Omega-3 Fatty Acid Supplementation on Liver Fat Accumulation in MASLD.Physiol Res. 2024 Aug 31;73(Suppl 1):S295-S320. doi: 10.33549/physiolres.935396. Epub 2024 Jul 17. Physiol Res. 2024. PMID: 39016154 Free PMC article. Review.
-
Exploring the Role of Bempedoic Acid in Metabolic Dysfunction Associated Steatotic Liver Disease: Actual Evidence and Future Perspectives.Int J Mol Sci. 2024 Jun 25;25(13):6938. doi: 10.3390/ijms25136938. Int J Mol Sci. 2024. PMID: 39000046 Free PMC article. Review.
References
MeSH terms
Substances
LinkOut - more resources
Full Text Sources
