. 2025 May 20;30(1):142.
doi: 10.3892/etm.2025.12892. eCollection 2025 Jul.

Analysis of a pan-cancer panel reveals the amino acid metabolism-related gene MTHFD1 as a potential prognostic and immunotherapeutic biomarker

Affiliations

Analysis of a pan-cancer panel reveals the amino acid metabolism-related gene MTHFD1 as a potential prognostic and immunotherapeutic biomarker

Shunsong Gong et al. Exp Ther Med. .

Abstract

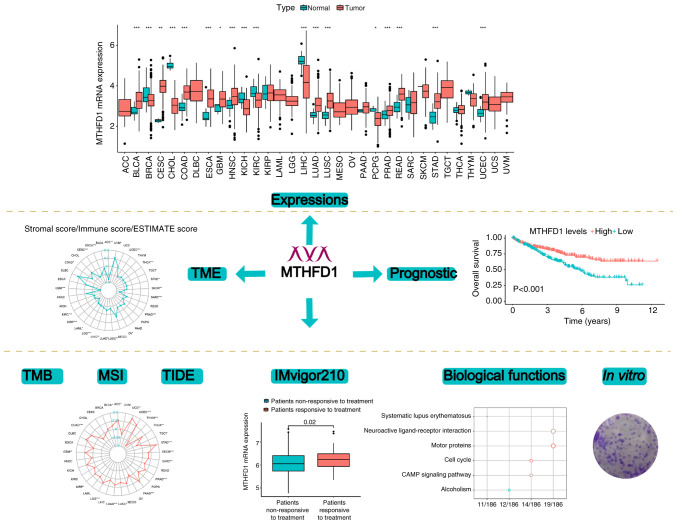
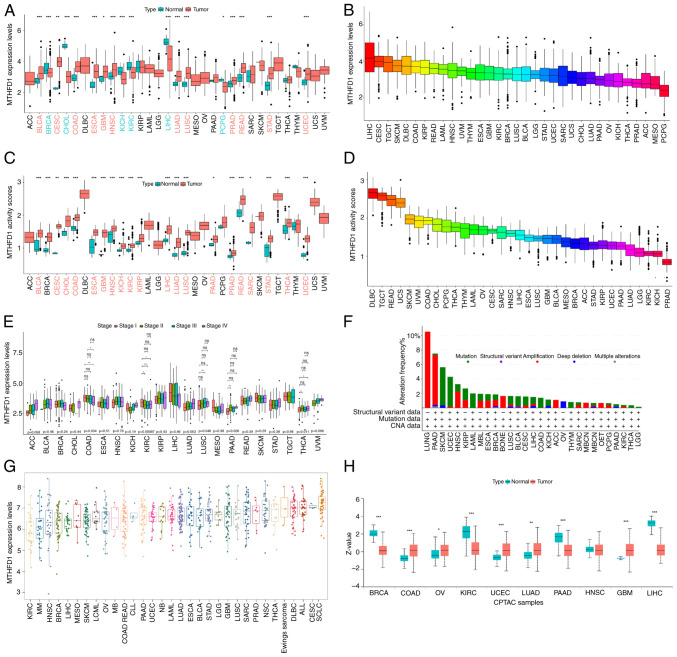
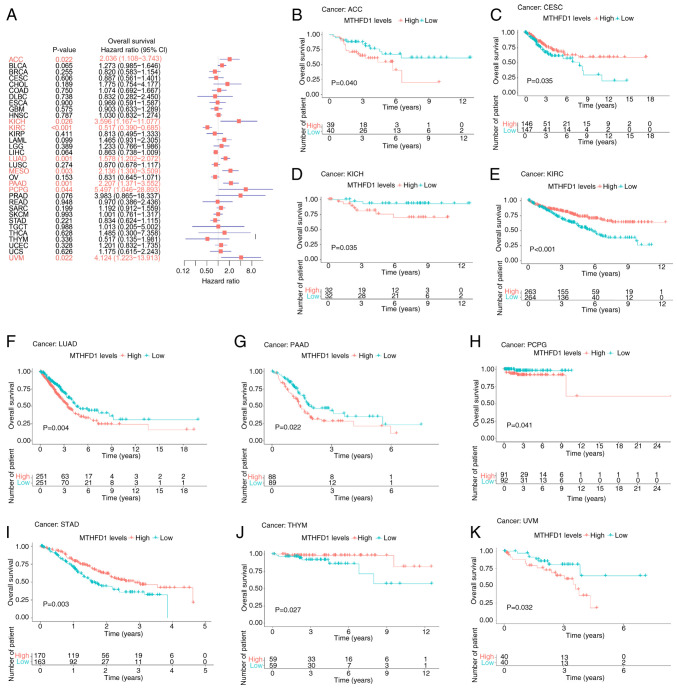
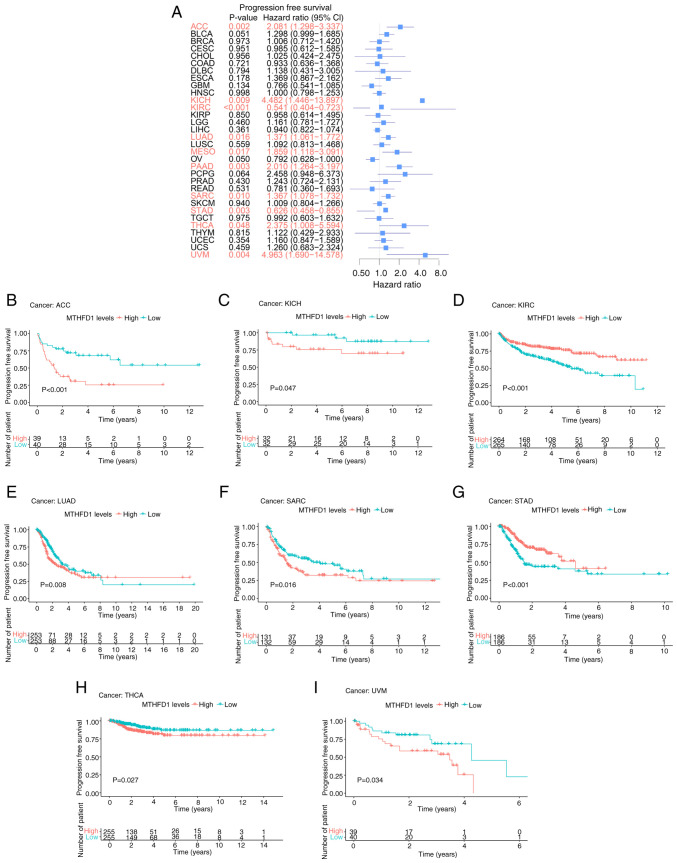
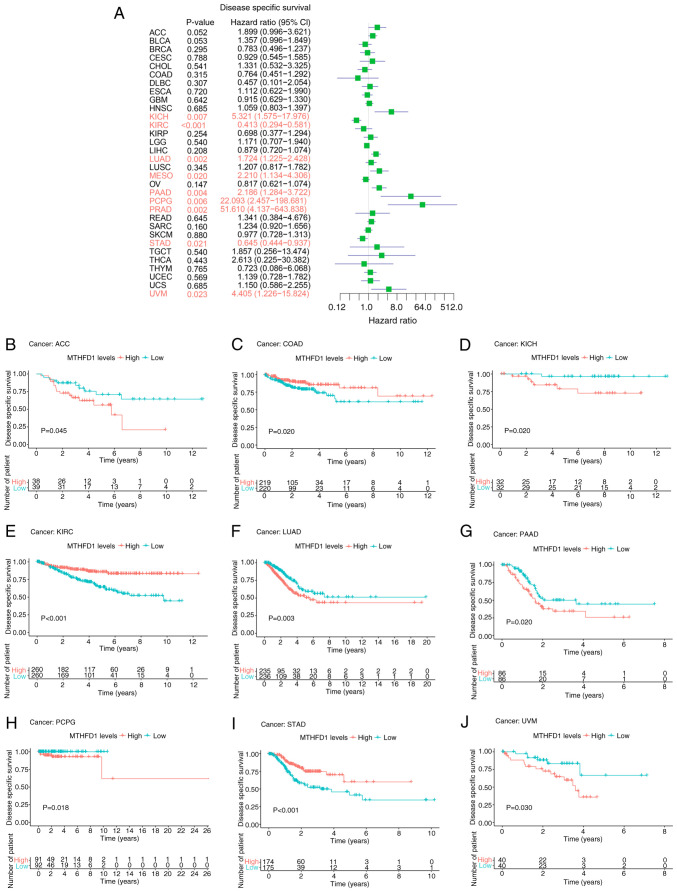
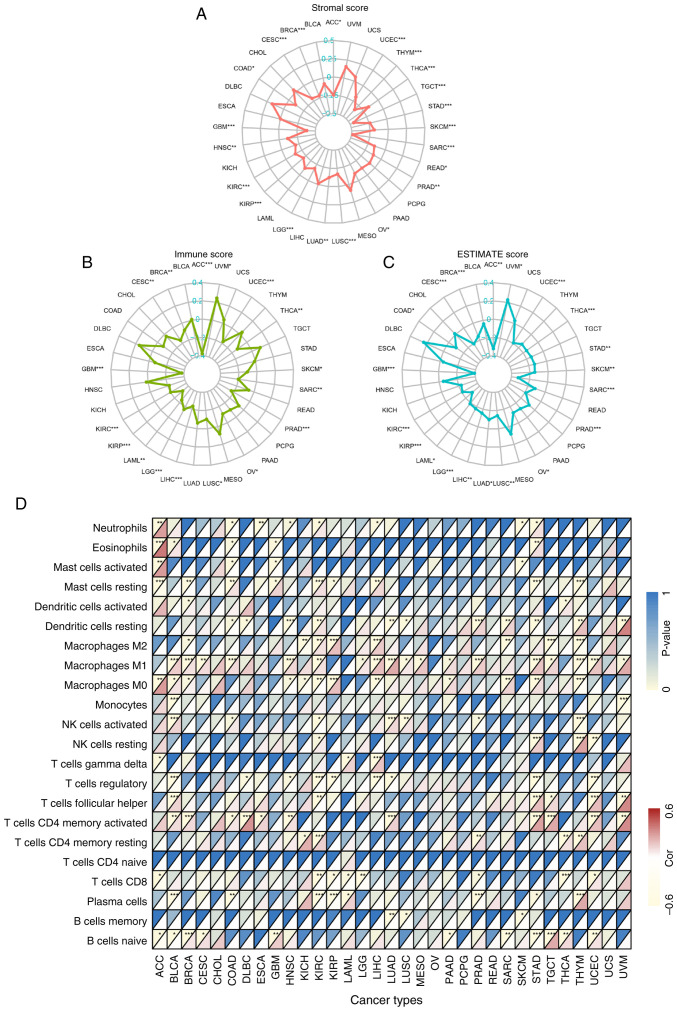
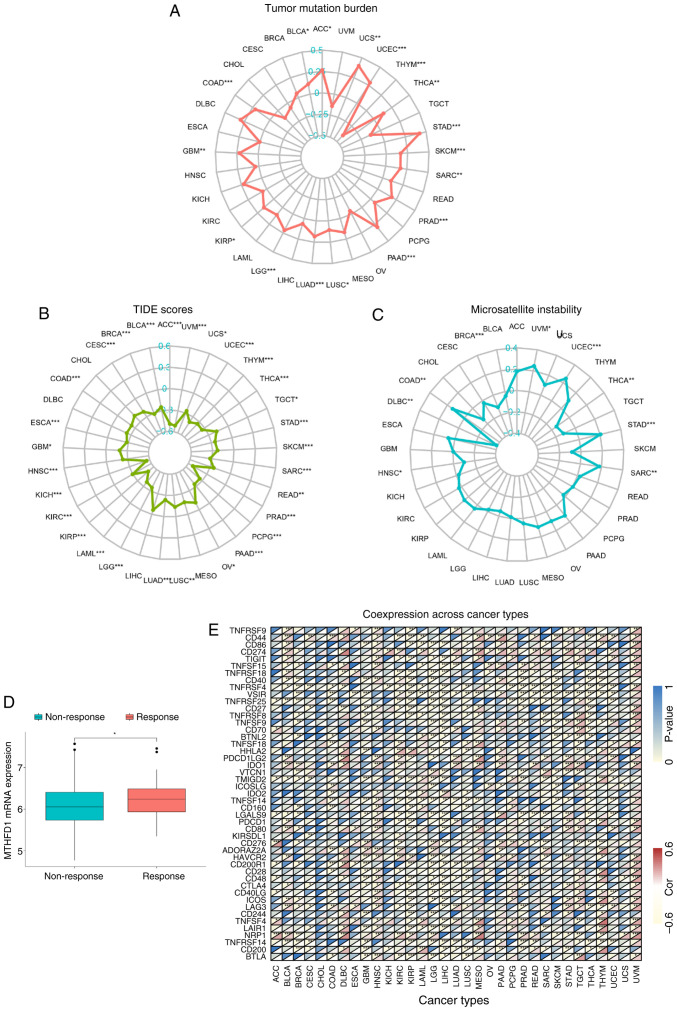
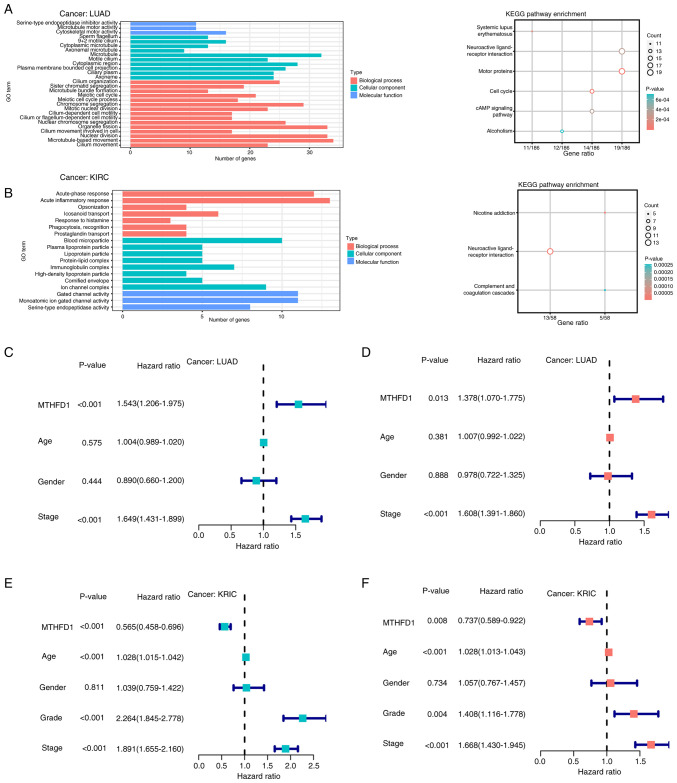
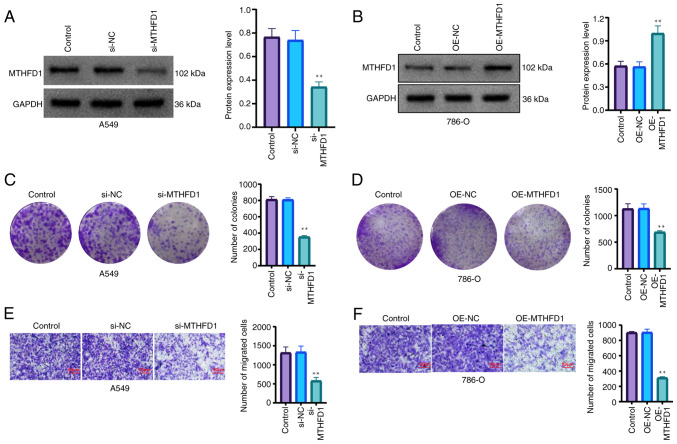
Methylenetetrahydrofolate dehydrogenase 1 (MTHFD1) serves a role in amino acid metabolism and may influence tumor progression. However, to the best of our knowledge, a comprehensive analysis of MTHFD1 in various types of cancer has not been previously performed. Therefore, the present study aimed to investigate the expression profile and prognostic implication of MTHFD1 across various types of cancer, whilst assessing its potential as a novel biomarker and therapeutic target. The expression of MTHFD1 in tissues from various types of cancer was analyzed using online tools based on data from the Cancer Cell Line Encyclopedia and Clinical Proteomic Tumor Analysis Consortium, as well as in-house differential expression analysis using data from The Cancer Genome Atlas (TCGA). The association between MTHFD1 and prognosis was investigated using Kaplan-Meier survival analysis and Cox proportional hazards regression analysis based on TCGA datasets. Furthermore, the association between MTHFD1 and the tumor microenvironment (TME) was investigated using the 'estimation of stromal and immune cells in malignant tumor tissues using expression data' and 'cell-type identification by estimating relative subsets of RNA transcripts' algorithms. The correlation between MTHFD1 expression and tumor mutational burden (TMB), microsatellite instability (MSI) or 48 immune checkpoint blockade-related gene expression levels was investigated using Pearson correlation analyses. The predictive potential of MTHFD1 for immunotherapy efficacy was evaluated using the tumor immune dysfunction and exclusion (TIDE) algorithm with the IMvigor210 dataset. Subsequently, the effects of MTHFD1 on the proliferation and invasion of A549 and 786-O cell lines were assessed using colony formation and Transwell assays. Analysis across 33 tumor types revealed that MTHFD1 expression was significantly upregulated in 12 cancers (e.g., bladder urothelial carcinoma) and downregulated in 6 cancers (e.g., breast invasive carcinoma). Moreover, high MTHFD1 expression was associated with a poorer prognosis in kidney chromophobe and lung adenocarcinoma, but with better prognosis in kidney renal clear cell carcinoma. Additionally, the activity of MTHFD1, evaluated using the single-sample Gene Set Enrichment Analysis algorithm, was significantly upregulated in 21 cancer types, including bladder urothelial carcinoma and breast invasive carcinoma, compared with corresponding normal tissues. MTHFD1expression levels were negatively correlated with immune cell infiltration in 16 tumor types [e.g., adrenocortical carcinoma (ACC)] and positively correlated only in uveal melanoma (UVM). Additionally, MTHFD1 expression levels showed significant correlations with TMB in 17 tumors (e.g., ACC), were negatively correlated with TIDE scores in most tumors except mesothelioma, liver hepatocellular carcinoma, diffuse large B-cell lymphoma and cholangiocarcinoma, and were associated with MSI in 9 tumor types (e.g., UVM). Multivariant Cox regression analysis revealed that MTHFD1 expression was an independent risk factor for prognosis in lung adenocarcinoma, whilst it was an independent protective factor in clear cell renal cell carcinoma, highlighting its distinct prognostic roles in these two tumor types. In vitro experiments found that knocking down or overexpressing MTHFD1 in A549 and 786-O cells, respectively, reduced the corresponding malignant phenotypes. Overall, to the best of our knowledge, results of the present study provided the first comprehensive analysis of MTHFD1 as a potential cancer biomarker and highlighted its role in immune suppression within the TME. These findings suggested that targeting MTHFD1 may be a novel therapeutic strategy, which may enhance the efficacy of immunotherapy and improve the outcomes of patients with various types of cancer.

Keywords: biomarker; immunotherapeutic; methylenetetrahydrofolate dehydrogenase 1; pan-cancer; prognostic.


Conflict of interest statement

The authors declare that they have no competing interests.

Figures

Figure 1
Figure 1
Flow chart of the progression of experiments used in the present study. MTHFD1, methylenetetrahydrofolate dehydrogenase 1; TME, tumor microenvironment; ESTIMATE, estimation of stromal and immune cells in malignant tumor tissues using expression data; TMB, tumor mutational burden; MSI, microsatellite instability; TIDE, tumor immune dysfunction and exclusion.
Figure 2
Figure 2
Analysis of MTHFD1 mRNA expression levels, activity and alterations across 33 types of cancer. (A) Boxplots showing MTHFD1 mRNA expression levels in tumor tissues compared with normal tissues across different types of cancer. (B) Comparison of MTHFD1 mRNA expression levels across different types of cancer. (C) Boxplots indicating the MTHFD1 activity levels, as determined by the ssGSEA algorithm, in tumor tissues compared with normal tissues across different types of cancer. (D) Distribution of MTHFD1 activity, as determined by the ssGSEA algorithm, across different types of tumor. (E) MTHFD1 mRNA expression levels across different clinical stages in different types of tumor. (F) Bar graph showing the frequency of alterations in MTHFD1 within different types of cancer. (G) MTHFD1 expression levels across different cancer cell lines. (H) Comparison of MTHFD1 expression levels between tumor and normal tissues in the CPTAC dataset. *P<0.05, **P<0.01 and ***P<0.001. For certain cancer types (e.g., ACC, UCS, UVM), the ‘normal’ MTHFD1 expression levels are not shown as these data are not available in the TCGA database used for analysis. MTHFD1, methylenetetrahydrofolate dehydrogenase 1; ACC, adrenal carcinoma; BLCA, bladder urothelial carcinoma; BRCA, breast invasive carcinoma; CESC, cervical squamous cell carcinoma; CHOL, cholangiocarcinoma; COAD, colon adenocarcinoma; DLBC, diffuse large B-cell lymphoma; ESCA, esophageal carcinoma; GBM, glioblastoma multiforme; HNSC, head and neck squamous cell carcinoma; KIRC, kidney renal clear cell carcinoma; KIRP, kidney renal papillary cell carcinoma; LGG, low-grade glioma; LIHC, liver hepatocellular carcinoma; LUAD, lung adenocarcinoma; LUSC, lung squamous cell carcinoma; OV, ovarian serous cystadenocarcinoma; PAAD, pancreatic adenocarcinoma; PCPG, pheochromocytoma and paraganglioma; PRAD, prostate adenocarcinoma; READ, rectum adenocarcinoma; SARC, sarcoma; SKCM, skin cutaneous melanoma; STAD, stomach adenocarcinoma; TGCT, testicular germ cell tumors; THCA, thyroid carcinoma; THYM, thymoma; UCEC, uterine corpus endometrial carcinoma; UVM, uveal melanoma; CAN, copy number alteration; CTPA, CPTAC dataset for protein expression in cancer; ssGSEA, single-sample gene set enrichment analysis; Z-Score, standardized value for the data points.
Figure 3
Figure 3
Prognostic value of MTHFD1 in 33 types of tumor based on OS. (A) Forest plot indicating the predictive value of MTHFD1expression for OS across different types of cancer. Kaplan-Meier survival curves demonstrating the differences in OS between patients with high or low MTHFD1 expression levels in (B) ACC, (C) CESC, (D) KICH, (E) KIRC, (F) LUAD, (G) PAAD, (H) PCPG, (I) STAD, (J) THYM and (K) UVM. MTHFD1, methylenetetrahydrofolate dehydrogenase 1; OS, overall survival; ACC, adrenal carcinoma; BLCA, bladder urothelial carcinoma; BRCA, breast invasive carcinoma; CESC, cervical squamous cell carcinoma; CHOL, cholangiocarcinoma; COAD, colon adenocarcinoma; DLBC, diffuse large B-cell lymphoma; ESCA, esophageal carcinoma; GBM, glioblastoma multiforme; HNSC, head and neck squamous cell carcinoma; KIRC, kidney renal clear cell carcinoma; KIRP, kidney renal papillary cell carcinoma; LGG, low-grade glioma; LIHC, liver hepatocellular carcinoma; LUAD, lung adenocarcinoma; LUSC, lung squamous cell carcinoma; OV, ovarian serous cystadenocarcinoma; PAAD, pancreatic adenocarcinoma; PCPG, pheochromocytoma and paraganglioma; PRAD, prostate adenocarcinoma; READ, rectum adenocarcinoma; SARC, sarcoma; SKCM, skin cutaneous melanoma; STAD, stomach adenocarcinoma; TGCT, testicular germ cell tumor; THCA, thyroid carcinoma; THYM, thymoma; UCEC, uterine corpus endometrial carcinoma; UVM, uveal melanoma.
Figure 4
Figure 4
Prognostic value of MTHFD1 in 33 types of tumor based on PFS. (A) Forest plot indicating the predictive value of MTHFD1 for PFS across different types of cancer. Kaplan-Meier survival curves demonstrating the differences in PFS between patients with high or low MTHFD1 expression levels in (B) ACC, (C) KICH, (D) KIRC, (E) LUAD, (F) SARC, (G) STAD, (H) THCA and (I) UVM. PFS, progression-free survival; MTHFD1, methylenetetrahydrofolate dehydrogenase 1; ACC, adrenal carcinoma; BLCA, bladder urothelial carcinoma; BRCA, breast invasive carcinoma; CESC, cervical squamous cell carcinoma; CHOL, cholangiocarcinoma; COAD, colon adenocarcinoma; DLBC, diffuse large B-cell lymphoma; ESCA, esophageal carcinoma; GBM, glioblastoma multiforme; HNSC, head and neck squamous cell carcinoma; KIRC, kidney renal clear cell carcinoma; KIRP, kidney renal papillary cell carcinoma; LGG, low-grade glioma; LIHC, liver hepatocellular carcinoma; LUAD, lung adenocarcinoma; LUSC, lung squamous cell carcinoma; OV, ovarian serous cystadenocarcinoma; PAAD, pancreatic adenocarcinoma; PCPG, pheochromocytoma and paraganglioma; PRAD, prostate adenocarcinoma; READ, rectum adenocarcinoma; SARC, sarcoma; SKCM, skin cutaneous melanoma; STAD, stomach adenocarcinoma; TGCT, testicular germ cell tumor; THCA, thyroid carcinoma; THYM, thymoma; UCEC, uterine corpus endometrial carcinoma; UVM, uveal melanoma.
Figure 5
Figure 5
Prognostic value of MTHFD1 in 33 types of tumor based on DSS. (A) Forest plot showing the predictive value of MTHFD1 for DSS across different types of cancer. Kaplan-Meier survival curves demonstrating the differences in DSS between patients with high or low MTHFD1 expression levels in (B) ACC, (C) COAD, (D) KICH, (E) KIRC, (F) LUAD, (G) PAAD, (H) PCPG, (I) STAD and (J) UVM. MTHFD1, methylenetetrahydrofolate dehydrogenase 1; DSS, disease-specific survival; ACC, adrenal carcinoma; BLCA, bladder urothelial carcinoma; BRCA, breast invasive carcinoma; CESC, cervical squamous cell carcinoma; CHOL, cholangiocarcinoma; COAD, colon adenocarcinoma; DLBC, diffuse large B-cell lymphoma; ESCA, esophageal carcinoma; GBM, glioblastoma multiforme; HNSC, head and neck squamous cell carcinoma; KIRC, kidney renal clear cell carcinoma; KIRP, kidney renal papillary cell carcinoma; LGG, low-grade glioma; LIHC, liver hepatocellular carcinoma; LUAD, lung adenocarcinoma; LUSC, lung squamous cell carcinoma; OV, ovarian serous cystadenocarcinoma; PAAD, pancreatic adenocarcinoma; PCPG, pheochromocytoma and paraganglioma; PRAD, prostate adenocarcinoma; READ, rectum adenocarcinoma; SARC, sarcoma; SKCM, skin cutaneous melanoma; STAD, stomach adenocarcinoma; TGCT, testicular germ cell tumor; THCA, thyroid carcinoma; THYM, thymoma; UCEC, uterine corpus endometrial carcinoma; UVM, uveal melanoma.
Figure 6
Figure 6
Correlation between the MTHFD1 expression level and the tumor microenvironment in 33 types of tumor. Radar plots demonstrating the correlation between MTHFD1 expression levels and (A) stromal, (B) immune and (C) ESTIMATE scores in different types of cancer. (D) Heatmap indicating the correlation between MTHFD1 expression levels and the abundance of 22 immune cell infiltrates in different types of cancer. In each grid, the lower triangle represents the correlation coefficient, where red indicates positive correlation and yellow indicates negative correlation. The upper triangle represents the corresponding P-value, with deeper blue indicating a smaller P-value (greater statistical significance). *P<0.05, **P<0.01 and ***P<0.001. MTHFD1, methylenetetrahydrofolate dehydrogenase 1; ACC, adrenal carcinoma; BLCA, bladder urothelial carcinoma; BRCA, breast invasive carcinoma; CESC, cervical squamous cell carcinoma; CHOL, cholangiocarcinoma; COAD, colon adenocarcinoma; DLBC, diffuse large B-cell lymphoma; ESCA, esophageal carcinoma; GBM, glioblastoma multiforme; HNSC, head and neck squamous cell carcinoma; KIRC, kidney renal clear cell carcinoma; KIRP, kidney renal papillary cell carcinoma; LGG, low-grade glioma; LIHC, liver hepatocellular carcinoma; LUAD, lung adenocarcinoma; LUSC, lung squamous cell carcinoma; OV, ovarian serous cystadenocarcinoma; PAAD, pancreatic adenocarcinoma; PCPG, pheochromocytoma and paraganglioma; PRAD, prostate adenocarcinoma; READ, rectum adenocarcinoma; SARC, sarcoma; SKCM, skin cutaneous melanoma; STAD, stomach adenocarcinoma; TGCT, testicular germ cell tumor; THCA, thyroid carcinoma; THYM, thymoma; UCEC, uterine corpus endometrial carcinoma; UVM, uveal melanoma.
Figure 7
Figure 7
Predictive potential of MTHFD1 in immunotherapy across 33 types of tumor. Radar plots demonstrating the correlation between MTHFD1 and (A) tumor mutational burden, (B) TIDE scores and (C) microsatellite instability in different types of cancer. (D) Boxplot of the IMvigor210 dataset showing the differences in MTHFD1 expression levels between patients who responded to atezolizumab (PD-L1 inhibitor) treatment and those who did not. (E) Heatmap indicating the correlation between the expression of MTHFD1 and 48 immune checkpoint blockade-related genes in different types of cancer. In each grid, the lower triangle represents the correlation coefficient, where red indicates positive correlation and yellow indicates negative correlation. The upper triangle represents the corresponding P-value, with deeper blue indicating a smaller P-value (greater statistical significance). *P<0.05, **P<0.01 and ***P<0.001. MTHFD1, methylenetetrahydrofolate dehydrogenase 1; TIDE, tumor immune dysfunction, and exclusion; ACC, adrenal carcinoma; BLCA, bladder urothelial carcinoma; BRCA, breast invasive carcinoma; CESC, cervical squamous cell carcinoma; CHOL, cholangiocarcinoma; COAD, colon adenocarcinoma; DLBC, diffuse large B-cell lymphoma; ESCA, esophageal carcinoma; GBM, glioblastoma multiforme; HNSC, head and neck squamous cell carcinoma; KIRC, kidney renal clear cell carcinoma; KIRP, kidney renal papillary cell carcinoma; LGG, low-grade glioma; LIHC, liver hepatocellular carcinoma; LUAD, lung adenocarcinoma; LUSC, lung squamous cell carcinoma; OV, ovarian serous cystadenocarcinoma; PAAD, pancreatic adenocarcinoma; PCPG, pheochromocytoma and paraganglioma; PRAD, prostate adenocarcinoma; READ, rectum adenocarcinoma; SARC, sarcoma; SKCM, skin cutaneous melanoma; STAD, stomach adenocarcinoma; TGCT, testicular germ cell tumor; THCA, thyroid carcinoma; THYM, thymoma; UCEC, uterine corpus endometrial carcinoma; UVM, uveal melanoma.
Figure 8
Figure 8
Role of MTHFD1 in LUAD and KIRC. GO and KEGG analysis of the biological functions of differentially expressed genes between the high and low MTHFD1 expression level groups in (A) LUAD and (B) KIRC. Forest plots showing (C) univariate and (D) multivariate Cox analyses of MTHFD1 in LUAD. Forest plots showing the (E) univariate and (F) multivariate Cox analyses of MTHFD1 in KIRC. MTHFD1, methylenetetrahydrofolate dehydrogenase 1; GO, Gene Ontology; KEGG, Kyoto Encyclopedia of Genes and Genomes; LUAD, lung adenocarcinoma; KIRC, kidney renal clear cell carcinoma.
Figure 9
Figure 9
Role of MTHFD1 in LUAD and KIRC cell lines. Western blot analysis showing the expression of MTHFD1 after transfection with (A) si-MTHFD1 in LUAD or (B) OE-MTHFD1 plasmids in KICH cell lines. Colony formation assay demonstrating the proliferation of cells after transfection with (C) si-MTHFD1 in LUAD or (D) OE-MTHFD1 plasmids in KICH cell lines. Transwell migration assay showing the migration of cells after transfection with (E) si-MTHFD1 in LUAD or (F) OE-MTHFD1 plasmids in KICH cell lines. **P<0.01. MTHFD1, methylenetetrahydrofolate dehydrogenase 1; LUAD, lung adenocarcinoma; KIRC, kidney renal clear cell carcinoma; si; small interfering; OE, overexpression; NC, negative control.

Similar articles

References

    1. Sung H, Ferlay J, Siegel RL, Laversanne M, Soerjomataram I, Jemal A, Bray F. Global cancer statistics 2020: GLOBOCAN estimates of incidence and mortality worldwide for 36 cancers in 185 countries. CA Cancer J Clin. 2021;71:209–249. doi: 10.3322/caac.21660. - DOI - PubMed
    1. Zeng H, Chen W, Zheng R, Zhang S, Ji JS, Zou X, Xia C, Sun K, Yang Z, Li H, et al. Changing cancer survival in China during 2003-15: A pooled analysis of 17 population-based cancer registries. Lancet Glob Heal. 2018;6:e555–e567. doi: 10.1016/S2214-109X(18)30127-X. - DOI - PubMed
    1. Chang JH, Wu CC, Yuan KSP, Wu ATH, Wu SY. Locoregionally recurrent head and neck squamous cell carcinoma: Incidence, survival, prognostic factors, and treatment outcomes. Oncotarget. 2017;8:55600–55612. doi: 10.18632/oncotarget.16340. - DOI - PMC - PubMed
    1. Nors J, Iversen LH, Erichsen R, Gotschalck KA, Andersen CL. Incidence of recurrence and time to recurrence in stage I to III colorectal cancer: A nationwide Danish cohort study. JAMA Oncol. 2024;10:54–62. doi: 10.1001/jamaoncol.2023.5098. - DOI - PMC - PubMed
    1. Liu X, Ren B, Ren J, Gu M, You L, Zhao Y. The significant role of amino acid metabolic reprogramming in cancer. Cell Commun Signal. 2024;22(380) doi: 10.1186/s12964-024-01760-1. - DOI - PMC - PubMed

LinkOut - more resources