[Preprint]. 2025 May 12:2024.07.23.604835.
doi: 10.1101/2024.07.23.604835.

Multiomic Evidence for a Unified Model of Alzheimer's Disease Etiology Linking Microglial Flux Capacity and Astrocyte-Neuron Metabolic Breakdown

Affiliations

Multiomic Evidence for a Unified Model of Alzheimer's Disease Etiology Linking Microglial Flux Capacity and Astrocyte-Neuron Metabolic Breakdown

Tom Paterson et al. bioRxiv. .

Abstract

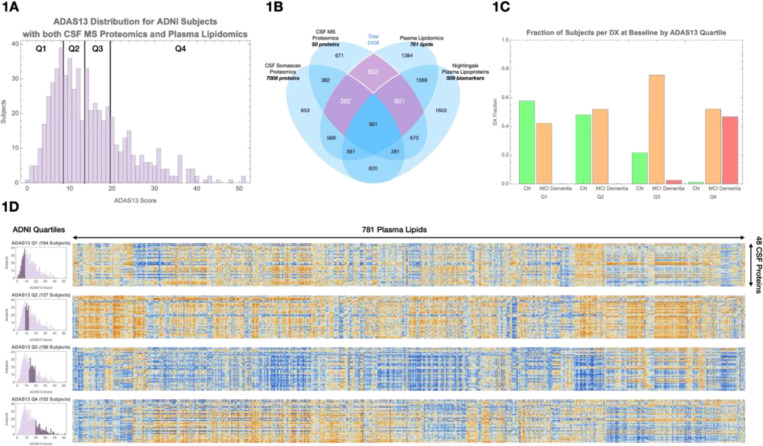
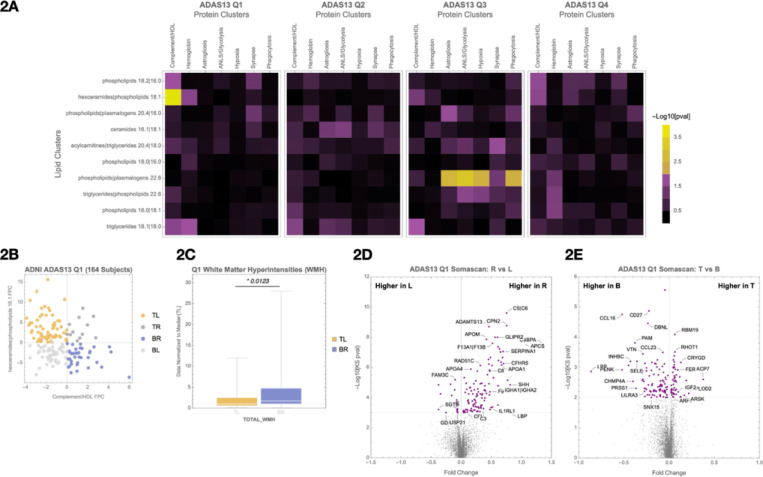
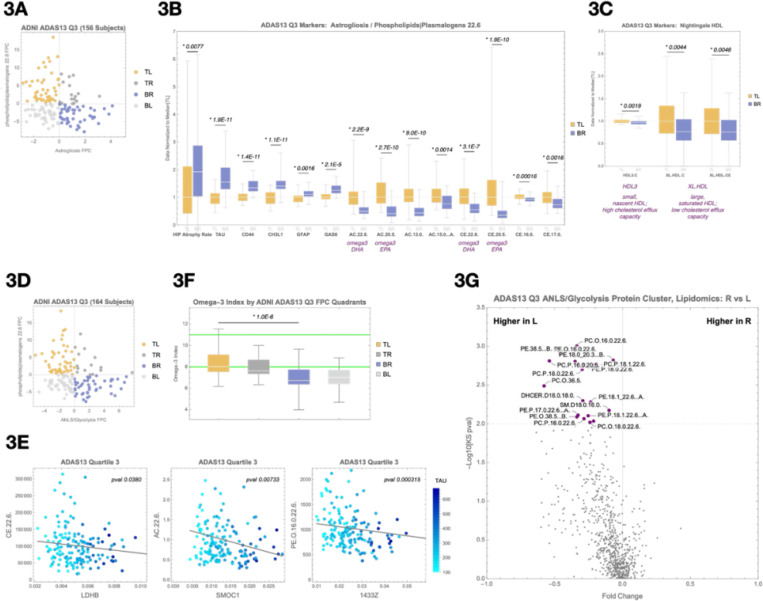
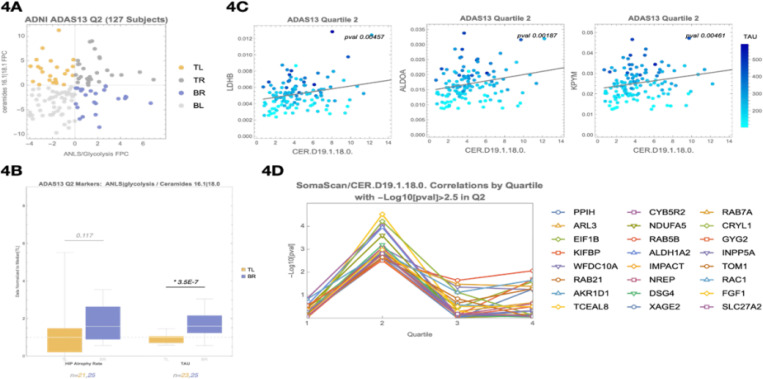
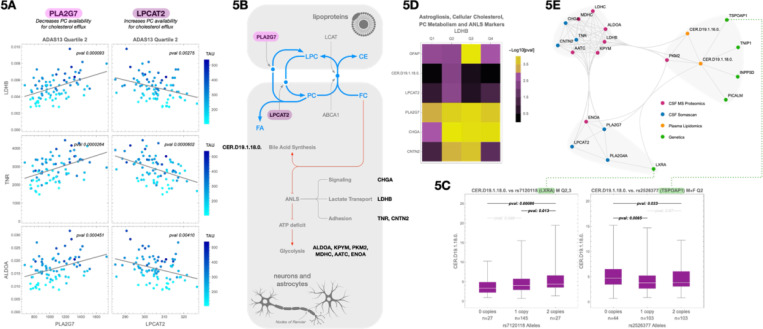
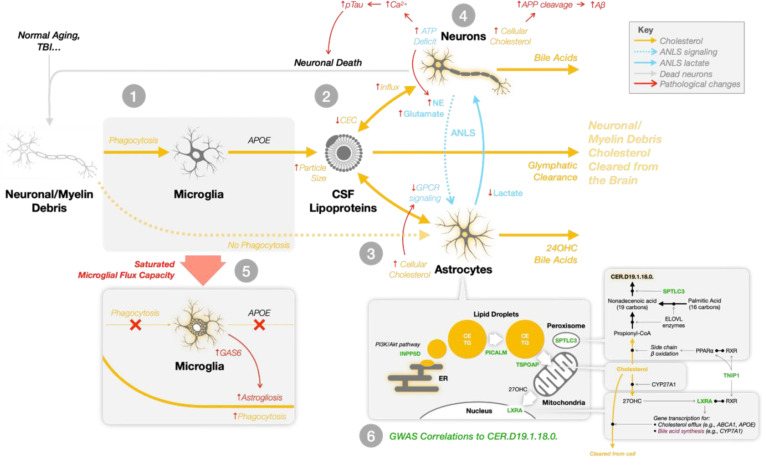
Age and APOE genotype are the strongest known risk factors for late-onset Alzheimer's disease (AD), but the mechanisms linking them to neuronal loss remain incompletely defined. Using multiomic data from the Alzheimer's Disease Neuroimaging Initiative (ADNI), we propose a unified hypothesis in which two interdependent failure modes-saturation of microglial lipid flux capacity and disruption of the astrocyte-neuron lactate shuttle (ANLS) due to excess astrocytic membrane cholesterol-drive disease progression upstream of amyloid and tau pathology. Stratifying participants by cognitive score quartiles, we find consistent associations linking impaired lipid clearance, metabolic stress, and genetic variants regulating cholesterol handling. These processes appear to reinforce each other, resulting in accelerating neurodegeneration. Our hypothesis reframes AD as a systems-level collapse in metabolic coordination, rather than a purely linear pathological cascade. These insights emerged during the development of digital twin models for personalized interventions, highlighting the power of systems approaches to reveal hidden drivers of neurodegeneration.


Figures

Figure 1.
Figure 1.. Overview of data selection and inter-omic correlation structure.
(A) Schematic of ADNI multiomic datasets used in this study, including plasma lipidomics, CSF mass spectrometry (MS) proteomics, CSF SomaScan proteomics, and plasma lipoprotein profiles. (B) Selection of 602 participants with paired plasma lipidomic and CSF proteomic data; 362 had additional CSF SomaScan data, and 601 had Nightingale lipoprotein profiles. (C) Distribution of clinical diagnoses across cognitive quartiles based on ADAS13 scores: Q1 = 1–7, Q2 = 8–12, Q3 = 13–18, Q4 = 19–52. (D) Heatmaps of lipid–protein correlations within each cognitive quartile. Blue indicates negative correlations; orange indicates positive correlations. A visible shift in correlation patterns occurs between Q2 and Q3, corresponding to the cognitive transition from normal to mild impairment.
Figure 2.
Figure 2.. Cognitive quartile organization and principal component-based quadrant analysis of lipid and protein clusters.
(A) Participants are grouped into cognitive quartiles based on ADAS13 scores. Within each quartile, correlations between selected plasma lipid and CSF protein clusters are evaluated using first principal component (FPC) values. (B) Scatterplot of participants’ lipid and protein FPC scores, illustrating quadrant definitions: top-left (TL), top-right (TR), bottom-left (BL), and bottom-right (BR). This quadrant structure is used for downstream molecular and clinical comparisons. (C) In Quartile 1 (Q1), comparison of white matter hyperintensity (WMH) burden between TL and BR quadrants. (D) In Q1, SomaScan differential expression analysis comparing Right vs Left quadrants (protein FPC axis). (E) In Q1, SomaScan differential expression analysis comparing Top vs Bottom quadrants (lipid FPC axis). Associated pathway enrichments are shown in Supplementary Figures 2A (D) and 2B (E).
Figure 3.
Figure 3.. Emergence of lipid–protein associations linked to tau pathology and cerebrovascular changes in Quartile 3.
(A) Principal component scatterplot of participants in Q3 based on the astrogliosis protein cluster (x-axis) and the phospholipids | plasmalogens 22.6 lipid cluster (y-axis). (B) Box-and-whisker plots comparing the top-left (TL) and bottom-right (BR) quadrants from (A) across markers of disease progression (hippocampal atrophy rate, tau PET signal), astrogliosis (CD44, CHI3L1, GFAP), beta oxidation (omega-3 and non–omega-3 acylcarnitines), and reverse cholesterol transport (omega-3 and non–omega-3 cholesterol esters). (C) Box-and-whisker plots comparing TL and BR quadrants from Nightingale NMR HDL lipoprotein markers, including HDL3, XL.HDL.C, and XL.HDL.CE. (D) Principal component scatterplot of participants based on the ANLS/glycolysis protein cluster (x-axis) and the phospholipids | plasmalogens 22.6 lipid cluster (y-axis). (E) Representative protein–lipid correlations in Q3, including LDHB–CE.22.6, SMOC1–AC.22.6, and YWHAB (14–3-3 zeta)–PE(O-16:0/22:6) associations. These examples illustrate disrupted coupling between lipid metabolism and astrocyte or glycolytic protein markers under metabolic stress. (F) Comparison of the estimated omega-3 index, calculated from DHA- and non-DHA–containing HDL particles measured by Nightingale NMR, between BR and TL quadrants. Median omega-3 index was significantly lower in the BR quadrant (p = 8.6e-7), suggesting impaired omega-3 availability may contribute to disrupted plasmalogen biosynthesis and astrocyte–neuron metabolic support. (G) SomaScan differential expression analysis comparing Right vs. Left quadrants from (A), visualized as a volcano plot. Notable proteins enriched in the BR quadrant include GFAP and GAS6, consistent with astrocyte activation.
Figure 4.
Figure 4.. A ceramide-enriched lipid cluster, including CER.D19, emerges in Quartile 2 as a marker of flux imbalance and disrupted astrocyte–neuron metabolic support.
(A) PCA-based quadrant analysis of the ANLS/glycolysis protein cluster (x-axis) and a ceramide-enriched lipid cluster (y-axis) in Q2. Participants in the bottom-right (BR) quadrant exhibit higher ANLS/glycolysis protein expression and lower ceramide lipid signal, suggesting a mismatch between increasing metabolic demand and insufficient lipid clearance. (B) Comparison of tau PET signal and hippocampal atrophy rate between TL and BR quadrants defined in (A). Participants in the BR quadrant show a 59% increase in tau PET signal and elevated atrophy rate. (C) Scatter plots showing correlations between CER.D19.1.18.0 and representative ANLS/glycolysis proteins (LDHB, ALDOA, KPYM) in Q2. LDHB–CER.D19.1.18.0 is the strongest association (p = 0.0046), supporting disrupted metabolic coupling at this stage. (D) SomaScan differential expression analysis of CSF proteins associated with CER.D19.1.18.0 levels. Top proteins include RAB21, RAB7A, SLC27A2, RAC1, and FGF1 — involved in lipid droplet trafficking, cholesterol esterification, and oxysterol signaling. These associations were specific to Q2.
Figure 5.
Figure 5.. CER.D19 marks a metabolic inflection point linked to cholesterol overload, bile acid biosynthesis, and GWAS-enriched lipid handling pathways.
(A) Correlations between CSF LDHB (a marker of astrocyte–neuron lactate shuttle activity), TNA and ALDOA and two enzymes involved in cholesterol esterification: PLA2G7 (positive correlation) and LPCAT2 (negative correlation). These associations suggest altered phosphatidylcholine (PC) processing and potential constraints on cholesterol export. (B) Schematic illustration showing how PLA2G7 and LPCAT2 regulate the interconversion of PC and lysophosphatidylcholine (LPC), affecting cholesterol solubilization and packaging into APOE-containing lipoprotein particles for efflux. (C) Representative AD GWAS SNPs associated with CER.D19.1.18.0 levels, including loci near NR1H3 (LXRA) and TSPOAP1, which regulate nuclear cholesterol sensing and mitochondrial cholesterol trafficking, respectively. Additional associated loci are provided in Supplemental Figure 4A and Supplemental Table 4C. (D) Heatmap showing correlations between CSF LDHB and selected markers across all cognitive quartiles. Variables include GFAP (astrogliosis), CER.D19.1.18.0 (cellular cholesterol load), PLA2G7 and LPCAT2 (PC metabolism), and CHGA and CNTN2 (ANLS signaling and adhesion). (E) Summary diagram integrating lipidomic, proteomic, and genetic findings: early CER.D19 elevation coincides with metabolic stress markers (e.g., ANLS disruption), cholesterol overload, bile acid biosynthesis, and the emergence of AD risk gene expression signatures consistent with declining microglial lipid flux capacity.
Figure 6.
Figure 6.. Unified hypothesis of Alzheimer’s disease: progressive collapse of microglial cholesterol flux capacity and astrocyte-neuron metabolic breakdown.
This schematic outlines a multi-step systems-level failure in brain lipid homeostasis that we propose underlies Alzheimer’s disease progression. 1: Microglia phagocytose cholesterol-rich debris from neurons and myelin. This cholesterol is packaged into newly synthesized APOE lipoproteins. 2: These debris-laden particles merge with the existing pool of astrocyte-derived APOE lipoproteins, which are responsible for transporting astrocyte-synthesized cholesterol to neurons. As the size of lipoproteins increases due to debris accumulation, their cholesterol efflux capacity (CEC) via ABCA1 decrease limiting the removal of excess neuronal cholesterol. 3: Elevated cholesterol levels in neurons and astrocytes impair membrane dynamics. In neurons, this drives APP cleavage to amyloid-beta; in astrocytes, cholesterol buildup disrupts GPCR signaling, impairing the astrocyte–neuron lactate shuttle (ANLS) and reducing neuronal access to metabolic fuel. 4: Metabolically vulnerable neurons attempt to compensate through AMPK activation, but remain under-energized. Resultant calcium dysregulation leads to hyperphosphorylation of tau and other stress responses, promoting a feedforward loop of neurodegeneration. 5: As microglial flux capacity is exhausted, astrocytes assume direct phagocytic roles. This induces astrogliosis and further elevates astrocytic cholesterol burden amplifying metabolic disruption and inflammatory signaling. 6: Genetic variants at loci including INPP5D, TSPOAP1, PICALM, TNIP1, NR1H3 (LXRA), and SPTLC3 affect key steps in intracellular cholesterol trafficking and lipid droplet processing. These processes determine whether cholesterol can be shuttled to mitochondria for oxidation and bile acid synthesis or instead accumulates pathologically. Many of these genes were significantly correlated with CER.D19.1.18.0, an odd-chain ceramide that serves as a marker of flux bottleneck and mitochondrial metabolic failure. This model illustrates how failure to clear excess cholesterol disrupts both structural and signaling roles of membrane lipids, deprives neurons of metabolic

Similar articles

References

    1. Alzheimer A., Stelzmann R. A., Schnitzlein H. N. & Murtagh F. R. An english translation of alzheimer’s 1907 paper, “über eine eigenartige erkankung der hirnrinde.” Clin. Anat. 8, 429–431 (1995). - PubMed
    1. Zhao N. et al. Alzheimer’s Risk Factors Age, APOE Genotype, and Sex Drive Distinct Molecular Pathways. Neuron 106, 727–742.e6 (2020). - PMC - PubMed
    1. Romero-Molina C., Garretti F., Andrews S. J., Marcora E. & Goate A. M. Microglial efferocytosis: Diving into the Alzheimer’s disease gene pool. Neuron 110, 3513–3533 (2022). - PubMed
    1. Consortium A. et al. Rare coding variants in PLCG2, ABI3, and TREM2 implicate microglial-mediated innate immunity in Alzheimer’s disease. Nat. Genet. 49, 1373–1384 (2017). - PMC - PubMed
    1. Marchi C. et al. ABCA1- and ABCG1-mediated cholesterol efflux capacity of cerebrospinal fluid is impaired in Alzheimer’s disease. J Lipid Res 60, 1449–1456 (2019). - PMC - PubMed

Publication types

LinkOut - more resources