[Preprint]. 2025 May 16:2025.05.16.654538.
doi: 10.1101/2025.05.16.654538.

Prolonged non-suppressible viremia sustained by a clonally expanded, genomically defective provirus with an immune-evasive HIV protein expression profile

Affiliations

Prolonged non-suppressible viremia sustained by a clonally expanded, genomically defective provirus with an immune-evasive HIV protein expression profile

F Harrison Omondi et al. bioRxiv. .

Abstract

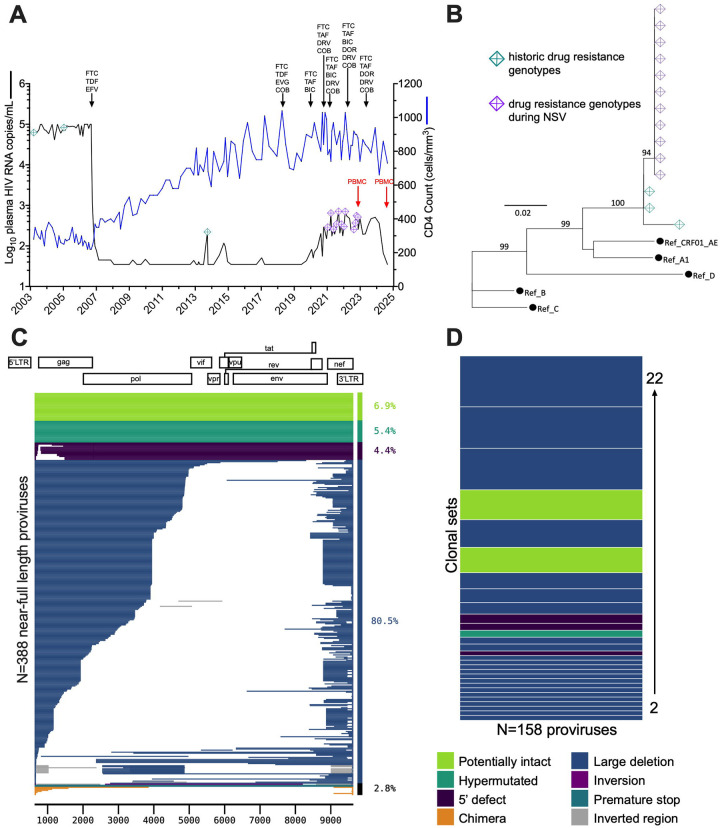
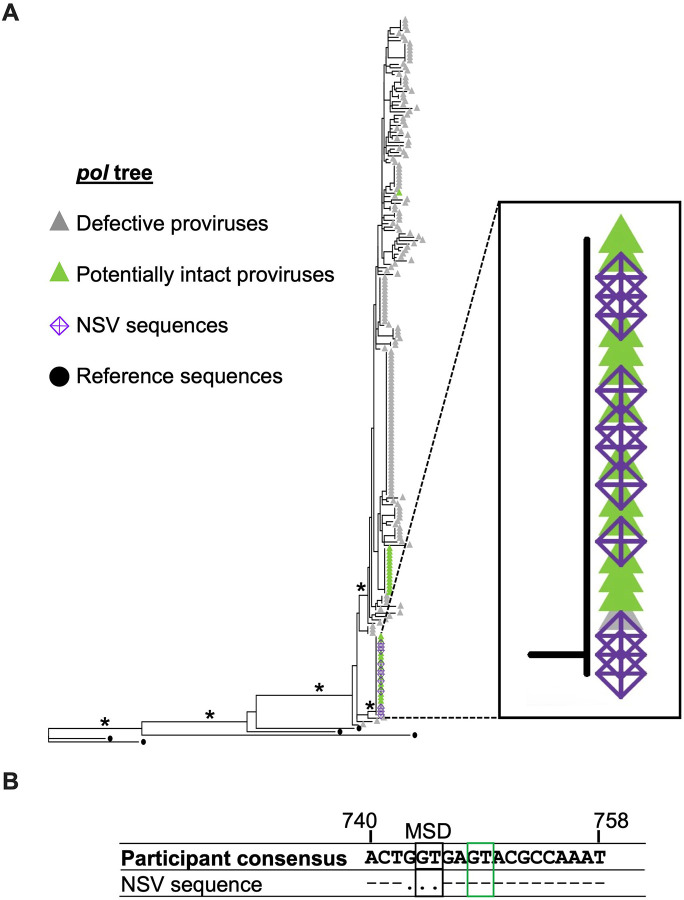
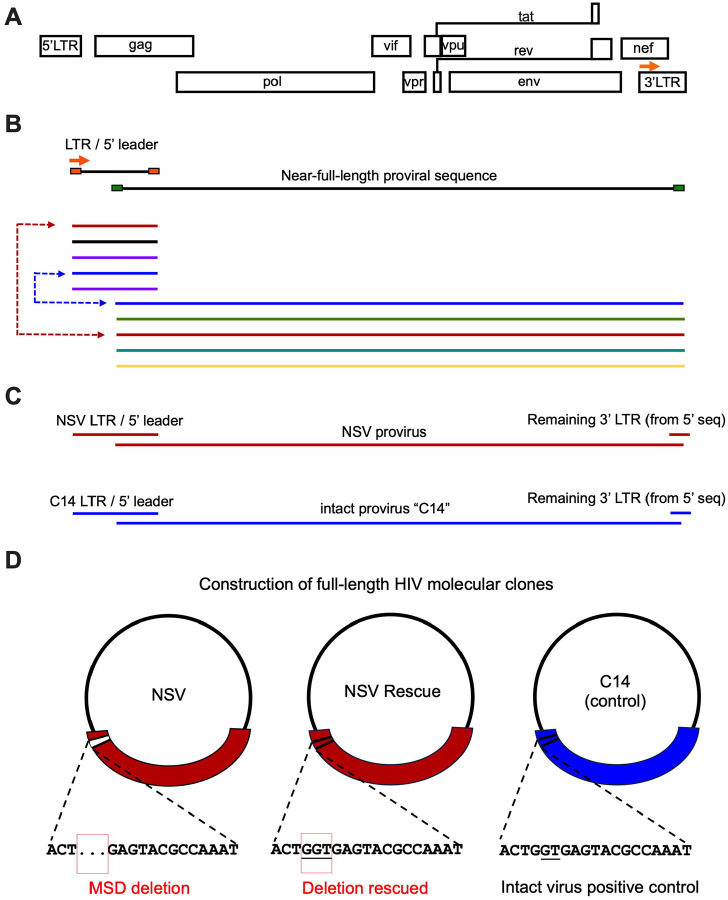
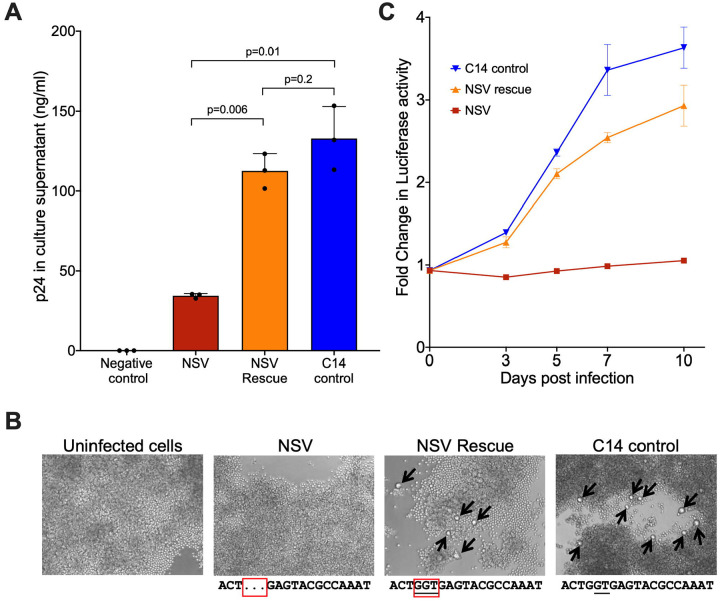
Antiretroviral therapy (ART) potently inhibits HIV replication but does not eliminate HIV proviruses integrated within the genomes of infected cells. Though ART normally suppresses HIV to clinically undetectable levels in blood, some individuals experience non-suppressible viremia (NSV) that is not attributable to suboptimal drug exposure (e.g. due to incomplete medication adherence or pharmacological issues) nor emerging HIV drug resistance, and that does not resolve following regimen modification. We now understand that NSV can originate from expanded cell clones harboring genetically identical proviruses that reactivate en masse to produce clinically detectable viremia. NSV can even originate from proviruses with genomic defects, particularly in HIV's major splice donor (MSD) site, that render the viremia non-infectious. But, because only a limited number of such cases have been described, all in HIV subtype B, the mechanisms that allow cells harboring such proviruses to produce prolonged viremia without being eliminated remain incompletely understood. We characterized a case of MSD-defective, replication-impaired NSV that lasted >4 years in an individual with non-B HIV. Our results reveal that proviruses with MSD deletions can persist by integrating into minimally differentiated CD4+ T-cell subsets that then give rise to the full spectrum of memory and effector subpopulations, and by exhibiting an HIV protein expression profile that would allow these cells to evade cellular and humoral immunity. Our results highlight the need to better understand the biological implications of persistent HIV protein and virion production by genomically defective, clonally expanded proviruses, and for clinical guidelines to acknowledge this type of viremia.


Figures

Figure 1.
Figure 1.. Participant clinical history and sampling timeline.
(A) Plasma viral load (black line), CD4 count (blue line) and antiretroviral history. FTC = emtricitabine; TDF = tenofovir disoproxil fumarate; EFV = efavirenz; EVG = elvitegravir; COB = cobicistat; TAF = tenofovir alafenamide; BIC = bictegravir; DRV = darunavir; DOR = doravirine. NSV occurred from approximately Jan 2020-Sept 2024. Teal and purple crossed diamonds denote HIV drug resistance testing performed before and during NSV, respectively. Red arrows denote peripheral blood mononuclear cells (PBMC) sampling. (B) Maximum likelihood within-host phylogeny of partial pol sequences from drug resistance genotypes performed before and during NSV. Black circles denote reference sequences. Numbers indicate branch support values. Scale is in estimated substitutions per nucleotide site. (C) Proviral landscape plot depicting 388 near-full-length proviruses isolated from blood CD4+ T-cells during NSV, colored according to genomic integrity (white denotes deletions). The frequencies of each provirus type are shown on the right of the plot. (D) Summary of proviral clones with 100% sequence identity, colored according to genomic integrity. Bar height corresponds to clone size. The fourth-largest clone, in light green, is the one that matches the NSV.
Figure 2.
Figure 2.. An exact match was found between NSV and a clonally expanded provirus.
(A) Maximum likelihood within-host phylogeny inferred from 198 non-hypermutated proviral sequences that contained the partial pol region genotyped for HIV drug resistance testing (where green and grey triangles indicate potentially intact and defective proviruses, respectively), along with the 11 identical plasma HIV RNA genotypes performed during the NSV (purple crossed diamonds). The inset shows the proviruses identical to the NSV sequences. Black filled circles denote reference sequences. Asterisks denote branch support values >80%. Scale is in estimated substitutions per nucleotide site. (B) Nucleotide alignment of the participant’s proviral consensus sequence versus the NSV sequence in the major splice donor (MSD) region, with HXB2 genomic coordinates shown above. The black box denotes the MSD, while the green box denotes a known cryptic splice donor site.
Figure 3.
Figure 3.. PCR amplification and construction of three autologous molecular clones.
(A, B) Using autologous primers that bound to the beginning of the participants’ LTR (designed based on the 3’ LTR; orange arrow) and gag respectively, we isolated 81 LTR/gag sequences by single-genome amplification. (C, D) The LTR sequences that best matched each near-full-length provirus of interest was used to construct three full-length molecular clones: the NSV provirus (“NSV”), the NSV provirus with the three-base deletion rescued (“NSV rescue”) and another intact provirus from the participant as a control (“C14 control”). The MSD region of each molecular clone is shown below each plasmid.
Figure 4.
Figure 4.. Assessing virion production and replication capacity of the HIV molecular clones.
(A) The ability of each molecular clone to produce virions was assessed by transfecting equal amounts of plasmid into HEK-293T cells and quantifying p24 in culture supernatants 48 hours later. Bars and whiskers represent the mean and standard deviation of three technical replicates. P-values were calculated using an unpaired t-test with Welch’s correction. (B) Representative microscopy images showing the formation of syncytia (black arrows) in the NSV-rescue and C14-infected, but not NSV-infected cultures, at 10 days post-infection. The MSD region sequence of each virus is shown below each image. (C) Viral spread in culture over 10 days, assessed by quantifying Gaussia luciferase in culture supernatants. Data points and whiskers represent the mean and standard deviation of three technical replicates, respectively.
Figure 5.
Figure 5.. The NSV provirus is found in multiple CD4+ T-cell subsets but is most abundant in effector memory-like CD4+ T-cells.
(A) Representative ddPCR data from the analysis of bulk genomic DNA from 792,000 CD4+ T-cells revealed that the NSV provirus was present at an estimated 32 copies per million total CD4+ T-cells. (B) The flow cytometry plots in the interior of the figure depict the sorting strategy for blood CD4+ T-cell subsets. Blood CD4+ T-cells were isolated by negative selection and then sorted into: Naïve or stem cell memory cells (TN/scm; CD45RA+CD27+; boxed in yellow in the top flow plot); Central or Transitional Memory cells (CM/TM; CD45RA-CD27+; boxed in blue in the bottom flow plot); Effector Memory-like cells (EM; CD45RA-CD27-; boxed in purple in the bottom flow plot); and cells expressing low levels of CD4 (CD4low; boxed in red in the leftmost flow plot). Matching colored arrows point to representative raw ddPCR data from each subset, with estimated NSV provirus copy numbers and total number of cells analyzed shown for each subset.
Figure 6.
Figure 6.. The NSV virus displays impaired envelope expression.
Representative flow cytometry plots showing intracellular p24 and cell-surface Env expression in HEK-293T cells 42 hours post-transfection with control HIV molecular clone plasmids (top row), and participant molecular clones (bottom panel). Data from one of two independent experiments is shown.
Figure 7.
Figure 7.. The NSV robustly downregulates HLA class I and expresses Nef.
(A) Top row: Representative flow cytometry plots showing cell-surface HLA-A*02 expression and intracellular GFP expression in HEK-293T cells transfected with control plasmids, including empty pSELECT-GFP (negative control) and pSELECT-GFP expressing nef from the HIV subtype B reference strain SF2 (positive control). Bottom row: Representative flow cytometry plots showing cell-surface HLA-A*02 and intracellular p24 expression in HEK-293T cells transfected with a full-length NL4–3 molecular clone (positive control) or participant molecular clones. Data from one of three independent experiments is shown. (B) Representative flow cytometry plots showing intracellular Nef expression in HEK-293T cells transfected with control molecular clones (top row) or participant molecular clones (bottom row).
Figure 8.
Figure 8.. The NSV provirus uses two alternative RNA splice donor sites, but overall spliced transcript composition is nevertheless altered.
(A) Nucleotide alignment of NSV and NSV rescue proviruses, showing the MSD (black) and the two alternative splice donor sites used by the NSV provirus: D1* (31 bases upstream; blue) and D1** (4 bases downstream; green). HIV’s Dimerization Initiation Site (DIS) is shown in bold. HXB2 genomic coordinates are shown below the alignment. (B) Genomic map of the NSV provirus, showing the locations of major splice donor and acceptor sites. Individual spliced HIV transcripts detected in cells transfected with equal amounts of NSV and NSV rescue molecular clones are shown below, where the numbers in parentheses denote how many times each transcript was observed. Exons are depicted as horizontal bars, with the first exon colored based on the D1 site used: MSD (black), D1* (blue) or D1** (green). For the splice acceptor sites 4c, a and b, the specific site used is shown to the left of this exon. One nef transcript observed in NSV rescue-transfected cells used an alternative A5 acceptor site, labeled 5*.

Similar articles

References

    1. Palich R, Wirden M, Peytavin G, Lê M-P, Seang S, Abdi B, Schneider L, Tubiana R, Valantin M-A, Paccoud O, Soulié C, Calvez V, Katlama C, Marcelin A-G. 2020. Persistent low-level viraemia in antiretroviral treatment-experienced patients is not linked to viral resistance or inadequate drug concentrations. Journal of Antimicrobial Chemotherapy 75:2981–2985. - PubMed
    1. Trabaud MA, Cotte L, Saison J, Ramière C, Ronfort C, Venet F, Tardy JC, Monneret G, André P. 2015. Persistent Production of an Integrase-Deleted HIV-1 Variant with No Resistance Mutation and Wild-Type Proviral DNA in a Treated Patient. AIDS Res Hum Retroviruses 31:142. - PMC - PubMed
    1. White JA, Wu F, Yasin S, Moskovljevic M, Varriale J, Dragoni F, Camilo-Contreras A, Duan J, Zheng MY, Tadzong NF, Patel HB, Quiambao JMC, Rhodehouse K, Zhang H, Lai J, Beg SA, Delannoy M, Kilcrease C, Hoffmann CJ, Poulin S, Chano F, Tremblay C, Cherian J, Barditch-Crovo P, Chida N, Moore RD, Summers MF, Siliciano RF, Siliciano JD, Simonetti FR. 2023. Clonally expanded HIV-1 proviruses with 5′-leader defects can give rise to nonsuppressible residual viremia. J Clin Invest 133. - PMC - PubMed
    1. Halvas EK, Joseph KW, Brandt LD, Guo S, Sobolewski MD, Jacobs JL, Tumiotto C, Bui JK, Cyktor JC, Keele BF, Morse GD, Bale MJ, Shao W, Kearney MF, Coffin JM, Rausch JW, Wu X, Hughes SH, Mellors JW. 2020. HIV-1 viremia not suppressible by antiretroviral therapy can originate from large T cell clones producing infectious virus. J Clin Invest 130:5847–5857. - PMC - PubMed
    1. Tobin NH, Learn GH, Holte SE, Wang Y, Melvin AJ, McKernan JL, Pawluk DM, Mohan KM, Lewis PF, Mullins JI, Frenkel LM. 2005. Evidence that Low-Level Viremias during Effective Highly Active Antiretroviral Therapy Result from Two Processes: Expression of Archival Virus and Replication of Virus. J Virol 79:9625–9634. - PMC - PubMed

Publication types