[Preprint]. 2025 May 14:2025.05.13.651470.
doi: 10.1101/2025.05.13.651470.

Serine auxotrophy is a targetable vulnerability driven by PSAT1 suppression in AML

Affiliations

Serine auxotrophy is a targetable vulnerability driven by PSAT1 suppression in AML

Ilias Sinanidis et al. bioRxiv. .

Abstract

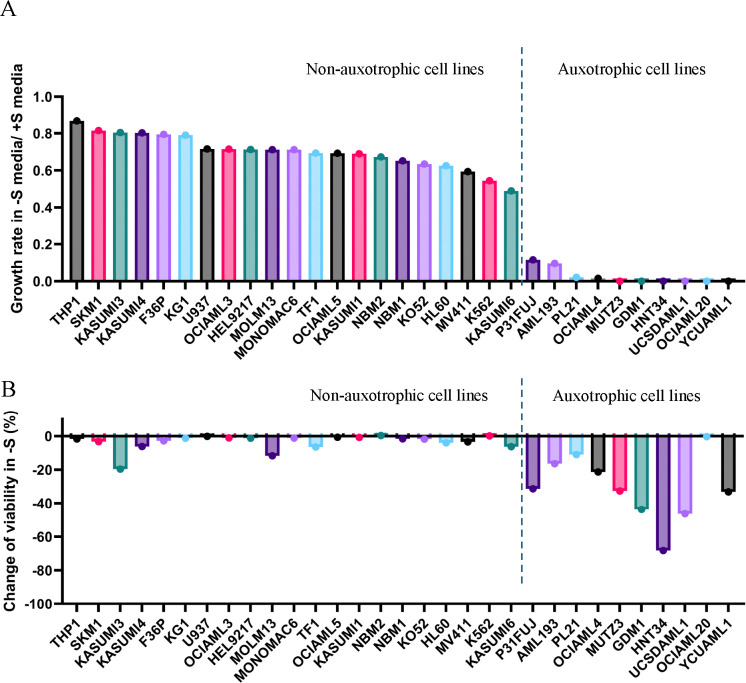
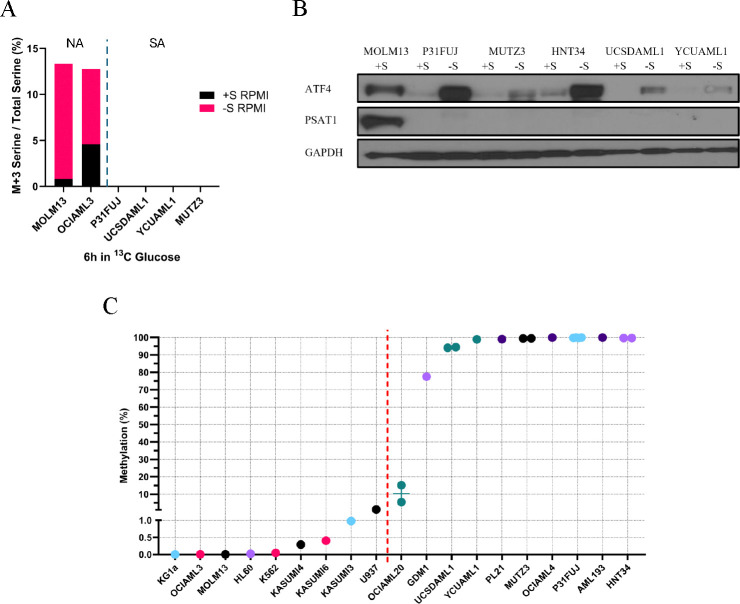
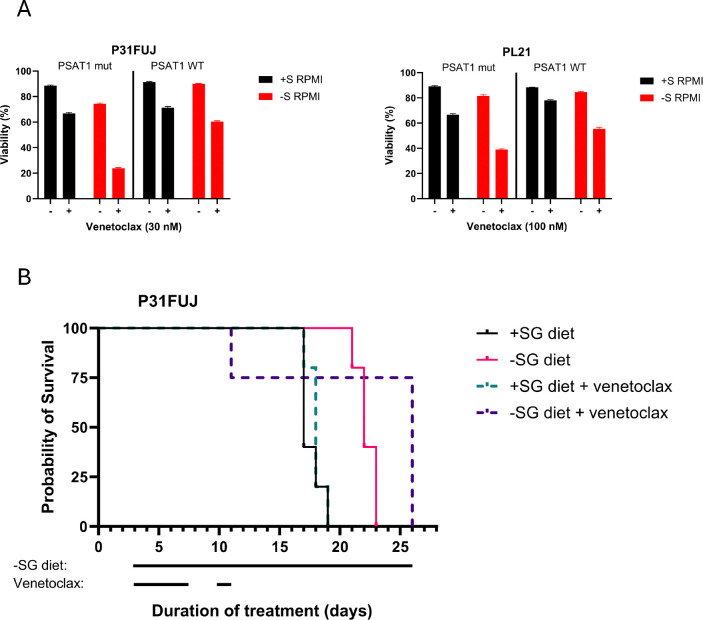
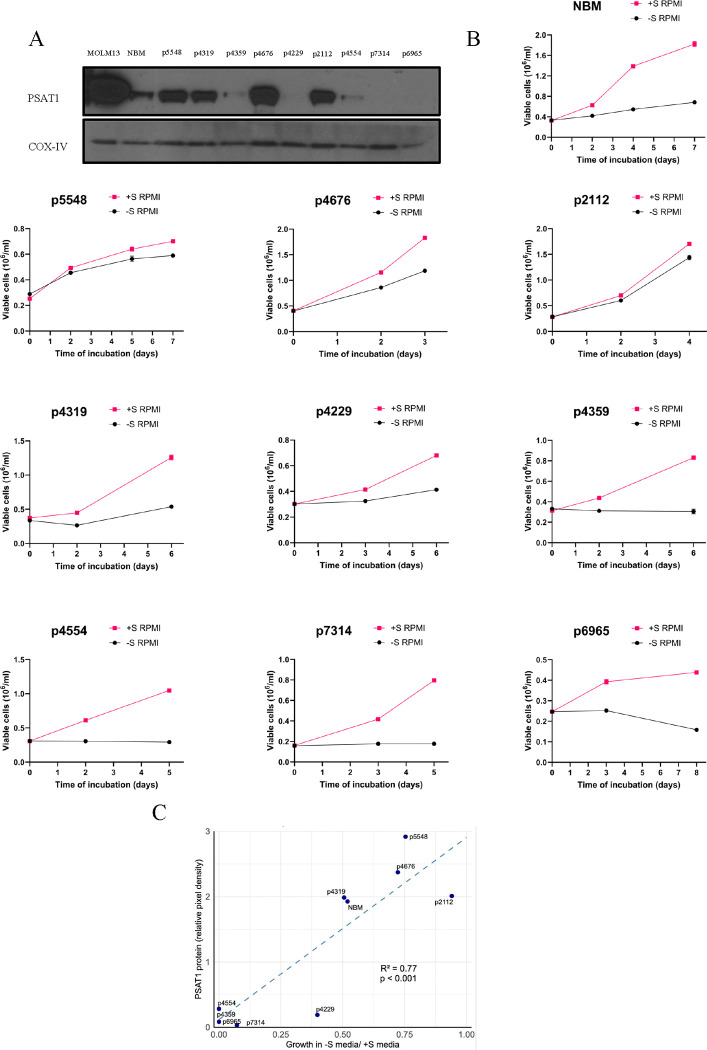
Serine metabolism is of growing biologic and therapeutic interest in cancer. Upregulation of the serine synthesis pathway (SSP) can fuel tumor growth, and cancers with this phenotype are often sensitive to SSP inhibitors. In parallel, dietary restriction of serine and glycine (SG) can suppress some cancers, but the determinants of sensitivity to this approach are poorly understood. This is especially true in acute myeloid leukemia (AML), where serine metabolism has been less explored. We report that a subset of human AML cell lines and primary samples are completely dependent on external serine, known as serine auxotrophy. These leukemias consistently suppressed the SSP enzyme PSAT1, failed to synthesize serine, responded to SG restriction in vivo, and were rescued by restoring PSAT1. We also found that AML with an SF3B1 K700E mutation showed additional dependence on the SSP enzyme PHGDH, that SG restriction synergized with venetoclax in serine auxotrophic AML, and that MECOM rearrangement was strongly associated with PSAT1 suppression and serine auxotrophy. These findings define a metabolically distinct AML subtype and nominate it for targeting by SG restriction.


Conflict of interest statement

Competing interests The authors declare no competing interests.

Figures

Figure 1.
Figure 1.. Landscape of dependence on external serine in AML cell lines.
(A) The ratio of growth rate in −S versus +S RPMI was determined by triplicate viable cell counts in 3 timepoints over at least 2 population doublings in +S media. (B) Percent change of viability (V) calculated using trypan blue exclusion. %Vchange = 100% × (V−S – V+S)/V+S, where V−S and V+S are the viability at the last timepoint of Figure 1A starvation curves in –S and +S RPMI, respectively.
Figure 2.
Figure 2.. PSAT1 is suppressed in serine auxotrophic AML cell lines.
(A) Gene expression profiles of functionally defined auxotrophic and non-auxotrophic AML cell lines, analyzed using RNA-seq data from the CCLE. (B) Schematic representation of the serine synthesis pathway (SSP) highlighted in green. The SSP connects glycolysis with one-carbon metabolism and glycine synthesis. (C) PSAT1 and PHGDH protein levels in AML cell lines. GAPDH serves as the loading control. MONOMAC6 expression was validated separately using COX-IV (Figure S2B).
Figure 3.
Figure 3.. Serine auxotrophic AML cell lines sense −S metabolic stress but do not synthesize serine.
(A) De novo M+3 serine synthesis using 13C labeling after a 6-hour incubation in 13C-glucose media. NA: non-auxotrophic cell lines. SA: auxotrophic cell lines. Values represent the mean of quadruplicates. (B) Western blot showing ATF4 and PSAT1 expression levels after 24 hours of incubation in −S or +S RPMI. GAPDH serves as the loading control and MOLM13 sample as a PSAT1 positive control. (C) Baseline methylation percentage (%) of AML cell lines, calculated based on Ct values of methylation -specific and unmethylation-specific qPCR amplification.; %meth = 100 / (1 + 2meth-unmeth). Each sample was analyzed in triplicate.
Figure 4.
Figure 4.. PSAT1 determines serine auxotrophy in AML cell lines.
Serine starvation curves of (A) MOLM13 PSAT1 knockouts, (B-C) UCSDAML1, P31FUJ, MUTZ3, and PL21 with PSAT1 overexpression in +S or −S HPLM media. Each sample was run in triplicate. (D) Serine starvation curves of HNT34 cell lines restoring the expression of PSAT1 and/or PHGDH in +S or -S HPLM. Each sample was assessed in quadruplicate. (E) De novo serine synthesis in HNT34 with overexpression of PSAT1 and/or PHGDH using 13C labeling after a 6-hour incubation in 13C-glucose media. Values represent the mean ± SEM of quadruplicates. (B-E) “Mut” refers to inactivation mutations of the PSAT1 or PHGDH protein. ***p<0.001, ****p<0.0001.
Figure 5.
Figure 5.. Serine and Glycine-restricted (−SG) diet extends survival and decreases leukemia burden in AML xenografts.
(A) Kaplan–Meier survival curves of AML xenografts inoculated with 107 cells per mouse (n = 3 per group). (B) Leukemia burden, assessed through spleen weight, peripheral blood human hCD45% levels, and bone marrow hCD45%, in P31FUJ xenografts. Mice were euthanized 14 days after cell inoculation. N = 5 per study group, n = 3 for leukemia free control group. Values represent means ± SEM. (C) Kaplan-Meier survival curves of xenografts bearing P31FUJ leukemia expressing WT or K200A (mut) PSAT1. 106 cells were inoculated per mouse (n = 4 per group). (D) Kaplan–Meier survival curves of MOLM13 xenografts inoculated with 106 cells per mouse (n = 3 per group). (A-D) Treatment with −SG or +SG diet was initiated on the day of inoculation and continued until mouse death or euthanasia. *p<0.05, **p<0.01
Figure 6.
Figure 6.. Combination treatment with −SG and venetoclax.
(A) P31FUJ and PL21 cell viability after 24h and 48h in −S RPMI and/or venetoclax, respectively. Values represent means ± SEM. (B) Kaplan–Meier survival curves of P31FUJ xenografts inoculated with 107 cells per mouse (n = 5 per group, n = 4 in combination therapy arm). The testing diet was initiated on day 3 and continued until mouse death or euthanasia. Venetoclax was administered on day 3 at a dose of 20 mg/kg, on day 4 at a dose of 50 mg/kg, and on Days 5, 6, 7, 10, and 11 at 100 mg/kg.
Figure 7.
Figure 7.. PSAT1 mRNA expression in AML patient cohorts.
(A) CEBPA-, (B) GATA2-, (C) WT1-, (D) MECOMr-, and (E) TP53- mutated AML samples from RNA-seq in Leucegene, BEAT-AML, and/or TCGA patient cohorts. Panels (A-E) show median values with interquartile ranges. *p<0.05, **p<0.01, ***p<0.001, ****p<0.0001
Figure 8.
Figure 8.. PSAT1 expression and dependence on external serine in primary AML samples.
(A) Western blot showing the PSAT1 protein expression in primary AML patient samples. COX-IV serves as the loading control, and MOLM13 as the positive PSAT1 control. (B) Serine starvation curves of primary AML patient samples in +S or −S RPMI. Media was enriched with TPO, GM-CSF, IL-3, IL-6, FLT3-L, SCF, UM729, and SR-1. Values represent the mean ± SEM of triplicates. (C) Correlation plot between PSAT1 protein levels (measured by western blot densitometry) and ratio of cell growth rate, −S/+S, calculated from starvation curves. The data points of p4554 and p4359 overlap in the graph.

References

    1. Lo Presti C, Fauvelle F, Jacob MC, Mondet J, Mossuz P. The metabolic reprogramming in acute myeloid leukemia patients depends on their genotype and is a prognostic marker. Blood Adv. 2021. Jan 12;5(1):156–66. - PMC - PubMed
    1. Choi BH, Rawat V, Högström J, Burns PA, Conger KO, Ozgurses ME, et al. Lineage-specific silencing of PSAT1 induces serine auxotrophy and sensitivity to dietary serine starvation in luminal breast tumors. Cell Rep. 2022. Jan 18;38(3):110278. - PMC - PubMed
    1. Jasani N, Xu X, Posorske B, Kim Y, Wang K, Vera O, et al. PHGDH Induction by MAPK Is Essential for Melanoma Formation and Creates an Actionable Metabolic Vulnerability. Cancer Res. 2025. Jan 15;85(2):314–28. - PMC - PubMed
    1. Ward PS, Patel J, Wise DR, Abdel-Wahab O, Bennett BD, Coller HA, et al. The common feature of leukemia-associated IDH1 and IDH2 mutations is a neomorphic enzyme activity converting alpha-ketoglutarate to 2-hydroxyglutarate. Cancer Cell. 2010. Mar 16;17(3):225–34. - PMC - PubMed
    1. Figueroa ME, Abdel-Wahab O, Lu C, Ward PS, Patel J, Shih A, et al. Leukemic IDH1 and IDH2 mutations result in a hypermethylation phenotype, disrupt TET2 function, and impair hematopoietic differentiation. Cancer Cell. 2010. Dec 14;18(6):553–67. - PMC - PubMed

Publication types