[Preprint]. 2025 May 15:2025.05.14.654090.
doi: 10.1101/2025.05.14.654090.

SARM1 is an essential component of neuronal Parthanatos

Affiliations

SARM1 is an essential component of neuronal Parthanatos

Tong Wu et al. bioRxiv. .

Abstract

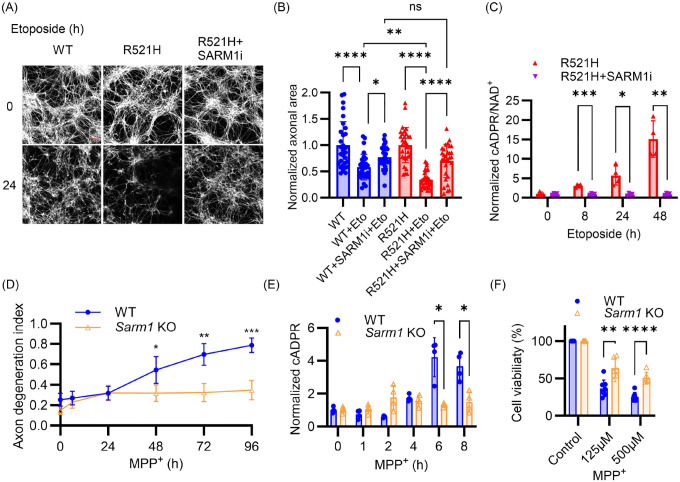
The NAD+ hydrolase SARM1 is the central executioner of pathological axon degeneration. SARM1 is allosterically activated by an increased NMN/NAD+ ratio resulting from depletion of NAD+ or accumulation of its precursor, NMN, typically due to loss of the labile NAD+ synthetase NMNAT2 following axon injury. Another NAD+ hydrolase, PARP1, is hyperactivated by DNA damage, triggering the Parthanatos cell death pathway. We demonstrate that multiple mechanistically-distinct DNA-damaging agents lead to SARM1 activation and axon degeneration following PARP1 activation. Remarkably, SARM1 is required for key steps downstream of PARP1 activation by DNA damage that are pathognomonic of Parthanatos, including mitochondrial depolarization, nuclear translocation of AIF (apoptosis-inducing factor), and cell death. Moreover, SARM1 mediates glutamate excitotoxicity, a clinically significant pathomechanism attributed to Parthanatos. The identification of SARM1 as an essential component of neuronal Parthanatos, a major contributor to cell death in neurodegenerative disease, greatly expands the potential clinical utility of SARM1 inhibitors.


Conflict of interest statement

Competing interests JM and AD are co-founders, scientific advisory board members, and shareholders of Disarm Therapeutics, a wholly owned subsidiary of Eli Lilly and scientific advisory board members of Asha Therapeutics. The authors have no other competing conflicts or financial interests.

Figures

Figure 1.
Figure 1.. DNA damage induces SARM1-dependent neuronal degeneration.
(A) WT and Sarm1 KO DRGs were treated at DIV7. Representative images of axons from cultured WT and Sarm1 KO DRG neurons 0 and 12 hr after treatment with 500 μM MNNG show axon degeneration. Scale bars, 25 μm. (B-C) Axon degeneration index after treatment with (B) 500 μM MNNG and (C) 300 μM etoposide. (D-E) cADPR quantified by LC-MS/MS after treatment with (D) 500 μM MNNG and (E) 300 μM etoposide. All error bars correspond to Mean±SD. Statistical significance was determined by multiple unpaired t-tests, comparing WT to Sarm1 KO at each time point. **p < 0.01; ***p < 0.001; ****p < 0.0001.
Figure 2.
Figure 2.. PARP1 activation is upstream of SARM1 activation.
(A) DRGs preincubated with PARP1 inhibitor (ABT-888 or EB-47) were treated with MNNG (500 μM) at DIV7 and the axon degeneration index was measured. (B) DIV7 DRGs preincubated with SARM1 inhibitor (NB-7) or PARP1 inhibitor (ABT-888) were treated with MNNG (500 μM) for 12 hr and mitochondrial membrane potential assessed using TMRM dye. Scale bars, 25 μm. (C) Quantification of TMRM signal from (B). (D-F) DRGs preincubated with PARP1 inhibitor (ABT-888) were treated with MNNG (500 μM) at DIV7. Neuronal soma was collected for metabolite measurement. (D) NAD+, (E) NMN/NAD+ and (F) cADPR were quantified by LC-MS/MS. Statistical significance was determined by multiple unpaired t tests. All error bars correspond to Mean±SD. *p < 0.05; **p < 0.01; ***p < 0.001; ****p < 0.0001.
Figure 3.
Figure 3.. SARM1 activation induces AIF translocation and cell death.
(A) WT DRG neurons, untreated or preincubated with PARP1 inhibitor (ABT-888), and Sarm1 KO DRG neurons, were treated with MNNG (500 μM) at DIV7. Representative images show neurons after 12 hr of treatment, stained with Propidium Iodide (PI) to indicate cell death. Scale bars, 100 μm. (B) Quantification of cell viability using PI staining. WT neurons, WT neurons preincubated with SARM1 inhibitor (NB-7) or with PARP1 inhibitor (EB-47 or ABT-888), and Sarm1 KO neurons were treated with MNNG (500 μM) at DIV7. Statistical significance was determined by one-way ANOVA, comparing all conditions to Control. (C) Representative images of immunofluorescent staining of DRG neurons with antibodies against AIF, and DAPI to label the nucleus. Neurons were preincubated with a SARM1 inhibitor or a PARP1 inhibitor, followed by treatment with 500 μM MNNG for 12 hr. AIF (red) and nuclear (blue) intensity distributions are shown for the representative magnified cell images. Scale bars, 25 μm. (D) Cumulative histogram showing the per-cell distribution of AIF intensity ratio on the x-axis, where high numbers represent more nuclear AIF compared with cytosolic. Where indicated, DRG neurons were treated with MNNG (500 μM) for 12 hr prior to quantification. (E) Quantification of percentage of cells (from D), with AIF nuclear-to-cytoplasmic intensity ratio greater than 1 (dashed line in D). Statistical significance was determined by one-way ANOVA, comparing all conditions to Control. (F) Western blot analysis shows translocation of AIF to the nucleus in WT vs. Sarm1 KO primary cortical neurons treated with MNNG (500 μM) for 45 min. (G) Quantification of AIF intensity normalized to Histone H3 from (F). Statistical significance was determined by unpaired t tests, comparing WT and Sarm1 KO. *p < 0.05; ****p < 0.0001.
Figure 4.
Figure 4.. SARM1 inhibition prevents neuronal pathology associated with FUS mutation and MPP+ toxicity.
(A) Representative images of axons from WT and FUSR521H iPSC-derived motor neurons treated with 10 μM etoposide, stained with Tubulin Tracker Deep Red at 0 and 24 hr. Scale bars: 50 μm. (B) Quantification of axonal area in FUSR521H and isogenic control (WT) iPSC-derived MNs 24 hr after treatment with 10 μM etoposide (Eto) and SARM1 inhibitor (NB-7). Statistical significance was determined by one-way ANOVA. (C) FUSR521H iPSC-derived motor neurons preincubated with SARM1 inhibitor (NB-7) were treated with etoposide (10 μM), and metabolites collected. cADPR/NAD+ was quantified by LC-MS/MS. Statistical significance was determined by multiple unpaired t tests comparing inhibitor-treated to untreated at each time point. (D) WT and Sarm1 KO DRG neurons were treated with 1 mM MPP+ at DIV7 and axon degeneration index measured at indicated times post-treatment. (E) WT and Sarm1 KO DRG neurons were treated with 100 μM MPP+ at DIV7 and cADPR quantified by LC-MS/MS at indicated times after treatment. (F) WT and Sarm1 KO DRG neurons were treated with indicated doses of MPP+ for 48 hr at DIV 7 and MTT assays were performed to quantify cell viability. Statistical significance in (D-F) was determined by multiple unpaired t tests, comparing Sarm1 KO to WT at each time point or each dose. All data and error bars correspond to Mean±SD. *p < 0.05; **p < 0.01; ***p < 0.001; ****p < 0.0001.
Figure 5.
Figure 5.. SARM1 inhibition protects neurons from excitotoxicity in vitro and in vivo.
(A) Quantification of cell viability by averaging NeuO intensity. Primary cortical neurons preincubated with DMSO, the SARM1 inhibitor NB-7 or the NMDAR antagonist MK801 were treated with NMDA (500 μM) at DIV14. Cell viability was quantified after 24 hours of NMDA stimulus. (B) Quantification of mitochondrial membrane potential by measuring average TMRM intensity in primary cortical neurons after 24 hours of NMDA stimulus. (C) Quantification of neurite area in primary cortical neurons after 24 hours of NMDA stimulus. Statistical significance in (A-C) was determined by one-way ANOVA, comparing NMDA control with SARM1 inhibitor or MK801 preincubation. (D-E) WT and Sarm1 KO Mice were injected intrastriatally with NMDA and tissues collected after 48 hr. (D) and (E) show representative images of coronal brain sections from WT (D) and Sarm1 KO (E) mice immunostained for NeuN (neurons), GFAP (astrocytes), and IBA1 (microglia). Scale bars, 1.5 mm. (F) Quantification of lesion area in the striatum, calculated as the percentage of NeuN-depleted area relative to the total striatal area per hemisphere. Lesion and total areas were determined using a threshold-based grid quantification of NeuN intensity. (G-H) Fold increase of (G) GFAP and (H) IBA1 intensity between the ipsilateral and contralateral striatum for each mouse. Statistical significance in (F-H) was determined by multiple unpaired t tests. *p < 0.05; **p < 0.01; ***p < 0.001; ****p < 0.0001.

Similar articles

References

    1. Figley M.D., and DiAntonio A. (2020). The SARM1 axon degeneration pathway: control of the NAD+ metabolome regulates axon survival in health and disease. Curr Opin Neurobiol 63, 59–66. 10.1016/j.conb.2020.02.012. - DOI - PMC - PubMed
    1. Gilley J., and Coleman M.P. (2010). Endogenous Nmnat2 Is an Essential Survival Factor for Maintenance of Healthy Axons. PLoS Biol 8, e1000300. 10.1371/journal.pbio.1000300. - DOI - PMC - PubMed
    1. Di Stefano M., Nascimento-Ferreira I., Orsomando G., Mori V., Gilley J., Brown R., Janeckova L., Vargas M.E., Worrell L.A., Loreto A., et al. (2015). A rise in NAD precursor nicotinamide mononucleotide (NMN) after injury promotes axon degeneration. Cell Death Differ 22, 731–742. 10.1038/cdd.2014.164. - DOI - PMC - PubMed
    1. Essuman K., Summers D.W., Sasaki Y., Mao X., DiAntonio A., and Milbrandt J. (2017). The SARM1 Toll/Interleukin-1 Receptor Domain Possesses Intrinsic NAD+ Cleavage Activity that Promotes Pathological Axonal Degeneration. Neuron 93, 1334–1343.e5. 10.1016/j.neuron.2017.02.022. - DOI - PMC - PubMed
    1. Figley M.D., Gu W., Nanson J.D., Shi Y., Sasaki Y., Cunnea K., Malde A.K., Jia X., Luo Z., Saikot F.K., et al. (2021). SARM1 is a metabolic sensor activated by an increased NMN/NAD+ ratio to trigger axon degeneration. Neuron 109, 1118–1136.e11. 10.1016/j.neuron.2021.02.009. - DOI - PMC - PubMed

Publication types

LinkOut - more resources