[Preprint]. 2025 May 12:2025.04.28.651095.
doi: 10.1101/2025.04.28.651095.

A functionally validated TCR-pMHC database for TCR specificity model development

Affiliations

A functionally validated TCR-pMHC database for TCR specificity model development

Marius Messemaker et al. bioRxiv. .

Abstract

Accurate prediction of TCR specificity forms a holy grail in immunology and large language models and computational structure predictions provide a path to achieve this. Importantly, current TCR-pMHC prediction models have been trained and evaluated using historical data of unknown quality. Here, we develop and utilize a high-throughput synthetic platform for TCR assembly and evaluation to assess a large fraction of VDJdb-deposited TCR-pMHC entries using a standardized readout of TCR function. Strikingly, this analysis demonstrates that claimed TCR reactivity is only confirmed for 50% of evaluated entries. Intriguingly, the use of TCRbridge to analyze AlphaFold3 confidence metrics reveals a substantial performance in distinguishing functionally validating and non-validating TCRs even though AlphaFold3 was not trained on this task, demonstrating the utility of the validated VDJdb (TCRvdb) database that we generated. We provide TCRvdb as a resource to the community to support training and evaluation of improved predictive TCR specificity models.

Keywords: T cell receptor; functional genetic screening; major histocompatibility antigen; peptide; predictive models.


Figures

Figure 1
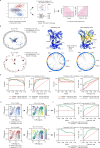
Figure 1. Exploration of data quality in VDJdb
(A) Assay setup and representative flow cytometry data depicting CD69 expression on TCR-transduced CD8αβ+ TCR-null Jurkat cells following coculture with either YLQ- or GLC-expressing HLA-A*02:01+ B cells. (B) Scatterplot depicting CD69 expression on TCR-transduced CD8+ TCR-null Jurkat cells upon exposure to either YLQ- or GLC-expressing HLA-A*02:01+ B cells. Dots represent individual TCRs. Dots with darker shading indicate TCRs that were also evaluated in primary CD8+ T cells, as shown in (C and D). (C). Assay setup and representative flow cytometry data depicting CD137 expression on TCR-transduced primary CD8+ T cells following coculture with either YLQ- or GLC-expressing HLA-A*02:01+ B cells. (D). Scatterplot comparing CD69 expression on TCR-transduced CD8+ TCR-null Jurkat cells and CD137 expression on TCR-transduced primary CD8+ T cells, following coculture with HLA-A*02:01+ B cells expressing the indicated epitopes. Dots represent individual TCRs. Background CD69/CD137 signal observed upon co-culture with HLA-A*02:01+ B cells expressing irrelevant epitopes was subtracted. (E) tcrdist3 distance-based network formed by YLQ- and GLC-annotated TCRs evaluated in (A-D). Grey nodes represent non-validating TCRs, colored nodes represent validating TCRs in (A,B). Nodes are connected by edges when TCRs represented by those nodes have a tcrdist3 distance below 120.
Figure 2
Figure 2. Scalable synthetic TCR library assembly and characterization
(A) Schematic overview of synthetic TCR library assembly platform (see Figure S1A for details). (B) Percentage of full-length sequence-perfect (i.e., exact matching sequences) synthetic TCRs, as evaluated using Sanger-sequencing of bulk TCR assembly products. Indicated numbers of assembly products of the VDJdb-10 (3,693 TCRs), TCR-s1 (3,510 TCRs), TCR-s2 (983 TCRs), TCR-s3 (1,000 TCRs), and TCR-s4 (2,892 TCRs) libraries were evaluated. (C) Sequence identity between each TCR in the VDJdb-10 library and its closest match, based on pairwise comparisons. Identities were calculated by self-aligning all TCRs using minimap2, defined as BLAST identity: exact nucleotide matches at the same position, counting each consecutive gap separately. The orange arrow marks the average raw base-calling accuracy of Oxford Nanopore Technologies (ONT), while the red arrow indicates the minimum sequence accuracy threshold above which all TCRs in the VDJdb-10 library are distinguishable. (D) Schematic of ONT sequence unique molecular identifier (UMI)-based error correction method to sequence unique full-length TCR molecules at the accuracy required to distinguish all TCRs. (see Figure S2A–B for details of ONT-sequencing DNA library preparation and error correction bioinformatics). Unique synthetic TCR molecules are tagged with UMIs at both ends. ONT sequencing-reads originating from the same unique TCR molecule are identified by UMI binning and used to create an accurate consensus sequence by medaka polishing. Resulting consensus sequences are aligned to the reference sequence list to allow counting of unique full-length TCR molecules. (E) Histogram of TCR UMI counts of the VDJdb-10 library and corresponding count QC summary statistics.
Figure 3
Figure 3. Pooled functional genetic screening of the VDJdb-10 TCR library
(A) Schematic overview of pooled functional genetic screening approach. The VDJdb-10 TCR library was introduced into CD8αβ+ TCR-null Jurkat cells. VDJdb-10-expressing Jurkat cells were exposed to HLA-A*02:01+ B cells expressing either the YLQ or GLC epitope and reactive T cells were isolated using CD69+ cell sorting. Abundance of individual VDJdb-10 TCRs in the CD69+ cell fractions was determined by full-length TCR UMI ONT-sequencing. Reactive TCRs were then identified by their relative abundance in the different CD69+ cell fractions. (B) Histogram of TCR UMI counts of the VDJdb-10 library in Jurkat T cells and corresponding count QC summary statistics. (C) MA plot of fold changes, representing the relative abundance of TCR UMI counts in the YLQ epitope exposed and GLC epitope-exposed CD69+ cell fractions over the mean normalized TCR UMI count across CD69+ cell fractions. Dots represent individual TCRs. Left MA plot: dots are colored by VDJdb annotation for reactivity against GLC (red) or YLQ (blue). Right MA plot: significantly enriched (P value < 1e-5) dots are colored. P values were calculated using the DESeq2, Wald test and adjusted for multiple comparisons. (D) Scatterplot depicting the percentage of validating YLQ-reactive TCRs in individual studies as a function of the percentage of samples from acutely infected, convalescent, or SARS-CoV-2 seropositive donors. In all studies, TCRs were identified based on pMHC multimer binding. In those cases where clonotype-level donor information was available (the majority of studies) the fraction of TCR clonotypes originating from acutely infected, convalescent, and seropositive donors was determined. Dot size indicates the number of TCRs contributed by each study (range 1–191 TCRs). (E) Plot depicting the percentage of validating YLQ- and GLC-annotated TCRs (i.e., precision) at the indicated VDJdb confidence scores. Dot size indicates the total number of annotated TCRs at each confidence score threshold (range 4–512 TCRs). (F) Barplot depicting the percentage of all validating YLQ- and GLC-annotated TCRs that is retained (i.e., sensitivity) when using the indicated thresholds of VDJdb confidence scores as a minimum quality threshold.
Figure 4
Figure 4. TCRvdb improves TCR-pMHC reactivity model evaluation
(A) Schematic overview of prediction model evaluation pipeline using validated VDJdb (TCRvdb). Validating and non-validating TCRs are identified using the functional genetic screening results as depicted in Figure 3C. tcrdist3, STAPLER, and TCRbridge are then evaluated on their ability to distinguish identified validating and non-validating TCRs. (B) tcrdist3 distance-based network formed by YLQ- and GLC-annotated TCRs. Grey nodes represent non-validating TCRs, colored nodes represent validating TCRs. Nodes are connected by edges when TCRs represented by those nodes have a tcrdist3 distance below 120. (C) AlphaFold3 (AF3) predicted TCR-pMHC structure complexes of a validating (top-left) and non-validating (top-right) YLQ-annotated TCR. Structures are colored by AF3’s confidence in the placement of each atom within its local environment (pLDDT; predicted Local Distance Difference Test). The corresponding AlphaBridge circos plots of the validating (bottom-left) and non-validating (bottom-right) predicted structure complexes show pLDDT for TCRα, TCRβ, peptide, MHC, and B2M (outer ring), along with confident interfaces identified by AlphaBridge (inner ring and ribbons). Ribbons representing confident interfaces between TCRα and peptide are colored green, between TCRβ and peptide are colored purple, and all other interfaces are shown in grey. Note the presence of confident interactions between TCR and peptide and TCR and MHC in the left model but not the right model. (D) Comparison of tcrdist3 (orange), STAPLER (purple), and TCRbridge (green) performance in predicting whether YLQ-annotated (left) and GLC-annotated (right) TCRs do or do not validate in functional genetic screening. Note that the labels identified in Fig. 3 were not included in the development of either model. Left: Precision-Recall curve showing the fraction of validating pairs of all pairs (i.e. precision) at the indicated recall (sensitivity) levels. Right: Receiver Operating Characteristic (ROC) curve showing ability of the indicated models to rank validating pairs above non-validating pairs, as measured as the true positive rate (sensitivity) versus the false positive rate (1 − specificity) across prediction thresholds. Average Precision (AP; area under the Precision-Recall curve) summarizes overall model performance on the Precision-Recall curve, with values closer to 1.0 indicating better precision. Area under the ROC curve (AUC) summarizes overall model performance in ranking validating pairs relative to non-validating pairs across prediction thresholds, with values closer to 1.0 indicating a higher ability to distinguish validating from non-validating pairs. Dashed red lines show random performance. (E) Left: Scatterplots comparing TCRbridge-predicted confidence scores of validating YLQ and GLC TCRs for structure predictions in combination with either their cognate or non-cognate epitopes. Top-left plot depicts scores for YLQ TCRs in blue. Bottom-left plot depicts scores for GLC TCRs in red. Top-right and bottom-right plots depict data for the same TCRs but colored by relative confidence score for both predictions. Top-right: higher scores indicate preference for YLQ over GLC. Bottom-right higher scores indicate preference for GLC over YLQ. Relative scores were computed by calculating the scalar projections of each TCR prediction onto a vector contrasting the two epitopes (either (1, –1) for YLQ or (–1, 1) for GLC), followed by min-max normalization to scale values from 0 (favoring the non-target epitope) to 1 (perfectly aligned with the target epitope). (F) Performance of TCRbridge in distinguishing cognate (positive) from swapped (negative) validating TCR-epitope pairs using the predicted relative score from (E). Precision-recall and ROC curves show model performance for validating YLQ (top) and GLC (bottom) TCRs. Precisionrecall curves show the fraction of cognate epitope pairs of total pairs (precision) at the indicated levels of recall (sensitivity). ROC curves reflect the model’s ability to rank cognate epitope pairs relative to swapped pairs. As explained in (D), AP and AUC summarize overall model performance. Dashed red lines represent random performance.

References

    1. Mora T. & Walczak A. M. How many different clonotypes do immune repertoires contain? Curr. Opin. Syst. Biol. 18, 104–110 (2019).
    1. Schumacher T. N., Scheper W. & Kvistborg P. Cancer Neoantigens. Annu. Rev. Immunol. 37, 173–200 (2019). - PubMed
    1. Zinkernagel R. M. & Doherty P. C. Immunological surveillance against altered self components by sensitised T lymphocytes in lymphocytes choriomeningitis. Nature 251, 547–548 (1974). - PubMed
    1. Hedrick S. M., Cohen D. I., Nielsen E. A. & Davis M. M. Isolation of cDNA clones encoding T cell-specific membrane-associated proteins. Nature 308, 149–153 (1984). - PubMed
    1. Yanagi Y. et al. A human T cell-specific cDNA clone encodes a protein having extensive homology to immunoglobulin chains. Nature 308, 145–149 (1984). - PubMed

Publication types

LinkOut - more resources