[Preprint]. 2025 May 15:2025.05.10.653233.
doi: 10.1101/2025.05.10.653233.

A complete map of human cytosolic degrons and their relevance for disease

Affiliations

A complete map of human cytosolic degrons and their relevance for disease

Vasileios Voutsinos et al. bioRxiv. .

Abstract

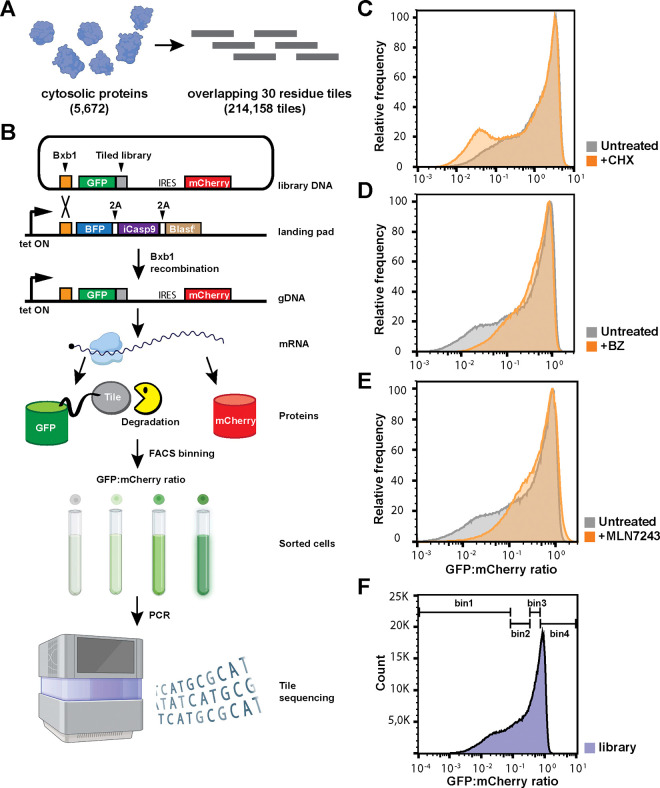
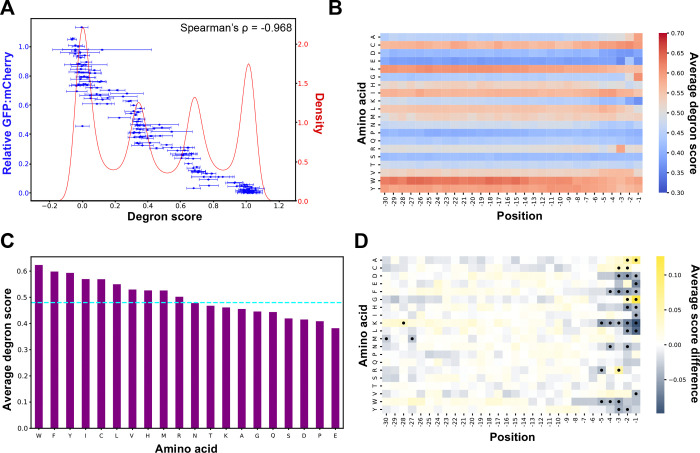
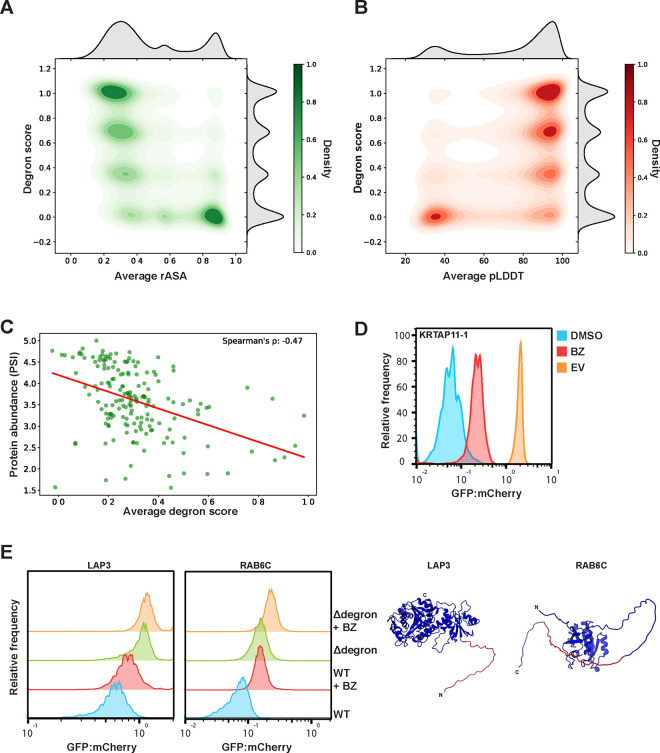
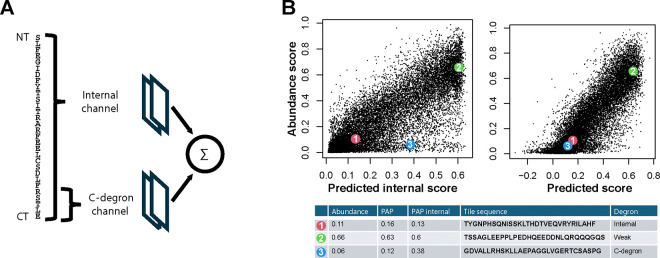
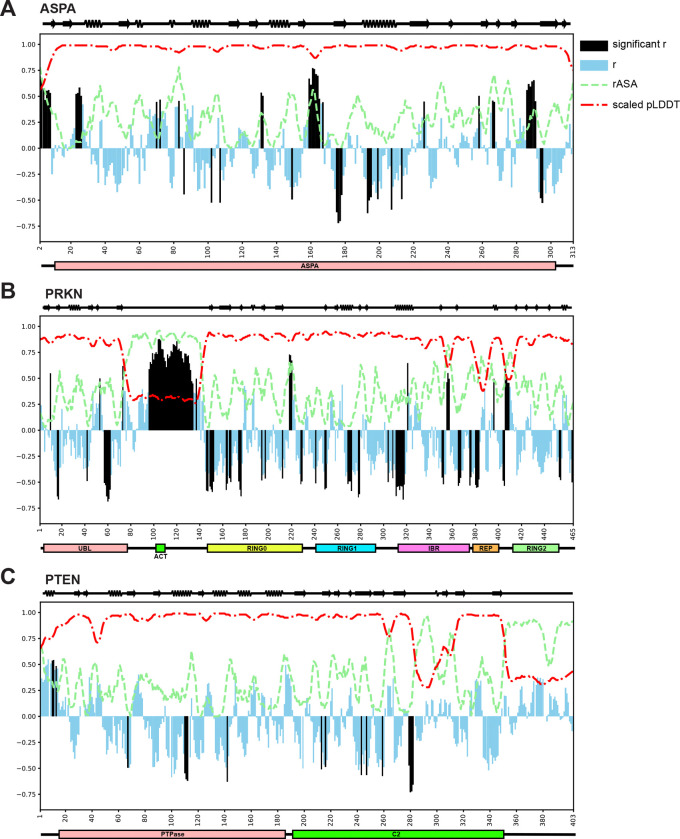
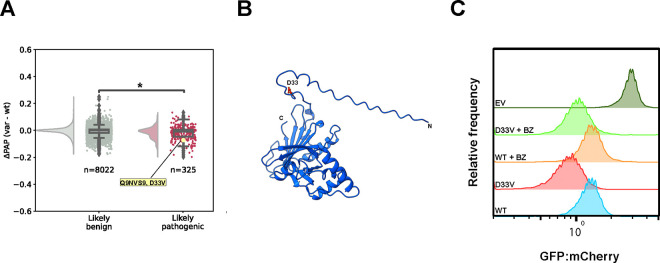
Degrons are short protein segments that target proteins for degradation via the ubiquitin-proteasome system and thus ensure timely removal of signaling proteins and clearance of misfolded proteins from the intracellular space. Here, we describe a systematic screen for degrons in the human cytosol. We determine degron potency of >200,000 different 30-residue tiles from more than 5,000 cytosolic human proteins with 99.7% coverage. In total, 19.1% of the tiles function as strong degrons, 30.4% as intermediate degrons, while 50.5% did not display degron properties. The vast majority of the degrons are dependent on the E1 ubiquitin-activating enzyme and the proteasome but independent of autophagy. The results reveal both known and novel degron motifs, both internal as well as at the C-terminus. Mapping the degrons onto protein structures, predicted by AlphaFold2, revealed that most of the degrons are located in buried regions, indicating that they only become active upon unfolding or misfolding. Training of a machine learning model allowed us to probe the degron properties further and predict the cellular abundance of missense variants that operate by forming degrons in exposed and disordered protein regions, thus providing a mechanism of pathogenicity for germline coding variants at such positions.

Keywords: DMS; E3; chaperone; deep mutational scanning; gene variants; proteasome; protein degradation; protein folding; protein quality control; protein stability; ubiquitin.


Conflict of interest statement

Competing interests K.L-L. holds stock options in and is a consultant for Peptone Ltd. All other authors declare no competing interests.

Figures

Fig. 1 –
Fig. 1 –. Cytosolic peptide library and degron screening.
(A) The peptide library consists of 214,158 different 30-residue partially overlapping fragments covering 5,672 cytosolic human proteins. (B) Schematic illustration of the expression and screening system. The plasmid containing the GFP-fused peptide library also includes an internal ribosomal entry site (IRES), mCherry and a site for Bxb1 recombination into a landing pad in HEK293T cells. Expression from the landing pad is regulated by the Tet-on promoter (bent arrow), that in non-recombined cells drives the expression of BFP, inducible Caspase 9 (iCasp9) and a blasticidin resistance gene (BlastR) separated with a parechovirus 2A-like translational stop-start sequence (2A). Upon correct integration, the GFP-fragments and mCherry are expressed from the same mRNA. Using fluorescence-activated cell sorting (FACS) cells are sorted into four equally populated bins and the fragments in each bin can be identified by sequencing. The figure was created with BioRender.com and adapted from (17, 43, 47). Representative distributions of GFP:mCherry ratios in cells expressing the library and either untreated (control) or (C) treated for 8 hours with 10 μg/ml cycloheximide (CHX) (n = 987,000, untreated: n = 932,000), (D) for 16 hours with 15 μM bortezomib (BZ) (n = 887,00, untreated: n = 721,000) (BZ), or (E) 16 hours with 1 μM of MLN7243 (n = 347077, untreated: n = 760,000). (F) A representative flow cytometry profile for cells expressing the library (n=495,000). Bin thresholds used to sort the library into four (–4) equally populated bins (25% in each bin) are shown as black horizontal bars.
Fig. 2 –
Fig. 2 –. Effects of amino acid residues and position on degron potency.
(A) Overlayed degron score distribution (red) with correlation scatter plot comparing the degron scores of 164 random tiles (blue) with their relative GFP:mCherry ratio as measured by flow cytometry and normalized by the GFP:mCherry ratio of the stable tile ENSG00000118898_tile072. Degron score error bars indicate standard deviation and GFP:mCherry error bars indicate standard error. (B) Heatmap showing the averaged degron score of tiles with each amino acid at each position. Red indicates a high degron potency and blue a low degron potency. (C) Bar plot showing the average score of all tiles with each of the amino acids in any of the 25 first positions. The cyan line indicates the total average score of all tiles, which is 0.48. (D) Heatmap showing the difference of the average degron score of exactly one of each amino acid at each position from the average score of exactly one of each amino acid at any other position. Yellow indicates an increase in degron potency at that particular position and blue indicates a decrease. Black dots indicate statistical significance after Bonferroni correction based on Mann-Whitney U Test (p < 0.05/600).
Fig. 3 –
Fig. 3 –. Importance of structural context and exposure of degrons.
(A) Kernel density estimate (KDE)plot correlating the average rASA of each tile with its degron score. Dark green indicates high density. (B) KDE plot of the average pLDDT of each tile with its degron score. Dark red indicates high density. KDE was computed with bandwidth = 0.1316. (C) Correlation of average degron score of all tiles of a protein with its protein stability index (PSI) as determined in (11). The correlation is shown only for 173 proteins with the highest average exposure (rASA > 0.7) (D) Representative flow cytometry profile of full-length KRTAP11–1 containing several exposed degrons with BZ (15 μM for 16 h) or without (DMSO) treatment. (KRTAP11–1: n = 1,887, KRTAP11–1 + BZ: n = 1,234). The GFP:mCherry profile of the empty vector (EV) control is shown for comparison (n = 1,730). (E) Representative flow cytometry profiles of LAP3 and RAB6C with BZ (15 μM for 16 h) or without (DMSO) treatment and with degron deleted (Δdegron) or wild type (WT). (LAP3 WT: n = 10,087, LAP3 WT + BZ: n = 7,122, LAP3 DD: n = 7,177, LAP3 DD + BZ: n = 6,548, RAB6C WT: n = 7,499, RAB6C WT + BZ: n = 5,942, RAB6C DD: n = 7,700, RAB6C DD + BZ: n = 5,955). The AlphaFold predicted structures of LAP3 (AF-P28838-F1) and RAB6C (AF-Q9H0N0-F1) are shown on the right with the deleted degrons marked in red. The degron scores of the deleted degrons (shown in red) were as follows: LAP3 tile 1: degron score = 1, average tile rASA = 0.93. RAB6C tile 15: degron score = 0.7, average tile rASA = 0.86. All flow cytometry experiments were performed in duplicate.
Fig. 4 –
Fig. 4 –. Peptide abundance predictor
(A) Architecture of the two-way convolutional neural network. The internal channel is composed by a convolutional filter followed by global pooling and a few dense layers. The C-degron channel uses a one-hot encoding of the last C-terminal positions also followed by a few dense layers. (B) Predicted scores of the internal channel only (left) and the full model (internal plus C-degron; right) versus the measured abundance scores of the holdout test tiles (Pearson 0.82 and 0.87 respectively). Three tiles are highlighted as examples of a composition driven degron (1), a high abundance tile (2) and a tile with a C-degron (3). The sequence and scores of the highlighted tiles are shown in the table.
Fig. 5 –
Fig. 5 –. ΔPAP can predict the abundance of missense protein variants.
Correlation map ΔPAP against abundance score of single amino acid substitution variants of (A) ASPA, (B) PRKN (Parkin) and (C) PTEN. Bars show the Pearson correlation coefficient of all the scored variants against their predicted ΔPAP for a sliding window of five residues, with the coefficient value assigned to the central residue of the five. The significance of the correlation for every five-residue window was assessed by calculating a p-value. Black bars indicate statistically significant Pearson correlation coefficients with p < 0.05/m, where m is the number of tests conducted for each protein. The average rASA (green line) and pLDDT (red line) of each residue window are also shown. The x axes indicate the amino acid position in each protein. The secondary structure and domain composition of each protein are shown above and below each plot, respectively.
Fig. 6 –
Fig. 6 –. PAP can detect potential pathogenic de novo degron creation from missense mutations.
(A) ΔPAP of all missense variants within exposed regions (average rASA ≥ 0.7, window size = 5). The central line is at the median of the two populations and the boxes indicate the interquartile range (IQR). The whiskers show the data range within 1.5x the IQR, diamond shaped data point are outliers. The number of data points (n) is shown in the plot. The asterisk indicates statistical significance in a Kruskal-Wallis test (p = 5.4 × 10⁻⁶) (B) PNPO AlphaFold predicted structure (AF-Q9NVS9-F1). The D33 is shown in red and the N- and C-terminus of the protein are annotated. (C) Representative FACS profiles of PNPO WT and D33V with BZ and without (DMSO) treatment (15 μM for 16 h) (WT: n = 9,933, D33V: n = 10,096, WT + BZ: n = 7,588, D33V + BZ: n = 7,619, EV). An empty vector (EV) control was included for comparisons.

Similar articles

References

    1. Hershko A, Ciechanover A. The ubiquitin system. Annu Rev Biochem. 1998;67:425–79. - PubMed
    1. Bard JAM, Goodall EA, Greene ER, Jonsson E, Dong KC, Martin A. Structure and Function of the 26S Proteasome. Annu Rev Biochem. 2018;87:697–724. - PMC - PubMed
    1. Schimke RT, Doyle D. Control of enzyme levels in animal tissues. Annu Rev Biochem. 1970;39:929–76. - PubMed
    1. Mathieson T, Franken H, Kosinski J, Kurzawa N, Zinn N, Sweetman G, et al. Systematic analysis of protein turnover in primary cells. Nat Commun. 2018;9(1):689. - PMC - PubMed
    1. Eden E, Geva-Zatorsky N, Issaeva I, Cohen A, Dekel E, Danon T, et al. Proteome half-life dynamics in living human cells. Science. 2011;331(6018):764–8. - PubMed

Publication types

LinkOut - more resources