[Preprint]. 2025 May 14:2025.05.10.653271.
doi: 10.1101/2025.05.10.653271.

Regulation of the Yolk Microtubule and Actin Cytoskeleton by Dachsous Cadherins during Zebrafish Epiboly

Affiliations

Regulation of the Yolk Microtubule and Actin Cytoskeleton by Dachsous Cadherins during Zebrafish Epiboly

Gina Castelvecchi et al. bioRxiv. .

Abstract

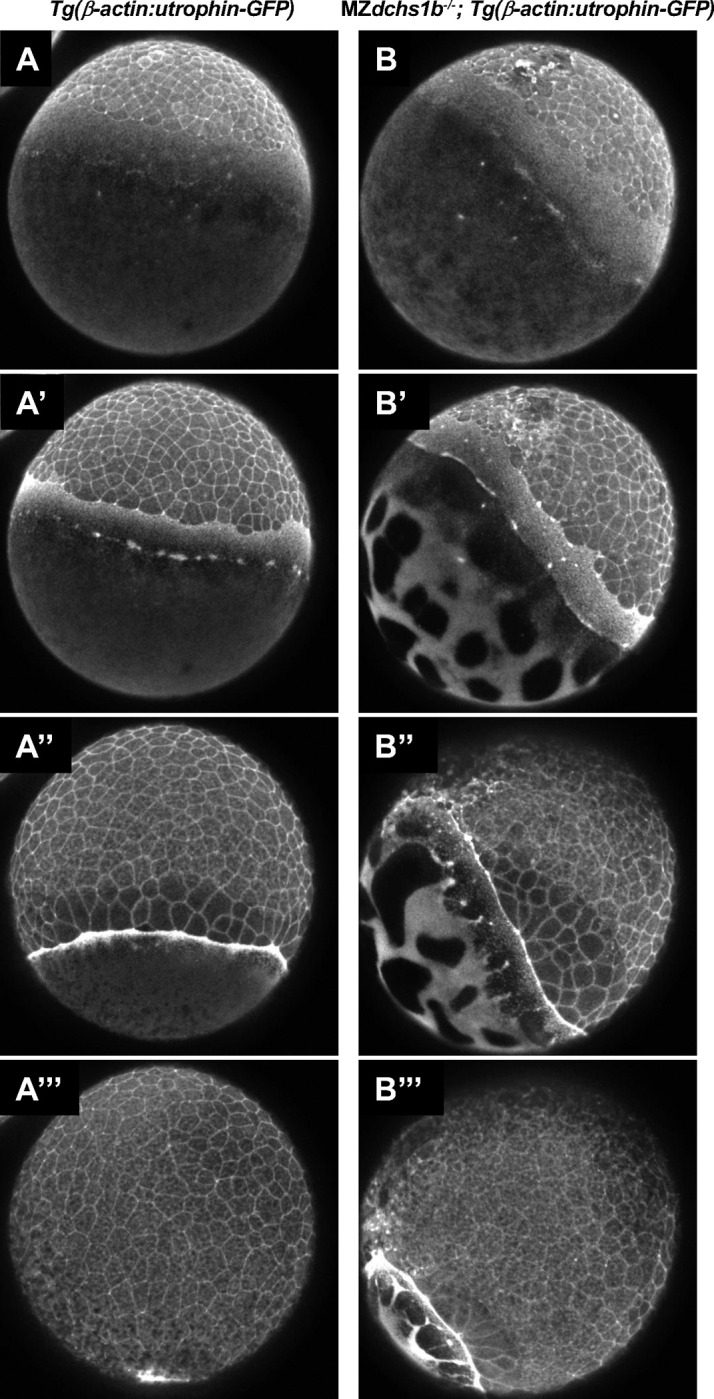
Epiboly is a crucial morphogenetic process during early animal embryogenesis that expands surface area of embryonic tissues while thinning them. During zebrafish development, epiboly spreads the superficial enveloping layer (EVL), germ layers, and yolk syncytial layer to cover the yolk cell. Here we investigated functions of the three zebrafish dchs genes, dchs1a, dchs1b and dchs2 that encode large atypical cadherins and report that they have partially overlapping functions in epiboly progression. We have inserted GFP at the C-terminal Dchs1b intracellular domain of the endogenous dchs1b locus using homologous recombination. We observed the resulting Dchs1b-GFP fusion protein localized in both the cell membrane and the cytoplasm of EVL and embryonic cells during gastrulation. The dynamic microtubule and actin cytoskeleton of the yolk cell are essential for epiboly. Our studies of the yolk microtubule network demonstrate that these microtubules are more bundled and show faster polymerization during epiboly in dchs triple loss-of-function mutant embryos than in wild-type embryos, indicating that dchs genes are required for limiting microtubule polymerization and promoting dynamics during epiboly. The epiboly progression defects of dchs1b deficient mutants were suppressed by mutations in the tetratricopeptide repeat protein 28 (ttc28) gene encoding a cytoplasmic protein previously shown to bind to Dchs1b intracellular domain and alter microtubule dynamics during early cleavages. We further demonstrate that MZdchs1b mutants exhibit abnormal organization and dynamics of yolk cell actin cytoskeleton during epiboly. Together, these lines of evidence as well as our transcriptomic analyses support the notion that like during early embryonic cleavages, Dchs1b plays a major role, while Dchs1a and Dchs2 proteins have supporting roles in regulating microtubule dynamics and organization of both microtubule and actin cytoskeleton to ensure normal epiboly.


Conflict of interest statement

Declaration of interest The authors have no financial and personal relationships with other people or organizations that could inappropriately influence their work.

Figures

Figure 1.
Figure 1.
Epiboly progression and EVL-DEL separation defects in Zdchs1b and dchs triple mutants. A. Representative confocal images of WT, Zdchs1b−/−, MZdchs1a−/−; Zdchs1b+/−; MZdchs2−/−, and MZdchs1a−/−; Zdchs1b−/−; MZdchs2−/−, with nuclei labeled with H2B-RFP and membranes labeled with mCherry-CAAX beginning at the oblong stage, then 3.5, 6.8, and 10-hours post-oblong. B. Diagram of a mid-epiboly stage embryo with the deep cell layer (DEL, blue), enveloping layer (EVL, dark gray), and yolk (yellow) labeled. Blue area corresponds to data presented in C, and the dark gray area corresponds to data presented in D. C. Quantification of DEL progression towards the vegetal pole during epiboly. Error bars indicate SEM. WT N=7 embryos. Zdchs1b−/− N=6 embryos. MZdchs1a−/−; Zdchs1b+/−; MZdchs2−/− N=6 embryos. MZdchs1a−/−; Zdchs1b−/−; MZdchs2−/− N=6 embryos. Statistical significance calculated with one-way ANOVA Friedman test corrected for multiple comparisons. WT vs. Zdchs1b−/−, p<0.01; WT vs. MZdchs1a−/−; Zdchs1b+/−; MZdchs2−/−, ns; WT vs. MZdchs1a−/−; Zdchs1b−/−; MZdchs2−/−, p<0.0001; Zdchs1b−/− vs. MZdchs1a; Zdchs1b+/−; MZdchs2−/−, p<0.0001; Zdchs1b−/− vs. MZdchs1a−/−; Zdchs1b−/−; MZdchs2−/−, p<0.0001; MZdchs1a; Zdchs1b+/−; MZdchs2−/− vs. MZdchs1a−/−; Zdchs1b−/−; MZdchs2−/−, p<0.0001. D. Quantification of the separation between the EVL and DEL during epiboly. Error bars indicate SEM. WT N=7 embryos. Zdchs1b−/− N=6 embryos. MZdchs1a−/−; Zdchs1b+/−; MZdchs2−/− N=6 embryos. MZdchs1a−/−; Zdchs1b−/−; MZdchs2−/− N=6 embryos. Statistical significance calculated with one-way ANOVA Friedman test corrected for multiple comparisons. WT vs. Zdchs1b−/−, p<0.001; WT vs. MZdchs1a−/−; Zdchs1b+/−; MZdchs2−/−, p<0.0001; WT vs. MZdchs1a−/−; Zdchs1b−/−; MZdchs2−/−, p<0.0001; Zdchs1b−/− vs. MZdchs1a; Zdchs1b+/−; MZdchs2−/−, ns; Zdchs1b−/− vs. MZdchs1a−/−; Zdchs1b−/−; MZdchs2−/−, p<0.0001; MZdchs1a; Zdchs1b+/−; MZdchs2−/− vs. MZdchs1a−/−; Zdchs1b−/−; MZdchs2−/−, p<0.001.
Figure 2.
Figure 2.
Endogenous expression of Dchs1b in the membrane and cytoplasm during epiboly A. Schema of generating dchs1b-2xsfGFP line. B. Agarose electrophoresis gel showing genotyping for the endogenous dchs1b locus without and with 2xsfGFP insertion. C. Confocal images at 60% epiboly with nuclei and membranes labeled with H2B-RFP (red) and mCherry-CAAX (red) along with endogenous expression of Dchs1b tagged with six copies of sfGFP (green) in both the EVL and DEL.
Figure 3.
Figure 3.
Bundled yolk microtubule array structures in dchs triple mutants A. Confocal images at 50% epiboly of WT and dchs triple mutants stained with DAPI (blue) and for DM1α (microtubules, green). Arrowhead indicates microtubule bundling. B. Quantification of yolk microtubule bundling through measurement of bare yolk areas lacking microtubules at 50% epiboly. **p<0.01. WT N=25 embryos, MZdchs1a−/−; Zdchs1b−/−; MZdchs2−/− N=32 embryos. C. Confocal images of yolk microtubule meshwork marked with DM1α, just vegetal of YSL of WT and dchs triple mutants at 50% epiboly. D. Quantification of yolk microtubule alignment coherency. ****p<0.0001. WT N=25 embryos, MZdchs1a−/−; Zdchs1b−/−; MZdchs2−/− N=32 embryos.
Figure 4.
Figure 4.
Yolk microtubule polymerization in dchs triple mutants A. Sample confocal images (left) and maximum time projections of time lapses (right) of WT and dchs triple mutants labeled with EB3-GFP. Arrowhead indicates disorganized area of polymerization. Embryo schema on the right with the box illustrating YCL imaging region. B. Frequency distribution of EB3 track duration. Error bars indicate SEM. WT N=9 embryos, n=26,573 tracks. MZdchs1a−/−; Zdchs1b−/−; MZdchs2−/− N=18, embryos n=29,668. Wilcoxon matched-pairs rank test, *p<0.05. C. Frequency distribution of EB3 track displacement. Error bars indicate SEM. WT N=9 embryos, n=26,573 tracks. MZdchs1a−/−; Zdchs1b−/−; MZdchs2−/− N=18, embryos n=29,668. Wilcoxon matched-pairs rank test, **p<0.01. D. Frequency distribution of EB3 track average speed. Error bars indicate SEM. WT N=9 embryos, n=26,573 tracks. MZdchs1a−/−; Zdchs1b−/−; MZdchs2−/− N=18, embryos n=29,668. Wilcoxon matched-pairs rank test, ns, *p<0.05.
Figure 5.
Figure 5.
Tyrosinated and acetylated tubulin modifications in dchs triple mutants A. Confocal images of yolk microtubules (DM1α, red) and tyrosinated tubulin (green) in both WT and dchs triple mutants. B. Quantification of tyrosinated tubulin staining associated with yolk microtubules. Error bars indicate SEM. C. Confocal images of yolk microtubules (DM1α, red) and acetylated tubulin (green) in both WT and dchs triple mutants. Asterisks in merged channels indicate microtubule spindles.
Figure 6:
Figure 6:
Interaction between dchs1b and ttc28 genes in epiboly progression. A. Representative confocal images (from the top to bottom row) of WT, MZttc28−/−, MZdchs1b−/−, and MZdchs1b−/−; MZttc28−/− with nuclei labeled with DAPI and yolk microtubules with DM1α (green) at 60% epiboly. B. Quantification of the separation between the EVL and DEL during epiboly in embryos of the above genotypes. The following number of embryos from four different clutches were analyzed: WT, n=33; MZttc28−/−, n=17; MZdchs1b−/−, n=37; MZdchs1b−/−;MZttc28−/−, n=23.
Figure 7:
Figure 7:
Images of the actin cytoskeleton organization in WT embryos (A, A’,A’’, A’’’) and MZdchs1b mutants (B, B’, B’’, B’’’) harboring Tg(β-actin:utrophin-GFP) transgene that were captured from Supplemental Movie 1 at 30% epiboly (based on WT embryo epiboly progression) (A,B), 40% epiboly (A’,B’); 60% epiboly (A’’, B’’), and 90% epiboly (A’’’, B’’’).
Figure 8:
Figure 8:
Altered transcriptome in MZdchs1a,b,2 triple mutants at the end of epiboly (10hpf). A. Representative dissecting microscope images of WT and the three phenotypic classes of MZdchs1a,b,2 triple mutant embryos. Only classes CI and CII were collected for bulk RNA sequencing analysis. B. Principal component analysis using RNA sequencing data. Percent variability within each principal component is listed on each axis. C. Heatmap of correlation of 3 independent RNA samples of WT, mild and severely affected MZdchs1a,b,2 triple mutant embryos. The color represents the strength and direction of correlation. D. Table presenting the number of differentially expressed genes in WT and the mild and severely affected MZdchs1a,b,2 triple mutant embryos (high in mutant or in WT). E. Venn diagrams representing the overlap and differences in gene expression between genes upregulated (left) or downregulated (right) in the mild and severely affected MZdchs1a,b,2 triple mutant embryos relative to WT.

References

    1. Akhmanova A., Steinmetz M.O., 2015. Control of microtubule organization and dynamics: two ends in the limelight. Nat. Rev. Mol. Cell Biol. 16, 711–726. 10.1038/nrm4084 - DOI - PubMed
    1. Bagherie-Lachidan M., Reginensi A., Pan Q., Zaveri H.P., Scott D.A., Blencowe B.J., Helmbacher F., McNeill H., 2015. Stromal Fat4 acts non-autonomously with Dchs1/2 to restrict the nephron progenitor pool. Dev. Camb. Engl. 142, 2564–2573. 10.1242/dev.122648 - DOI - PubMed
    1. Berezniuk I., Lyons P.J., Sironi J.J., Xiao H., Setou M., Angeletti R.H., Ikegami K., Fricker L.D., 2013. Cytosolic carboxypeptidase 5 removes α- and γ-linked glutamates from tubulin. J. Biol. Chem. 288, 30445–30453. 10.1074/jbc.M113.497917 - DOI - PMC - PubMed
    1. Bruce A.E.E., Heisenberg C.-P., 2020. Chapter Eleven - Mechanisms of zebrafish epiboly: A current view, in: Solnica-Krezel L. (Ed.), Current Topics in Developmental Biology. - PubMed
    1. Bruce Ashley E. E., Heisenberg C.-P., 2020. Chapter Eleven - Mechanisms of zebrafish epiboly: A current view, in: Solnica-Krezel L. (Ed.), Current Topics in Developmental Biology, Gastrulation: From Embryonic Pattern to Form. Academic Press, pp. 319–341. 10.1016/bs.ctdb.2019.07.001 - DOI - PubMed

Publication types

LinkOut - more resources