[Preprint]. 2025 May 12:2022.05.20.492851.
doi: 10.1101/2022.05.20.492851.

A GATA factor radiation in Caenorhabditis rewired the endoderm specification network

Affiliations

A GATA factor radiation in Caenorhabditis rewired the endoderm specification network

Antonia C Darragh et al. bioRxiv. .

Abstract

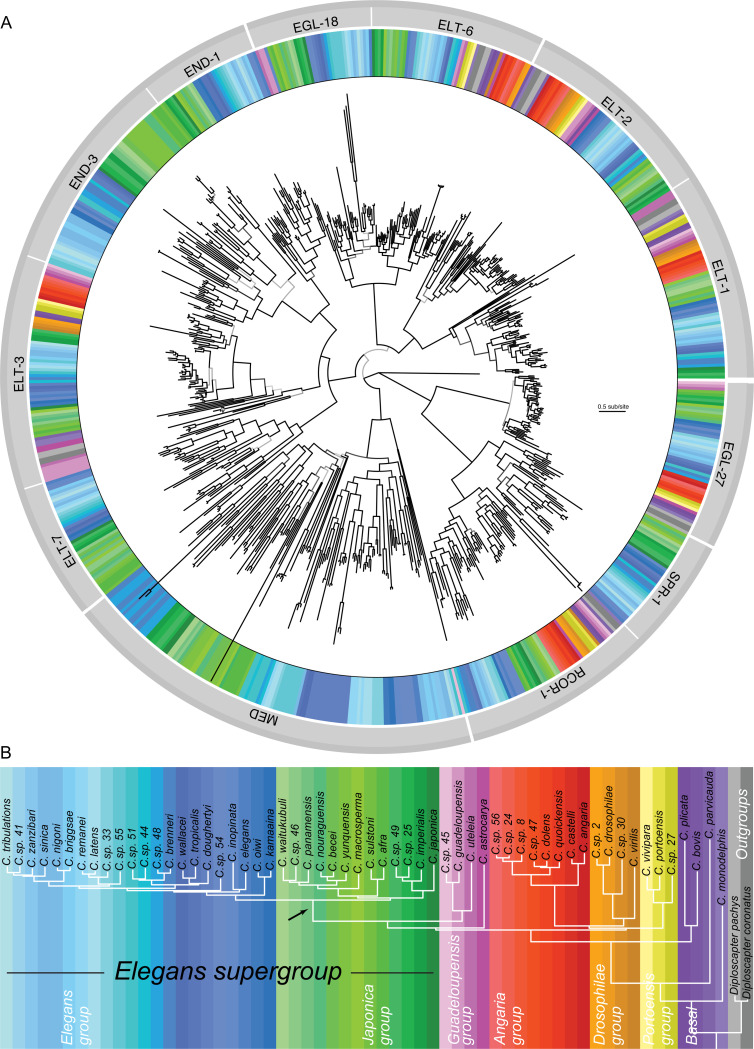
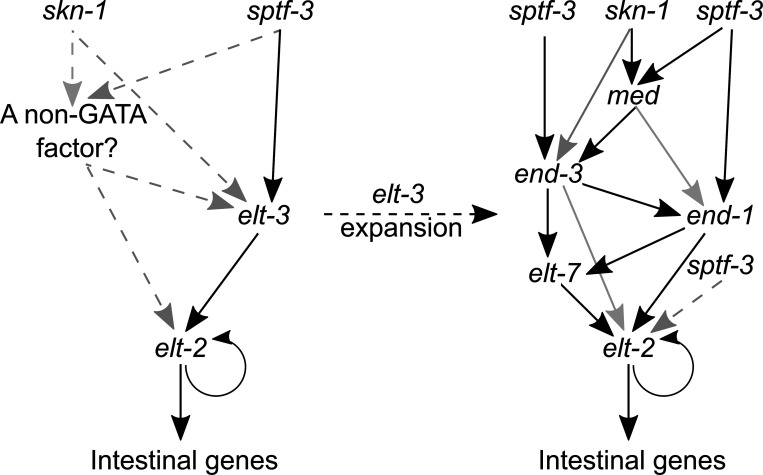
Although similar developmental regulatory networks can produce diverse phenotypes, different networks can also produce the same phenotype. In theory, as long as development can produce an acceptable end phenotype, the details of the process could be shielded from selection, leading to the possibility of developmental system drift, where the developmental mechanisms underlying a stable phenotype continue to evolve. Many examples exist of divergent developmental genetics underlying conserved traits. However, studies that elucidate how these differences arose and how other features of development accommodated them are rarer. In Caenorhabditis elegans, six transcription factors that bind motifs with a GATA core sequence (GATA factors) comprise the zygotic part of the endoderm specification network. Here we show that the core of this network - five of the genes - originated within the genus during a brief but explosive radiation of this gene family and that at least three of them evolved from a single ancestral gene with at least two different spatio-temporal expression patterns. Based on analyses of their evolutionary history, gene structure, expression, and sequence, we explain how these GATA factors were integrated into this network. Our results show how gene duplication fueled the developmental system drift of the endoderm network in a phylogenetically brief period in developmentally canalized nematodes.


Figures

Figure 1.
Figure 1.. C. elegans endoderm specification network.
The C. elegans endoderm specification network is shown on the right and the approximate embryonic stages during which most of the gene expression associated this network takes place is shown on the left. This network is initiated primarily by SKN-1 in the EMS cell (orange cell on bottom of four-cell embryo); however, SPTF-3, POP-1, and possibly PAL-1 also contribute to the activation of this GATA factor cascade, as shown. Six of the 11 C. elegans GATA factors (med-1, med-2, end-3, end-1, elt-7, and elt-2) function in this network (as shown). med-1 and med-2 expression initiates in the EMS cell and MED-1 and MED-2 regulate genes in both the first endoderm (1E) cell (green cell on bottom right of eight-cell embryo) and the first mesoderm (MS) cell (purple cell to the left of the 1E cell). end-3 expression starts in the late EMS or early 1E cell while end-1 expression starts in the late 1E or early two endoderm (2E) cell stage (two green cells in 14-cell embryo). elt-7 expression starts in the 2E cells and elt-2 expression starts near the beginning of the 4E cell stage (not shown). Black arrows indicate well supported regulatory connections, while gray and dashed gray arrows represent weaker and not as well supported interactions, respectively.
Figure 2.
Figure 2.. Inferred evolutionary history of Caenorhabditis GATA-domain-containing proteins.
(A) Maximum likelihood phylogeny of 714 “confident” GATA-domain-containing proteins in 58 Caenorhabditis and two outgroup nematode species. A GATA factor from the slime mold Dictyostelium fasciculatum was used to root the phylogenic tree (located between the ELT-1 and EGL-27 ortholog groups). The tree includes both canonical GATA factors and EGL-27, SPR-1, and RCOR-1 orthologs which are proteins that contain atypical GATA-binding domains but which scored above our threshold on the PROSITE GATA-type ZnF domain profile. The colors in the ring encircling the tree correspond to the species in which the protein was identified (the key to color-species correspondence is given in C below). The names of the 12 ortholog groups the 714 proteins were categorized into are indicated in the lighter of the two outer gray rings (with white gaps between groups). Clades comprising multiple ortholog groups are highlighted by the darker gray outer ring (with white gaps between clades). The intensity of shading of each branch of the tree is indicative of its degree of bootstrap support, darker shading indicates stronger support. The key for translating branch length into evolutionary distance (in units of amino acid substitutions per site) is shown to the right of the tree. (B) Phylogenetic relationships among the 60 species used in this study (based on Stevens (2020)). Each species is designated by a different color shade; color-species designations are the same as used in (B) above. The black arrow points to the Elegans supergroup ancestral branch where the ancestral med, end-1, end-3, and elt-7 genes, as we know them from C. elegans, likely arose.
Figure 3.
Figure 3.. Expression of elt-3 and elt-2 mRNA in C. angaria, a non-Elegans supergroup species.
(A-C) Image of five embryos, each at a different developmental stage, illustrating the patterns of elt-3 and elt-2 mRNA expression observed in C. angaria using smFISH. The embryo depicted at the top left is at the comma stage (approximately) and contains more than 100 cells; the embryo at the bottom left is at the bean stage (approximately) and contains more than 100 cells; the embryo at the top right contains 54 cells; the embryo in the middle on the right contains 16 cells; and the embryo at the bottom right contains 25 cells. (A) Visualization of C. angaria elt-2 mRNA after hybridization with a smFISH probe specific for C. angaria elt-2. (B) Visualization of C. angaria elt-3 mRNA after hybridization with a smFISH probe specific for C. angaria elt-3. (C) DAPI-stained nuclei of C. angaria embryos (proxy for developmental stage). (D) Model of C. angaria endoderm specification network based on these smFISH results.
Figure 4.
Figure 4.. Conservation of TGATAA sites in putative promoters of orthologs specifically expressed or enriched for expression in gut and muscle.
Heatmaps of the number of TGATAA sites in the promoter regions of orthologs expressed specifically or primarily in (A) gut versus (B) muscle in the 59 non-C. elegans species included in this study. The columns comprising the x-axis represent each species, in the same order (left to right) as the listing of species in the phylogeny shown in Figure 2B. Each row on the y-axis represents the promoter region of a C. elegans gene (McGhee et al. 2007; McGhee et al. 2009), ordered using hierarchical clustering with Euclidean distance metric. The color key is shown to the right of each heatmap plot. To make the color scaling more informative, the few promoter regions that had more than 10 TGATAA sequences are shown as having only 10 TGATAA sites within their promoters. White space in heatmaps indicates species for which we did not find an ortholog for that C. elegans gene. (A) Promoters of C. elegans orthologs specifically expressed or enriched for expression in gut. (B) Promoters of C. elegans orthologs specifically expressed or enriched for expression in muscle.
Figure 5.
Figure 5.. Comparison of transcription factor binding sites in Caenorhabditis elt-3 and elt-2 promoters.
Transcription factor binding sites of interest, including those found significantly more than expected by chance, are indicated in the predicted proximal promoters of the elt-3 (A) and elt-2 (B) orthologs from the Caenorhabditis species included in this study. Aligned promoter sequences are represented by gray boxes, whereas gray horizontal lines between the boxes represent gaps in the alignment. Each entry represents the predicted proximal promoter sequence of an elt-3 (A) or elt-2 (B) ortholog and they are listed in the same order (top to bottom) as the Caenorhabditis species in the phylogeny shown in Figure 2B (left to right). The black boxes delineate the different species clades. The keys to the different transcription factor binding site motifs (depicted using triangles of different colors), and the highly conserved HGATAR sites (depicted using circles of different colors), are shown between panels (A) and (B). (A) elt-3 ortholog promoter sequences. Note the highly conserved HGATAR site in the Elegans group species (indicated above the panel). (B) elt-2 ortholog promoter sequences. Note the highly conserved HGATAR sites (colored circles) in the Elegans supergroup species (as highlighted above each panel).
Figure 6.
Figure 6.. Scenarios for how initiation of the expansion of endoderm specification GATA factors could have occurred.
Comparison of possible gene duplication scenarios for initiating GATA factor expansion, those supported by our results (A-D) and another proposed by Maduro (Maduro 2020) (E). (A) Scenario involving two duplications of elt-3, one which produced the ancestor of elt-7 and another which produced the ancestor end gene. (B) Scenario involving a single elt-3 duplication, in which one duplication of elt-3 produced the ancestor elt-7/end gene and then a subsequent duplication of the elt-7/end ancestral gene produced the ancestors of the elt-7 and end genes. (C) Details of the proposed scenario involving a single duplication of a full-length elt-3. (Alternatively, if instead of one, two full-length elt-3 duplications occurred, then the first three steps of this scenario could occur twice to produce the elt-7 and end ancestor genes.) (D) Details of a proposed scenario involving a single, partial duplication of elt-3. (Alternatively, if instead of one, two partial-length elt-3 duplications occurred, the first two steps of this scenario could occur twice to produce the elt-7 and end ancestor genes.) (E) Molecular representation of a previously published hypothesis (Maduro 2020) for how two elt-2 duplications could have produced the elt-7 and end ancestor genes. The key to color-coding of gene domains and expression patterns is located in the upper right corner of the figure.
Figure 7.
Figure 7.. Evolutionary model of how GATA factors expanded in the endoderm specification network.
Data from this study are consistent with this evolutionary model in which, prior to our proposed expansion of the elt-3 gene in the endoderm specification network (left side of figure), the functioning of this network was initiated by expression of sptf-3 and/or skn-1, which activated elt-3 (and possibly another transcription factor expressed earlier, depicted as “A non-GATA factor?”). Expression of ELT-3 (and possibly other transcription factors) then activated elt-2. ELT-2 then likely regulated hundreds of genes expressed specifically (or primarily) in the intestine and perhaps auto-regulated its own gene expression. This “pre-expansion” network (shown on the left) is expected to be similar to the endoderm specification networks found in non-Elegans supergroup and non-Guadeloupensis group species, like C. angaria. Our data suggest that a duplication(s) of elt-3 led to the addition of three or four GATA factor paralogs to the endoderm specification network that function between sptf-3 and/or skn-1 and elt-2 resulting in the network shown on the right. This model predicts that during the GATA factor expansion elt-3 paralogs subfunctionalized into: an elt-3-like gene expressed only in the hypoderm (not shown), an endoderm-specifically expressed elt-7, and an ancestor of the end genes. (See Figure 6A–D for molecular details of how this subfunctionalization could have occurred). Data from this study also support the previously proposed hypotheses that an additional end gene duplication produced the ancestors of end-1 and end-3 (Maduro, Hill, et al. 2005; Coroian et al. 2006) and that another end gene duplication likely produced the ancestor med gene (Maduro 2020). Neither we nor Maduro (Maduro 2020) found POP-1 nor PAL-1 transcription factor binding sites overrepresented in end-1 (or end-3) promoters and therefore they are not included in the network on the right. Black arrows indicate well supported regulatory connections, while gray and dashed gray arrows represent weaker and not as well supported interactions, respectively.

Similar articles

References

    1. Altschul SF, Gish W, Miller W, Myers EW, Lipman DJ. 1990. Basic local alignment search tool. J Mol Biol 215:403–410. - PubMed
    1. Araya CL, Kawli T, Kundaje A, Jiang L, Wu B, Vafeados D, Terrell R, Weissdepp P, Gevirtzman L, Mace D, et al. 2014. Regulatory analysis of the C. elegans genome with spatiotemporal resolution. Nature 512:400–405. - PMC - PubMed
    1. Assis R, Bachtrog D. 2013. Neofunctionalization of young duplicate genes in Drosophila. Proc Natl Acad Sci U S A 110:17409–17414. - PMC - PubMed
    1. Bailey TL, Elkan C. 1994. Fitting a mixture model by expectation maximization to discover motifs in biopolymers. Proc Int Conf Intell Syst Mol Biol 2:28–36. - PubMed
    1. Baugh LR, Hill AA, Slonim DK, Brown EL, Hunter CP. 2003. Composition and dynamics of the Caenorhabditis elegans early embryonic transcriptome. Development 130:889–900. - PubMed

Publication types

LinkOut - more resources