[Preprint]. 2025 May 17:2025.05.15.654234.
doi: 10.1101/2025.05.15.654234.

When should adaptation arise from a polygenic response versus few large effect changes?

Affiliations

When should adaptation arise from a polygenic response versus few large effect changes?

William R Milligan et al. bioRxiv. .

Abstract

The question of when adaptation involves genetic changes of large effect versus a polygenic response traces back to early debates around Darwin's "Origin of Species" and remains unanswered today. While there are compelling reasons to expect polygenic adaptation to be common, direct evidence for it is still lacking. In turn, there are hundreds of examples of large effect adaptations across species, but it is unclear whether they are a common occurrence in any given species. Synthesizing the different lines of evidence is further complicated by differences in study designs, limitations and biases. Here, we reframe this long-standing question in terms of the trait under selection and ask how the genetic basis of adaptation is expected to depend on key properties of the genetic variation in the trait (i.e., the trait genetics) and on the changes in selection pressures that act on it (i.e., the "trait ecology"). To study this question, we consider a quantitative trait subject to stabilizing selection and model the response to selection when a population at mutation-selection-drift balance experiences a sudden shift in the optimal value. Using this model, we delimit how the contributions of large effect and polygenic changes to adaptation depend on the genetics and ecology of the trait, as well as other salient factors. This theory allows us to formulate testable predictions about when different modes of adaptation are expected and to outline a framework within which to interpret disparate sources of evidence about the genetic basis of adaptation.


Figures

Figure 1.
Figure 1.
The model.
Figure 2.
Figure 2.
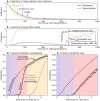
The adaptive response in the highly polygenic case. (A) The change in distance of the mean phenotype from the new optimum after the shift follows Lande’s approximation. (B) The shape of the phenotypic distribution does not change during the rapid phase. (C) The trajectories of small and intermediate effect alleles result in the preferential fixation of alleles aligned with the shift relative to those opposing it. (D) The trajectories of large effect alleles always end with their loss. These illustrations correspond to a shift size Λ=80, variance VA=400, with cartoon trajectories corresponding to a2=5 and 35 and initial frequencies 1/a2 in (C) and (D), respectively.
Figure 3.
Figure 3.
Fixation of a single large effect allele. The trajectories of the mean distance from the optimum (in A) and the trajectories of the large effect allele (in B and C) are shown for individual simulations with N=5000,a2=200 with x0=1/2a2,σ2=40, and Λ=50 (purple) and 100 (yellow and black [in C]). The probabilities that a segregating allele establishes itself in the population and fixes (shown in D) assume N=5000,σ2=40 (and 80 for the gray line in D), a2=200, and average over the distribution of initial frequencies at MSDB. The probabilities for a new allele were calculated for the same parameters, assuming that the allele is equally likely to arise (at frequency 1/2N) any time between the shift and time t=606 (at which DL(t)=δ). These calculations are described in supplement section 3. Simulation results were averaged over 16,000 and 64,000 replicas in (D) and (E), respectively.
Figure 4.
Figure 4.
The long-term contribution of large effect alleles to adaptation. The mean contributions (±2SD) shown in (A) were calculated from 600 replicas of simulations with N=5000, the distribution of effect sizes in Fig. 1, Λ=80 and σ2=40. The expected number of large effect fixations (in B) and large effect establishments (in C) were calculated assuming the same parameters as in (A), with 2NU=0.01 (see supplement section 4). Simulation results closely match the analytic calculations (as shown in Fig. S2) and were omitted for clarity. Shaded regions in (B) and (C) correspond to regions defined as in Fig. 3E.
Figure 5.
Figure 5.
The adaptive response with many large effect alleles (for 2NU=10). The mean distance from the optimum (shown in A) and phenotypic distributions (in B) are based on averaging 100 simulations with Λ=80,σ2=40,N=5000, and the distribution of effect sizes shown in Fig. 1. The phenotypic distributions shown correspond to times: before the shift, 20, 42 (when adaptation slows down; see supplement section 5) and 300 genrations, and after the population equilibrates around the new optimum. Large effect allele trajectories (shown in C) were randomly sampled from a single simulation with the same parameters to include 1–5 alleles that exceed frequency 1% and eventually go extinct in each bin of effect sizes (colored bars on the right), as well as one allele that fixes. The dotted lines that cross panels correspond to the distances and times where selection on rare alleles (x1/2) with effect sizes a2=1500, 500 and 100 changes sign.
Figure 6.
Figure 6.
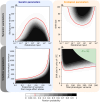
The probability of large effect fixations as a function of genetic and ecological parameters of traits. The contours were drawn by estimating fixation probabilities in simulations with an evenly spaced grid of parameter combinations and smoothing the results using a Gaussian noise filter (see supplement section 7 for more details). The model parameters were N=5000, the distribution of effect sizes from Fig. 1, Λ=80 in (A) and (C), σ2=80 in (B), and a proportion of variance from large effect alleles p=0.5 in (D). The green region in (D) is where Λ>VS (see supplement section 1). See Figs. S4–7 for alternative parameter values and the simulation results without smoothing.

References

    1. Agrawal AA, Hastings AP, Lenhart PA, Blecher M, Duplais C, Petschenka G, et al. 2024. Convergence and Divergence among Herbivorous Insects Specialized on Toxic Plants: Revealing Syndromes among the Cardenolide Feeders across the Insect Tree of Life. The American Naturalist. 204(3):201–220. 10.1086/731277. - DOI - PubMed
    1. Andreassen OA, Thompson WK, Schork AJ, Ripke S, Mattingsdal M, Kelsoe J, et al. 2013. Improved Detection of Common Variants Associated with Schizophrenia and Bipolar Disorder Using Pleiotropy-Informed Conditional False Discovery Rate. PLOS Genetics. 9(4):e1003455. 10.1371/journal.pgen.1003455. - DOI - PMC - PubMed
    1. Barton NH. 1986. The maintenance of polygenic variation through a balance between mutation and stabilizing selection. Genetics Research. 47(3):209–216. 10.1017/S0016672300023156. - DOI - PubMed
    1. Barton NH. 2000. Genetic hitchhiking. Philosophical Transactions of the Royal Society of London Series B: Biological Sciences. 355(1403):1553–1562. 10.1098/rstb.2000.0716. - DOI - PMC - PubMed
    1. Barton NH, Hermisson J, Nordborg M. 2019. Why structure matters. eLife. 8:e45380. 10.7554/eLife.45380. - DOI - PMC - PubMed

Publication types

LinkOut - more resources