[Preprint]. 2025 May 12:2025.05.10.653279.
doi: 10.1101/2025.05.10.653279.

Genetic association meta-analysis is susceptible to confounding by between-study cryptic relatedness

Affiliations

Genetic association meta-analysis is susceptible to confounding by between-study cryptic relatedness

Tiffany Tu et al. bioRxiv. .

Abstract

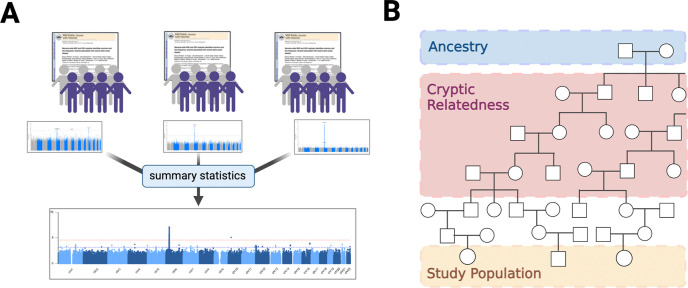
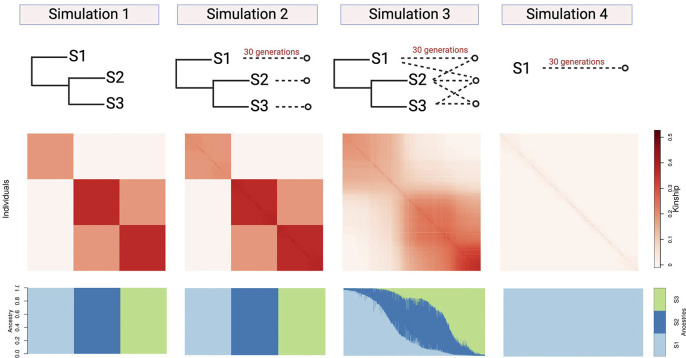
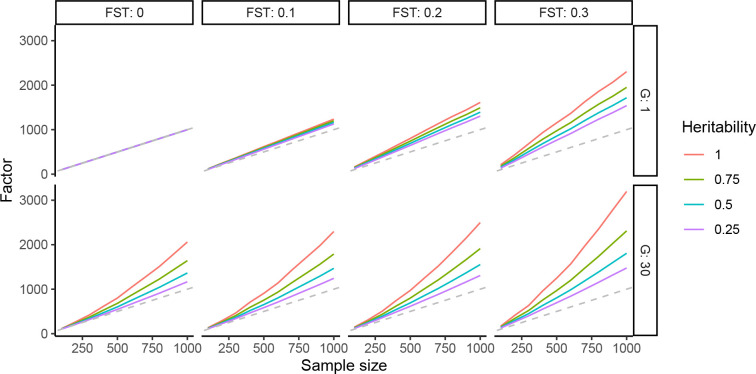
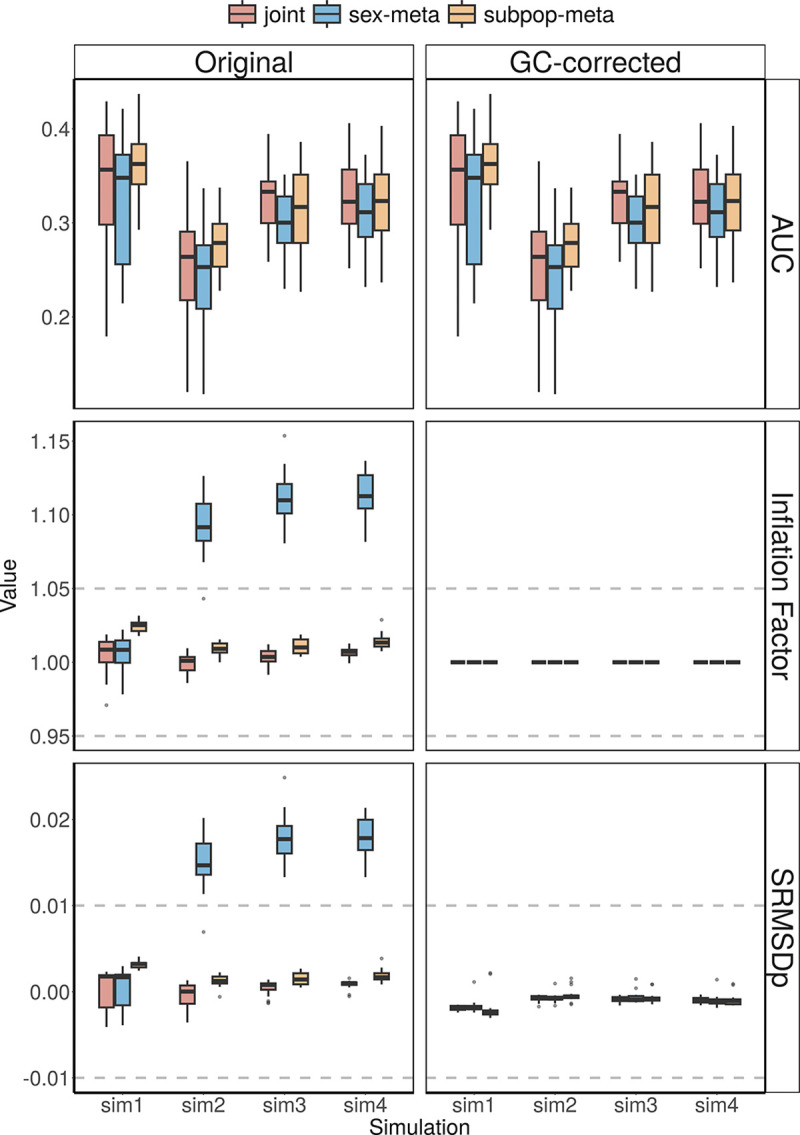
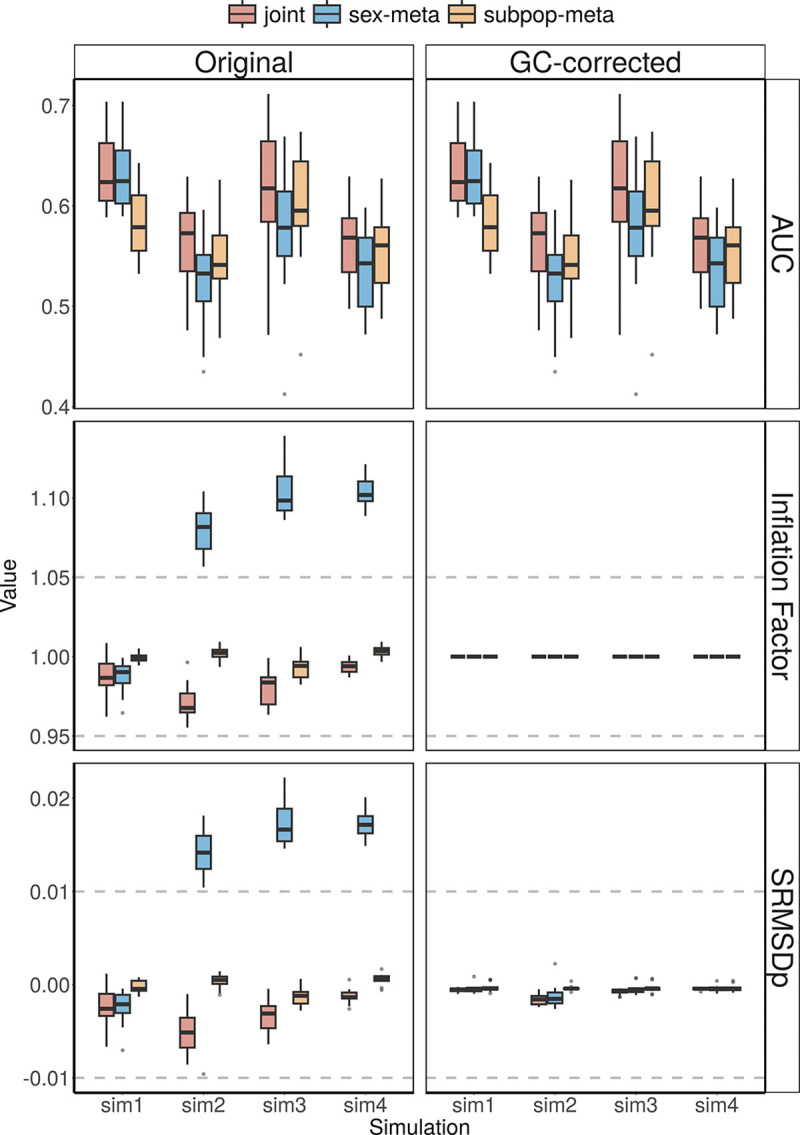
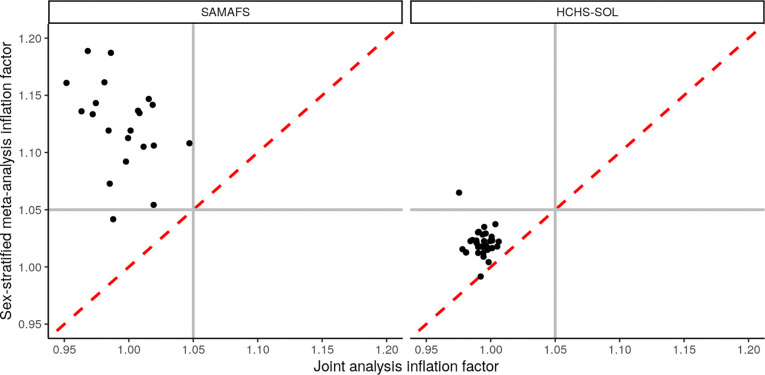
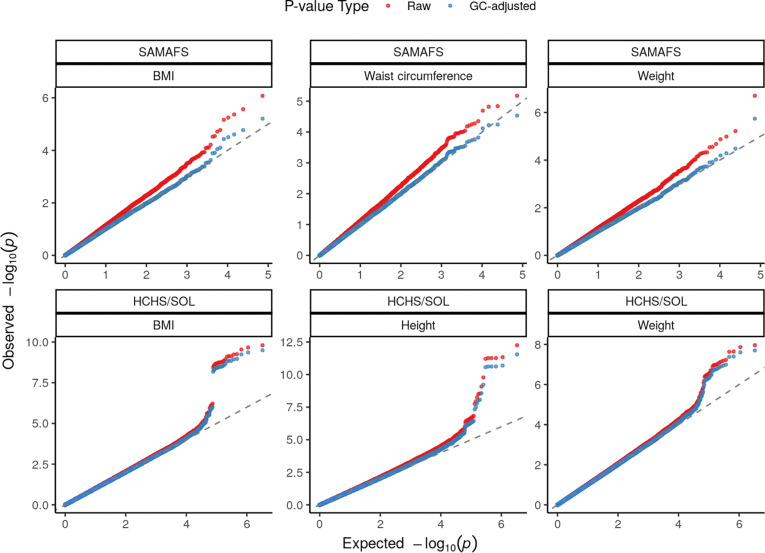
Meta-analysis of Genome-Wide Association Studies (GWAS) has important advantages, but it assumes that studies are independent, which does not hold when there is relatedness between studies. As a motivating example, recent work suggested applying sex-stratified meta-analysis to correct for participation bias, without considering that men and women from the same population will be highly related. Our theory demonstrates how cryptic relatedness results in correlated test statistics between studies, inflating meta-analysis. We characterize the effects of different between-study relatedness scenarios, particularly population structure and recent family relatedness, on meta-analysis type I error control and power. We simulated data with (1) no family relatedness between subpopulations, (2) family relatedness within subpopulations, (3) family relatedness across subpopulations, and (4) single population with family relatedness. We run joint and meta-analyses on simulations using both binary and quantitative traits. In scenarios with family relatedness, sex-stratified meta-analysis exhibits severe inflation and lower AUC compared to joint and subpopulation meta-analyses. Remarkably, genomic control succeeds in correcting inflation in these cases, but does not alter calibrated power. Analysis of real datasets confirms severe inflation for sex-stratified meta-analysis in family studies, but a negligible effect for population studies with up to 10,000 individuals. Our theoretical framework demonstrates that the inflation factor increases as the sample size increases. We recommend against meta-analyzing studies that share the same populations, which increases the risk of inflation due to cryptic relatedness between studies.


Conflict of interest statement

Declaration of interests The authors declare no competing interests.

Figures

Fig. 1:
Fig. 1:. Cryptic relatedness can cause inflation in GWAS meta analysis.
A. Illustration of a standard GWAS meta-analysis pipeline, which combines summary statistics from multiple studies while assuming data independence. Population structure due to ancestry differences and cryptic relatedness are both common causes of dependence between individuals in GWAS. B. Different degrees of relatedness visualized through a pedigree. Cryptic relatedness is a form of family relatedness that is recent but unknown to the researchers. Family structure is high dimensional, and must be modeled with linear mixed-effects models in GWAS [12]. In contrast, ancestry is a more ancient form of relatedness that is broadly shared across the population, so it can be modeled with low dimensional models such as PCA. (Created with BioRender.com)
Fig. 2:
Fig. 2:. Overview of the population and family structure of simulation scenarios.
Top row: Phylogenetic trees summarize the key features of each relatedness structure. Population and family structure are represented by solid and dashed lines, respectively. Middle row: Kinship matrices show the covariance structure between each pair of individuals (along both x and y axes, using the same order of the underlying one-dimensional space of the simulations), where color represents their total kinship coefficient (reflecting both population and family relatedness). Diagonal plots inbreeding coefficients instead of self kinship since inbreeding is in the same scale as the rest of kinship values. Note family structure results in more high-kinship pairs that appear near the diagonal of simulations 2–4. Bottom row: Admixture proportions better summarize the population structure in this data, ignoring family structure. Each individual (x axis) has a stacked barplot of ancestry proportions (colors) that sums to one. Only simulation 3 has admixture (individuals with more than one ancestry).
Fig. 3:
Fig. 3:. Dependence of within-study factor on sample size, population and family structure, and heritability.
We plotted nj versus the within-study factor fVj (see Appendix A) for a single study j, separately for combinations of FST, heritability, and family structure (G=1 versus 30 generations). Dashed gray line is y=x. For each combination of G and FST, kinship matrices were constructed for n=1,000 individuals from the 1-dimensional admixture model used in [29] followed by G generations of family structure (Methods), then Vj=2h2Φj+1-h2Inj was calculated according to the desired heritability. Lower sample sizes were obtained by subsampling.
Fig. 4:
Fig. 4:. Simulation results confirm cryptic relatedness between studies results in considerable inflation upon meta-analysis.
Simulations (x-axis) have different presence and arrangement of population and family structure. AUCPR reflects calibrated power (higher is better), while both inflation factor (1 is best, > 1.05 is inflated) and SRMSDp (0 is best, > 0.01 is inflated) measure null p-value calibration, the latter more strictly (see Methods). Results from 20 replicates using binary trait LMMs show that simulations with 30 generations of family relatedness (sim 2,3,4) demonstrate severe inflation and SRMSDp values for sex-meta analyses and overall lower AUCPR compared to subpop-meta and joint analyses. GC-corrected results show that despite improved type I error control (inflation factor and SRMSDp), the correction does not improve the loss of calibrated power (AUCPR) due to confounding.
Fig. 5:
Fig. 5:. Simulation results for quantitative traits.
Results from 20 replicates using a quantitative trait LMM exhibit similar patterns as the binary model (Figure 4) across all four simulation scenarios, where GC-corrected results improve inflation factor and SRMSDp, but not AUCPR.
Fig. 6:
Fig. 6:. Inflation greater for sex-stratified meta-analyses of real genotypes and phenotypes.
Inflation factors in joint analysis (x-axis) are smaller than those of sex-stratified meta-analysis (y-axis) for all but one of the traits analyzed. Values greater than 1.05 (horizontal and vertical gray lines) are considered inflated. Red dashed line is y=x line. In both datasets, all traits were calibrated in the joint analysis. In the T2D-GENES SAMAFS family study (20 quantitative traits and the single binary trait), all traits except one are inflated under the meta-analysis approach. In the HCHS/SOL population study (33 quantitative traits), only one trait is inflated under meta-analysis, although inflation factors were still consistently larger for meta-analysis compared to joint analysis.
Fig. 7:
Fig. 7:. Quantile-quantile plots for meta-analysis p-values of most inflated traits before and after GC correction.
Top three traits per dataset ranked by meta-analysis inflation factor. In SAMAFS, original (raw) inflation is severe (curve departs early from the null expectation, which is the diagonal y=x line, sits primarily above it), and GC successfully corrects inflation (curve follows diagonal much longer) without overcorrecting (curve does not dip below diagonal at the lowest values). In HCHS/SOL, GC also succeeds without overcorrecting, although original inflation was less severe.

Similar articles

References

    1. Zeggini E. and Ioannidis J. P.. “Meta-analysis in genome-wide association studies”. Pharmacogenomics 10(2) (2009), pp. 191–201. doi: 10.2217/14622416.10.2.191. - DOI - PMC - PubMed
    1. Thompson J. R., Attia J., and Minelli C.. “The meta-analysis of genome-wide association studies”. Briefings in Bioinformatics 12(3) (2011), pp. 259–269. doi: 10.1093/bib/bbr020. - DOI - PubMed
    1. Devlin B. and Roeder K.. “Genomic control for association studies”. Biometrics 55(4) (1999), pp. 997–1004. doi: 10.1111/j.0006-341x.1999.00997.x. - DOI - PubMed
    1. Voight B. F. and Pritchard J. K.. “Confounding from Cryptic Relatedness in Case-Control Association Studies”. PLoS Genetics 1(3) (2005), e32. doi: 10.1371/journal.pgen.0010032. - DOI - PMC - PubMed
    1. Price A. L. et al. “Principal components analysis corrects for stratification in genome-wide association studies”. Nature Genetics 38(8) (2006), pp. 904–909. doi: 10.1038/ng1847. - DOI - PubMed

Publication types