. 2025 Jun 3:8:0718.
doi: 10.34133/research.0718. eCollection 2025.

Piezo1-Mediated Ferroptosis Delays Wound Healing in Aging Mice by Regulating the Transcriptional Activity of SLC7A11 through Activating Transcription Factor 3

Affiliations

Piezo1-Mediated Ferroptosis Delays Wound Healing in Aging Mice by Regulating the Transcriptional Activity of SLC7A11 through Activating Transcription Factor 3

Chen Jin et al. Research (Wash D C). .

Abstract

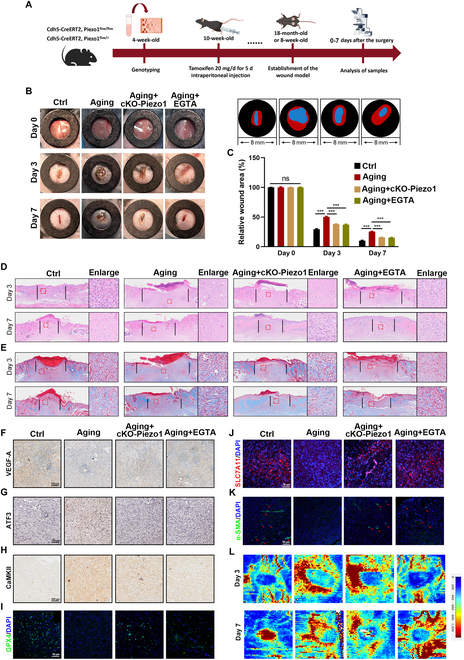
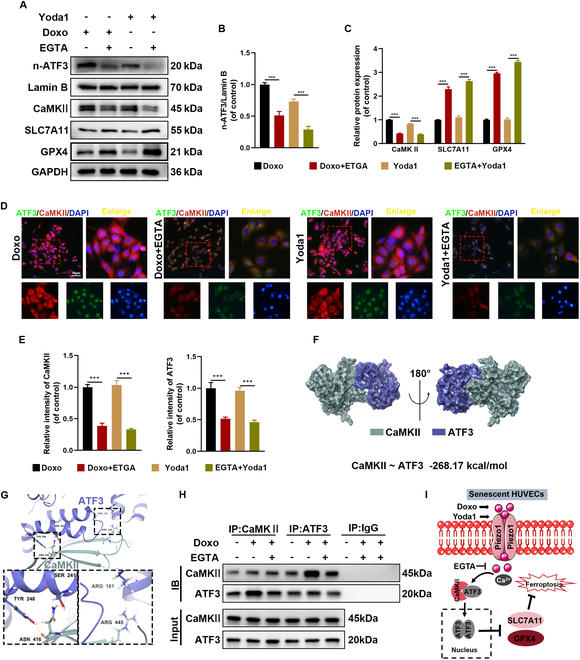
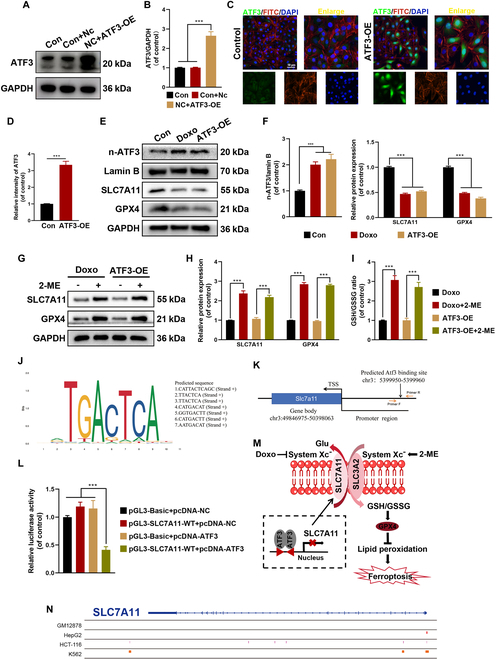
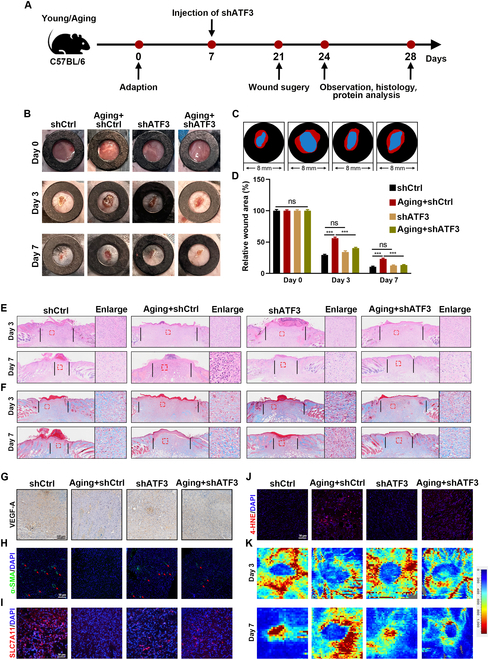
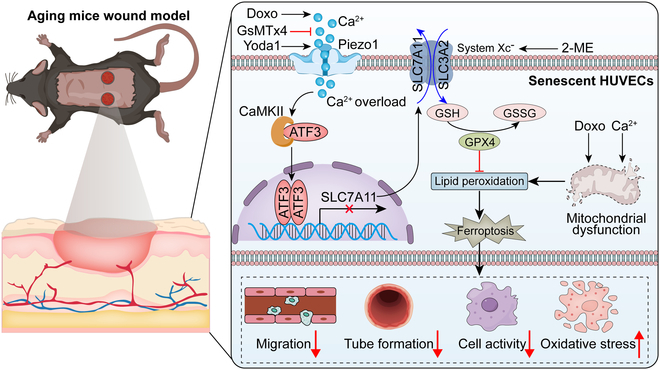
Ferroptosis plays a role in wound healing during the maturation of senescent endothelial cells. This study explores the modulation of ferroptosis in senescent human umbilical vein endothelial cells (HUVECs) and wound-healing processes by Piezo1 activation at the molecular, cellular, and tissue levels. Elevated Piezo1 expression was observed in HUVECs treated with the senescence inducer doxorubicin (Doxo) and the ferroptosis inducer erastin and in aged wound tissue. Pharmacological inhibition or knockdown of Piezo1 protected senescent HUVECs and aged wound tissue from ferroptosis. Additionally, Piezo1 channel activity was found to promote ferroptosis in senescent HUVECs by increasing intracellular Ca2+ levels. The calmodulin-dependent kinase II (CaMKII)/activating transcription factor 3 (ATF3)/SLC7A11 signaling axis was activated upon stimulation with erastin and Doxo, driving Piezo1-induced ferroptosis. CaMKII directly interacted with ATF3, which could be modulated through Piezo1 channel regulation. Notably, Piezo1 knockout mice or adeno-associated virus 9-mediated silencing of ATF3 attenuated ferroptosis in senescent cells and accelerated wound repair. Mechanistically, both genetic and pharmacological inhibition of Piezo1 promoted wound healing in aged tissues and regulated ferroptosis in senescent HUVECs through the CaMKII/ATF3/SLC7A11 pathway. In conclusion, these findings suggest that targeting Piezo1-mediated ferroptosis in senescent HUVECs offers a promising therapeutic approach for improving wound healing in the elderly.


Conflict of interest statement

Competing interests: The authors declare that they have no competing interests.

Figures

Fig. 1.
Fig. 1.
Increased ferroptosis and abnormal accumulation of Piezo1 in aged wounds in vitro and in vivo. (A and B) SA-β-Gal expression and quantification analysis in HUVECs treated with/without Doxo. (C and D) Representative IF images and quantification analysis of p21 in HUVECs treated with/without Doxo. (E) GSH/GSSG ratio was measured in HUVECs treated with/without Doxo. (F) Western blot analysis for ferroptosis biomarkers ACSL4, GPX4, and Piezo1 in HUVECs treated with/without Doxo. (G to J) Representative images of C11-BODIPY staining and MitoTracker staining (red) and TEM images. (K and L) GO and Reactome enrichment analyses show fatty acid metabolism and metabolism of lipids and ROS associated with these DEGs. (M) Western blot analysis for ferroptosis biomarkers ACSL4, 4-HNE, and GPX4 in young and aging groups in mouse wound tissue. (N to P) Representative IF images and quantification analysis of GPX4 and Piezo1 in young and aging groups in mouse wound tissue. (Q to T) Representative IHC images and quantification analysis of GPX4 and Piezo1 in young and aging groups in mouse wound tissue. (U to X) Western blot analysis of Piezo1 in young and aging groups of mouse samples and human samples. * indicates a comparison between the 2 groups. *P < 0.05; **P < 0.01; ***P < 0.001. All data are performed in triplicate and at least 3 times.
Fig. 2.
Fig. 2.
Inhibition of ferroptosis promotes the healing of aging wounds in vivo. (A) Cell viability of HUVECs treated with different concentrations of erastin for 24 h. (B) LDH release of HUVECs treated with different concentrations of erastin for 24 h. (C) Cell viability of HUVECs treated with different concentrations of GsMTx4 with/without erastin for 24 h. (D) LDH release of HUVECs with different treatments for 24 h. (E) Schematic illustration of vitro experiment. (F and G) Western blot analysis for Piezo1 in HUVECs with/without erastin. (H and I) Representative IF images and quantification analysis of Piezo1 in HUVECs with different treatments. (J) GSH/GSSG ratio was measured in HUVECs with different treatments. (K to M) Representative images of C11-BODIPY staining, TEM, and JC-1 staining in HUVECs with different treatments. (N and O) Western blot analysis for ferroptosis biomarkers ACSL4, SLC7A11, FTH, and GPX4 in HUVECs with different treatments. (P and Q) Representative IF images and quantification analysis of ACSL4 in HUVECs with different treatments. *P < 0.05; **P < 0.01; ***P < 0.001. All data are performed in triplicate and at least 3 times.
Fig. 3.
Fig. 3.
Inhibition of Piezo1 alleviates ferroptosis in senescent HUVECs. (A) Cell viability of HUVECs with different treatments for 24 h. (B) LDH release of HUVECs with different treatments for 24 h. (C) GSH/GSSG ratio was measured in HUVECs with different treatments. (D) Schematic illustration of vitro experiment. (E) Representative images of TEM with different treatments. (F) Western blot analysis for ferroptosis and angiogenesis biomarkers ACLS4, GPX4, SLC7A11, FTH, CD31, and VEGF-A in HUVECs with different treatments. (G to I) Representative images of migration assay, tube formation assay, and scratch experiment in HUVECs with different treatments. (J and K) Representative images and quantification analysis of Fluo-4 AM staining in HUVECs with different treatments. (L and M) Western blot analysis for CaMKII in HUVECs with different treatments. (N) Cell viability of HUVECs with different treatments for 24 h. (O) LDH release of HUVECs with different treatments for 24 h. (P) GSH/GSSG ratio was measured in HUVECs with different treatments. (Q to S) Representative images of JC-1 staining, C11-BODIPY staining, and FerroOrange staining in HUVECs with different treatments. (T) Western blot analysis for ferroptosis biomarkers ACSL4, SLC7A11, and GPX4 in HUVECs with different treatments. *P < 0.05; **P < 0.01; ***P < 0.001. All data are performed in triplicate and at least 3 times.
Fig. 4.
Fig. 4.
Inhibition of the Piezo1 channel alleviates ferroptosis in HUVECs via a Ca2+-dependent mechanism. (A) Schematic of in vivo experiment. (B) Wound images during healing and schematic diagram of wound-healing process. (C) Quantitative data of relative wound area to that of day 0 of the 4 groups. (D and E) H&E and Masson staining images on days 3 and 7. (F to H) Representative IHC images of VEGF-A, ATF3, and CaMKII. (I to K) Representative IF images of GPX4, SLC7A11, and α-SMA. (L) Laser Doppler scanned images of subcutaneous vascular flow and blood supply on wounds at days 3 and 7. ***P < 0.001, ns = no significant. All data are performed in triplicate and at least 3 times.
Fig. 5.
Fig. 5.
Blockade of ATF3 protects against ferroptosis in erastin- and Doxo-treated HUVECs. (A) Schematic diagram of RNA sequencing design and sample preparation procedures. (B and C) GSEA shows ferroptosis and lipid metabolism in Doxo group and Doxo + si-Piezo1 group. (D) Venn diagram showing these overlapping genes between 2 clusters (Doxo versus Doxo + si-Piezo1 and Ferroptosis) to obtain the intersection of the 2 DEGs. (E and F) GO and KEGG enrichment analyses showing calcium-mediated signaling, lipid metabolic process, and ferroptosis associated with these DEGs. (G and H) Western blot analysis for n-ATF3 in HUVECs with different treatments. (I and O) Representative IF images and quantification analysis of ATF3. (J to M) Representative images of JC-1 staining, Mito Green, C11-BODIPY staining, and FerroOrange staining in HUVECs with different treatments. (N and P) Western blot analysis for ferroptosis biomarkers ACSL4 and GPX4 in HUVECs with different treatments. (Q) LDH release of HUVECs with different treatments for 24 h. (R) GSH/GSSG ratio was measured in HUVECs with different treatments. ***P < 0.001. All data are performed in triplicate and at least 3 times.
Fig. 6.
Fig. 6.
Activation of Piezo1 by Yoda1 facilitates CaMKII-ATF3 interaction in HUVECs. (A to C) Western blot analysis for n-ATF3, CaMKII, SLC7A11, and GPX4 in HUVECs. (D and E) Representative IF images and quantification analysis of CaMKII and ATF3. (F) Three-dimensional binding structure of CaMKII and ATF3 determined via molecular modeling and docking studies. (G) Close-up view of hydrogen bonding between CaMKII and ATF3. (H) The interaction between CaMKII and ATF3 in HUVECs was analyzed by Co-IP. (I) Schematic diagram of the effects of Doxo and EGTA on the binding between CaMKII and ATF3. ***P < 0.001. All data are performed in triplicate and at least 3 times.
Fig. 7.
Fig. 7.
ATF3 represses SLC7A11 expression by regulating system Xc. (A and B) Western blot analysis for ATF3-OE in HUVECs. (C and D) Representative IF images and quantification analysis of ATF3. (E and F) Western blot analysis for n-ATF3 and ferroptosis biomarkers SLC7A11 and GPX4 in HUVECs with different treatments. (G and H) Western blot analysis for ferroptosis biomarkers SLC7A11 and GPX4 in HUVECs with different treatments. (I) GSH/GSSG ratio was measured in HUVECs with different treatments. (J) Predicted ATF3-binding sites in the promoter region of SLC7A11. (K) A schematic illustration depicts the ATF3 motif within the promoter region of the SLC7A11 locus. (L) Luciferase assays were performed in 293T cell. (M) Schematic presentation of a model whereby ATF3 represses SLC7A11 expression to suppress system Xc, and thereby predisposes cells to a state prone to ferroptosis. (N) The chromatin immunoprecipitation sequencing data previously reported were reanalyzed (GSM1917770, ENCSR632DCH_2, GSM803508, GSM803503). ***P < 0.001. All data are performed in triplicate and at least 3 times.
Fig. 8.
Fig. 8.
The down-expression of ATF3 inhibits ferroptosis through the regulation of the Xc system. (A) Schematic of in vivo experiment. (B and C) Wound images during healing and schematic diagram of wound-healing process. (D) Quantitative data of relative wound area to that of day 0 of the 4 groups. (E and F) H&E and Masson staining images on days 3 and 7. (G) Representative IHC images of VEGF-A. (H to J) Representative IF images of SLC7A11, α-SMA, and 4-HNE. (K) Laser Doppler scanned images of subcutaneous vascular flow and blood supply on wounds at day 3 and 7. ***P < 0.001. All data are performed in triplicate and at least 3 times.
Fig. 9.
Fig. 9.
The deficiency of ATF3 promotes wound healing and angiogenesis in aging mice. Piezo1 up-regulated by calcium ion influx triggers ATF3 nuclear translocation via activation of CaMKII, thus aggravating the accumulation of ROS and lipid peroxidation, and eventually leading to ferroptosis in senescent HUVECs.

References

    1. Gasek NS, Kuchel GA, Kirkland JL, Xu M. Strategies for targeting senescent cells in human disease. Nat. Aging. 2021;1(10):870–879. - PMC - PubMed
    1. Andrade AM, Sun M, Gasek NS, Hargis GR, Sharafieh R, Xu M. Role of senescent cells in cutaneous wound healing. Biology. 2022;11(12). - PMC - PubMed
    1. Carlin AS. Essentials of wound care: Assessing and managing impaired skin integrity. Nurs Stand. 2022;37(10):69–74. - PubMed
    1. Beers EH. Palliative wound care: Less is more. Surg Clin North Am. 2019;99(5):899–919. - PubMed
    1. Wei X, Liu M, Zheng Z, Yu S, Huang L, Ma J, Gao Y, Peng Y, Chen L, Tan R, et al. . Defective NCOA4-dependent ferroptosis in senescent fibroblasts retards diabetic wound healing. Cell death Dis. 2023;9(1):138. - PMC - PubMed

LinkOut - more resources