[Preprint]. 2025 May 14:2025.05.13.25327542.
doi: 10.1101/2025.05.13.25327542.

Quantifying the waning of humoral immunity

Affiliations

Quantifying the waning of humoral immunity

Ananya Saha et al. medRxiv. .

Abstract

Immunological memory is a defining feature of immunity, yet surprisingly there is no consensus on how to quantitatively describe how antibody titers wane over time. A major problem is that the slow waning of antibody titers requires the collection of data for decades post-infection or vaccination. Our analysis of the largest existing dataset shows that a power-law model describes antibody waning better than other frequently used models. Our analysis suggests: (i) Protective levels of antibodies to many vaccine/virus antigens may be maintained for longer than previously estimated. (ii) The rate of waning of antibodies to protein toxoid vaccines such as tetanus may be similar to those elicited by live virus infections. (iii) The long-term waning of antibodies can be estimated from data for a much shorter time-frame of about 1-3 years following immunization, suggesting that using a power-law analysis could allow rapid estimation for the waning of immunity to new vaccines.


Conflict of interest statement

Declaration of Interests The authors declare no competing interests.

Figures

Figure 1:
Figure 1:. Waning of antibodies to tetanus follows a power-law.
We plot the normalized antibody titer (i.e. scaled with respect to the threshold for protection) to tetanus as a function of time after vaccination. Plots for four individuals with the longest timeseries in color. Solid lines are fits to the power-law model, dotted and dashed lines are fits to the simple and bi-phasic exponential models respectively. The gray area demarcates the “early” from “late” phase for the bi-phasic waning model used by earlier studies [8, 13]. Statistical analysis indicates that the power-law model fits substantially better than either exponential model ΔAIC>50 (see Table 1). The solid black line represents the estimated average for the antibody waning for the power-law model.
Figure 2:
Figure 2:. Waning of antibodies to all infections follows a power-law.
The log of normalized antibody titers (scaled with respect to the threshold for protection) declines linearly with the log of time after vaccination or infection. As in Fig 1 we highlight four representative individuals for each infection in color and the black line in each panel represents the average decay. The dashed horizontal line corresponds to the loss of protection.
Figure 3:
Figure 3:. Parameters for the waning of immunity to different viruses and vaccines.
In panel (A) we plot the estimates for the relative magnitude of the response (c2 in eqn 3) compared with the protective titer at t=1. We find considerable variation in the magnitude of the responses to the different antigens at this time. In panel (B) we plot our estimates for the decay parameter m that describes the waning of antibodies to the different viruses and vaccines antigens. We find m is not significantly different for protein vaccines and virus infections.
Figure 4:
Figure 4:. Model projections for time to loss of immunity.
(A) The waning of immunity of individuals to tetanus as predicted by different models. Each individual is shown by a different color for the duration for the duration that the data was collected and extrapolations are shown in gray. The solid lines corresponds to a power-law model and the dashed lines to the bi-phasic model. (B) Predictions for the loss of protection at the population level over time for tetanus. The green line corresponds to the power-law model, the orange yellow line corresponds to the biphasic model and the orchid line corresponds to the simple exponential model. The colored shaded regions are 95% confidence intervals. We see that the power-law model predicts a much longer duration for antibody titer remaining above the threshold of protection than the exponential decay models. (C) Predictions of the models for the loss of protection at the population level over time for diphtheria, vaccinia, and VZV.
Figure 5:
Figure 5:. Summary plot.
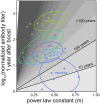
We plot how the magnitude of the response (c2 on the y-axis) and the power-law coefficient (m on the x-axis) determine how long antibody titers stay above the threshold for protection (represented with different scales of gray). Estimates for different individuals for different vaccines are points and the ellipses show 68% CI.
Figure 6:
Figure 6:. Prediction for waning to tetanus from data from year 0 to 3.
We plot the prediction for waning of antibody for the entire timeseries using estimates obtained from data for first 3 years alone (solid lines) vs predictions using the entire timeseries (dotted lines). The black dashed line indicates the threshold for protective levels of antibody.

References

    1. Thucydides T. b. C. R. The Peloponnesian war (Digital Library Project. 2004 Tufts University. ¡http://www.perseus.tufts.edu¿., London, Dent J. M., 1910).
    1. Panum P. Lagttagelser, anstillede under maeslinge-epidemien paa faeroerne i aaret 1846 (observations made during the epidemic of measles on the faroe islands in the year 1846). Archiv fur pathologische Anatomie und Physiologie und fur klinische Medizin 1, 492–512 (1847).
    1. Ahmed R. & Gray D. Immunological memory and protective immunity: understanding their relation. Science 272, 54–60 (1996). - PubMed
    1. Burnet F. The clonal selection theory of acquired immunity (University press, Cambridge, 1959).
    1. Murphy K. M., Weaver C. & Berg L. Janeway’s Immunobiology, 10th edition (Norton, 2022).

Publication types

LinkOut - more resources