[Preprint]. 2025 May 16:2025.05.15.25327513.
doi: 10.1101/2025.05.15.25327513.

Global multi-ancestry genetic study elucidates genes and biological pathways associated with thyroid cancer and benign thyroid diseases

Samantha L White  1 Maizy S Brasher  1 Jack Pattee  2 Wei Zhou  3   4   5 Sinéad Chapman  6 Yon Ho Jee  7 Caitlin C Bell  8 Taylor L Jamil  9 Martin Barrio  10 Jibril Hirbo  11   12 Nancy J Cox  11   12 Peter Straub  13   12 Shinichi Namba  14   15   16 Emily Bertucci-Richter  17 Lindsay Guare  18 Ahmed EdrisMohammed  19 Sam Morris  19 Ashley J Mulford  20 Haoyu Zhang  1 Brian Fennessy  21 Martin D Tobin  22   23 Jing Chen  22 Alexander T Williams  22 Catherine John  22   23 David A van Heel  24 Rohini Mathur  25 Sarah Finer  25 Marta Riise Moksnes  26 Ben Brumpton  26 Bjørn Olav Åsvold  26 Raitis Peculis  27 Vita Rovite  27 Ilze Konrade  28 Ying Wang  29 Kristy Crooks  30 Sameer Chavan  30 Matthew J Fisher  30 Nicholas Rafaels  30 Meng Lin  1 Jonathan Shortt  1   30 Alan R Sanders  20   31 David Whiteman  32 Stuart MacGregor  32 Sarah Medland  32 Unnur Thorsteinsdóttir  33   34 Kári Stefánsson  33   34 Tugce Karaderi  35 Kathleen M Egan  36   37 Therese Bocklage  38   39 Hilary C McCrary  40   41 Greg Riedlingeer  42 Bodour Salhia  43   44 Craig Shriver  45   46 Minh D Phan  47   48 Janice L Farlow  49 Stephen Edge  50   51 Varinder Kaur  52   53 Michelle Churchman  54 Robert J Rounbehler  54 Pamela L Brock  55 Matthew D Ringel  55 Milton Pividori  1 Rebecca Schweppe  8   56 Christopher D Raeburn  10 Robin Walters  19 Zhengming Chen  19 Liming Li  57   58   59 Koichi Matsuda  60   61 Yukinori Okada  14   15   16 Sebastian Zoellner  17 Anurag Verma  18 Michael Preuss  21 Eimear Kenny  21 Audrey Hendricks  1 Lauren Fishbein  8   1   56   62 Peter Kraft  7   63 Mark Daly  29   64   65 Benjamin Neale  29   64   65 biobank at the Colorado Center for Personalized MedicineGenes & Health Research TeamBioBank Japan ProjectAlicia Martin  5   66   67 Joanne B Cole  1   68 Bryan R Haugen  8   56 Christopher R Gignoux  68   1   30   56 Nikita Pozdeyev  1   8   56   30
Affiliations

Global multi-ancestry genetic study elucidates genes and biological pathways associated with thyroid cancer and benign thyroid diseases

Samantha L White et al. medRxiv. .

Abstract

Thyroid diseases are common and highly heritable. Under the Global Biobank Meta-analysis Initiative, we performed a meta-analysis of genome-wide association studies from 19 biobanks for five thyroid diseases: thyroid cancer, benign nodular goiter, Graves' disease, lymphocytic thyroiditis, and primary hypothyroidism. We analyzed genetic association data from ~2.9 million genomes and identified 235 known and 501 novel independent variants significantly linked to thyroid diseases. We discovered genetic correlations between thyroid cancer, benign nodular goiter, and autoimmune thyroid diseases (r 2 =0.21-0.97). Telomere maintenance genes contribute to benign and malignant thyroid nodular disease risk, whereas cell cycle, DNA repair, and DNA damage response genes are predominantly associated with thyroid cancer. We proposed a paradigm explaining genetic predisposition to benign and malignant thyroid nodules. We evaluated thyroid cancer polygenic risk scores (PRS) for clinical applications in thyroid cancer diagnosis. We found PRS associations with thyroid cancer risk features: multifocality, lymph node metastases, and extranodal extension.


Figures

Extended Data Figure 1.
Extended Data Figure 1.. Virtual Thyroid Biopsy Consortium.
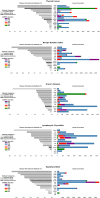
The Consortium aggregated data from 19 biobanks, 10 countries, four continents and ~2.9 million participants.
Extended Data Figure 2.
Thyroid disease meta-analysis case counts and prevalence across biobanks.
Extended Data Figure 3.
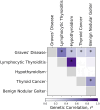
Extended Data Figure 3.. Genetic correlation analysis for thyroid diseases in EUR-like GWAS meta-analysis.
Genetic correlations were estimated using covariate-adjusted LD score regression. The asterisks denote Benjamini-Hochberg false discovery rate (FDR) <0.05.
Extended Data Figure 4.
Extended Data Figure 4.. mRNA expression of thyroid cancer-associated genes in normal thyroid tissue and thyroid cancer.
Genes were identified from ANNOVAR annotations of genome-wide significant variants in thyroid cancer GWAS meta-analysis and FUSION TWAS cis-eQTL analysis. Dark blue color shows genes with high expression in normal thyroid tissue (thyroid is among the top three highest expressing tissues in pan-tissue transcriptome analysis from NCBI Gene database https://www.ncbi.nlm.nih.gov/gene). Significant associations (at Bonferroni-corrected p-value ≤ 9.1e-05, red = positive; light blue = negative) of mRNA expression with high-risk thyroid cancer features such as presence of somatic BRAF V600E mutation, higher ERK score and lower thyroid differentiation score.
Extended Data Figure 5.
Extended Data Figure 5.. Scatterplot of effect sizes of the variants in PTCSC2 locus significantly (p-value < 5e-8) associated with thyroid cancer and benign nodular goiter.
ThC – thyroid cancer. BNG – benign nodular goiter. ρ - Spearman correlation.
Extended Data Figure 6.
Extended Data Figure 6.. Thyroid cancer polygenic risk score (PRSThC vs. BNG) performance by ancestry.
Area under the receiver operating characteristic curve (AUC) and 95% confidence interval are shown for PRSThC vs. BNG developed from the leave-CCPM biobank-out thyroid cancer meta-analysis and tested on CCPM biobank participants of various ancestries. Case and control counts are shown within bars. * - p-value ≤ 0.05; ** - p ≤ 0.01.
Extended Data Figure 7.
Extended Data Figure 7.. Whole genome sequencing data pipeline for the All of Us Research Program data.
Variants (SNPs and indels) from participating biobanks’ GWAS summary data and PGS Catalog were extracted from the Hail variant dataset v7 object.
Extended Data Figure 8.
Extended Data Figure 8.. Variant overlap between GWAS from participating Biobanks.
Data is shown as a fraction of variants that are identical by chromosome, position, reference and alternate allele in harmonized GWAS summary data from two biobanks. The All of Us Research Program GWAS (top row) was performed on whole genome sequencing data and was designed to maximize variant overlap with other biobanks.
Extended Data Figure 9.
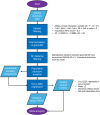
Extended Data Figure 9.. Post-GWAS quality control workflow diagram.
AF – allele frequency. AC – allele count, cov-LDSC – covariate-adjusted LD score regression. QQ plot – quantile-quantile plot.
Extended Data Figure 10.
Extended Data Figure 10.. Correlation of major continental ancestry fractions estimated by Summix2 (y-axis) and published by the Million Veteran Program, Colorado Center for Personalized Medicine and All of Us Research Program Biobanks (x-axis).
Multi-ancestry GWAS summary data was used for this analysis.
Figure 1.
Figure 1.. The study design.
I. The Virtual Thyroid Biopsy Consortium was formed under the Global Biobank Meta-analysis Initiative. Participating biobanks performed genome-wide association studies (GWAS) for five thyroid diseases and GWAS of thyroid cancer vs. benign nodule goiters (ThC vs. BNG). II. Inverse variance-weighted meta-analysis was done after quality-control procedures. Previously known and novel independent genetic associations were identified. Functional inference studies included: III. Genetic correlation analysis with covariate-adjusted LD score regression. IV. Transcriptome-wide association studies (FUSION and S-PrediXcan), V. Pathway (KEGG and Reactome), and gene-expression (The Cancer Genome Atlas and ORIEN Avatar) analyses. VI. Polygenic risk scores were developed for thyroid cancer, benign thyroid diseases, and to distinguish malignant and benign thyroid nodules. VII. Polygenic risk scores were tested for association with thyroid diseases and aggressive thyroid cancer features extracted from clinical charts and surgical histopathology reports.
Figure 2.
Figure 2.. Pleiotropic and phenotype-specific loci associated with thyroid diseases in multi-ancestry GWAS meta-analysis.
The heatmap illustrates the genetic correlation (r2) between thyroid phenotypes, which was estimated using covariate-adjusted LD score regression. The asterisks denote Benjamini-Hochberg false discovery rate (FDR) <0.05. Circular plots highlight loci significantly associated with thyroid cancer and benign nodular goiter (right), and autoimmune thyroid diseases (left). Pleiotropic loci are marked by large purple dots. In the circular plot on the right small dots show loci predominantly associated with thyroid cancer or benign nodular goiter (red or blue respectively). In the circular plot on the left the small red dots depict loci which are significantly associated with Graves’ disease, but not lymphocytic thyroiditis or primary hypothyroidism. For clarity, only loci significantly associated with Graves’ disease are shown on the autoimmune thyroid diseases circular plot. The PTCSC2 (right, yellow) is the only locus inversely associated with thyroid cancer and benign nodular goiter.
Figure 3.
Figure 3.. Thyroid cancer polygenic risk scores.
Two thyroid cancer polygenic risk scores (PRS) were developed: PRSThC vs. All to identify individuals at risk in a population and PRSThC vs. BNG for clinically relevant task of discriminating malignant and benign thyroid nodules. PRS were tested in the Colorado Center for Personalized Medicine Biobank (CCPM) population (n = 94,651) and CCPM data was not used for PRS development. PRSThC vs. All was derived using PRS-CS method. PRSThC vs. BNG was calculated using independent significant associations with thyroid cancer and benign nodular goiter. A. Receiver operating characteristic curves. B. Thyroid cancer risk by PRS decile. C. PRS association with features of aggressive thyroid cancer. * - p-value ≤ 0.05. ** - p-value ≤ 1.7e-3 (Bonferroni-corrected significance threshold).
Figure 4.
Figure 4.. Germline genetic susceptibility to thyroid cancer and benign nodular goiter.
We hypothesize that two biological processes with distinct genetic architecture cause thyroid nodules: 1) hyperplasia, a polyclonal follicular cell proliferation with no malignant potential, and 2) neoplasia, a clonal growth driven by somatic genetic alterations. Neoplastic nodules can be benign or malignant, and the mismatch between biological mechanisms (hyperplasia vs. neoplasia) and GWAS phenotype definitions (benign and malignant thyroid nodules) caused apparent genetic pleiotropy. Pathway and genes associated with benign nodular goiter but not thyroid cancer in GWAS meta-analysis (e.g., insulin-like growth factor 1 [IGF1] and fibroblast growth factor [FGF] signaling pathways) predispose to benign nodules that have no malignant potential (green). Pathways and genes associated with both benign nodular goiter and thyroid cancer (e.g., telomere maintenance) predispose to neoplastic thyroid nodules, benign or malignant (orange). In the absence of other genetic risk factors, patients are more likely to develop benign adenomas or low risk thyroid cancers (blue). Alternatively, genetic alterations in cell cycle and DNA damage response genes (purple, associated predominantly with thyroid cancer but nor benign nodular goiter in GWAS meta-analysis) predispose to high-risk thyroid cancer.

Similar articles

References

    1. Siegel R. L., Giaquinto A. N. & Jemal A. Cancer statistics, 2024. CA Cancer J Clin 74, 12–49 (2024). 10.3322/caac.21820 - DOI - PubMed
    1. Paschou S. A. et al. Thyroid disorders and cardiovascular manifestations: an update. Endocrine 75, 672–683 (2022). 10.1007/s12020-022-02982-4 - DOI - PubMed
    1. Czene K., Lichtenstein P. & Hemminki K. Environmental and heritable causes of cancer among 9.6 million individuals in the Swedish Family-Cancer Database. Int. J. Cancer 99, 260–266 (2002). 10.1002/ijc.10332 - DOI - PubMed
    1. Lin H. T. et al. Familial Aggregation and Heritability of Nonmedullary Thyroid Cancer in an Asian Population: A Nationwide Cohort Study. J. Clin. Endocrinol. Metab. 105 (2020). 10.1210/clinem/dgaa191 - DOI - PubMed
    1. Iglesias M. L. et al. Radiation exposure and thyroid cancer: a review. Arch Endocrinol Metab 61, 180–187 (2017). 10.1590/2359-3997000000257 - DOI - PMC - PubMed

Publication types

LinkOut - more resources