. 2025 May 20:16:1589259.
doi: 10.3389/fgene.2025.1589259. eCollection 2025.

Impact of ITH on PRAD patients and feasibility analysis of the positive correlation gene MYLK2 applied to PRAD treatment

Affiliations

Impact of ITH on PRAD patients and feasibility analysis of the positive correlation gene MYLK2 applied to PRAD treatment

Chuanyu Ma et al. Front Genet. .

Abstract

Introduction: Prostate adenocarcinoma (PRAD) is an extremely widespread site of urological malignancy and is the second most common male cancer in the world. Currently, research progress in immunotherapy for prostate treatment is slower compared to other tumours, which is mainly considered to be caused by the low rate of immune response in prostate cancer as a cold tumour. Recent studies have shown that intra-tumour heterogeneity (ITH) is an important impediment to PRAD immunotherapy. Therefore, we set out to investigate the feasibility of judging patients' disease and knowing the clinical treatment based on the level of ITH.

Methods: Clinical information and transcriptome expression matrices of PRAD samples were gained from The Cancer Genome Atlas (TCGA) database. The ITH-score of PRAD samples was evaluated using the DEPTH algorithm. The optimal cut-off value of RiskScore was calculated based on the difference in survival curves, and PRAD patients were classified into high ITH and low ITH groups based on the optimal cut-off value. Genes with expression differences were screened by differential expression gene analyses (DEGs), and 103 positively correlated differentially expressed genes were identified based on these genes as well as the ITH-score. We conducted multivariate Cox regression to sift for prognostically relevant genes to structure an ITH-related prognostic signature. GO and KEGG pathway enrichment analyses were performed on these 103 positively correlated differentially expressed genes, and the proportion and type of tumour-infiltrating immune cells were assessed by TIMER, CIBERSORT, CIBERSORT-ABS, QUANTISEQ, MCPCOUNTER, XCELL and EPIC algorithms in patients. In addition, we calculated the relevance of immunotherapy and predicted various drugs that might be used for treatment and evaluated the predictive power of survival models under multiple machine learning algorithms through the training set TCGA-PRAD versus the validation set PRAD-FR cohort. Based on the upregulated differential gene and ITH-score correlation ranking, combined with the prognostic performance of the gene, we chose MYLK2 as an elite gene for ITH, and performed cellular experiments to validate it by PCR and WB, as well as CCK8, scratch experiments, and transwell experiments on si-MYLK2 PRAD. Finally, we constructed cox regression models as well as random forest survival models based on the expression levels of SYNPO2L, MYLK2, CKM and MYL3.

Results: We found that lowering the ITH-score resulted in better survival outcomes. We identified 20 highly correlated differentially expressed genes by calculating the correlation coefficient (cor>0.3) between them by DEGs as well as ITH-score, and selected four genes with p-value less than 0.05 (SYNPO2L, MYLK2, CKM and MYL3) by combining with cox regression. Survival analysis based on the differential expression grouping of SYNPO2L, MYLK2, CKM and MYL3 suggested significant survival differences. The results of biofunctional pathway enrichment analysis suggested that the PRAD-ITH gene set had significant expression in the Mucsle Contraction pathway. Macroscopic differences in the immune landscape and differences in responsiveness to immunotherapy existed between ITH-H and ITH-L. The results of the CMap data suggested that NU.1025 was the most likely drug to treat PRAD. The results of our machine learning model constructed based on ITH-score suggest that the random survival forest (RSF) model performs well in both the training and validation sets and has the potential to be used as a clinical prediction model. In vitro experiments verified that MYLK2 plays an important role in the proliferation and migration of PRAD. Our results suggest that the implementation of therapeutic strategies based on key ITH genes may bring new hope for PRAD patients.

Discussion: Our findings indicate that ITH may be an important biomarker for the prognosis and characterisation of PRAD and that the ITH-related gene MYLK2 may serve as a novel target for the treatment of PRAD patients.

Keywords: MYLK2; immunotherapy; intra-tumour heterogeneity (ITH); prognosis; prostate adenocarcinoma (PRAD).


Conflict of interest statement

The authors declare that the research was conducted in the absence of any commercial or financial relationships that could be construed as a potential conflict of interest.

Figures

FIGURE 1
FIGURE 1
(A) Heatmap showing the expression of the 20 DEGs with cor >0.3 in the differential genes of the ITH high and low groups, red: downregulated genes; blue: upregulated genes. Significance levels are indicated by *p < 0.05, **p < 0.01, ***p < 0.005 and ****p < 0.001 (B) Progression-free interval (PFI) survival curves grouped at the median of the ITH-score. (C) PFI survival curves grouped at the optimal cut-off value of the ITH-score. (D) Violin plot demonstrates the data distribution and differences of grouping performed at the best cut-off value of ITH-score. (E) Forest plot demonstrating the existence of a significant effect of four genes, SYNPO2L, MYLK2, CKM, and MYL3, on survival outcome in PRAD (HR taken as log2). (F) Scatter plot demonstrating the correlation coefficients of ITH-score with SYNPO2L, MYLK2, CKM, and MYL3.
FIGURE 2
FIGURE 2
(A-D) PFI survival curves grouped by the median expression of CKM, MYL3, SYNPO2L and MYLK2 in PRAD, respectively.
FIGURE 3
FIGURE 3
Biological functions and mutation profiles of ITH positively correlated DEGs in PRAD. (A) Enrichment results of positively correlated DEGs in PRAD in the BP (Biological Process) section of the GO database. (B) Enrichment results of positively correlated DEGs in PRAD in the CC (Cellular Component) section of the GO database. (C) Enrichment results of positively correlated DEGs in PRAD in the MF (Molecular Function) section of the GO database. (D) Enrichment results of ITH positively correlated DEGs in PRAD in KEGG database. (E) Enrichment results of ITH positively correlated DEGs in PRAD in REACTOME database. The size of each bubble indicates the degree of enrichment, and its position indicates the importance of the disease (pathway) affected by the genetic change. (F) Correlation connectivity plots demonstrating the correlation between the Mucsle Contraction pathway enriched in multiple databases and all the ITH positively correlated genes. (G) Mutation spectrum of TOP10 genes with high mutation rates in PRAD patients under ITH-H/ITH-L subgroup. (H) Mutation spectrum of TOP10 mutation rates of all ITH positively correlated genes in PRAD patients under ITH-H/ITH-L subgroup.
FIGURE 4
FIGURE 4
(A) Immunoheatmap demonstrating the immune landscape under ITH-H and ITH-L grouping, with different coloured regions representing different immune infiltration algorithms (TIMER, CIBERSORT, CIBERSORT− ABS, QUANTISEQ, MCPCOUNTER, XCELL, and EPIC). (B) Balloon plot examining the ITH- correlation between scores and immune cell infiltration. Bubble sizes indicate correlation sizes from 0.1 to 0.4, and colours indicate p-values from 0 to 1. (C) Correlation analysis between ITH-score and gene expression of CTLA-4 as well as PD-L1 therapeutic targets. (D) Scatterplot demonstrating the correlation between B cell plasma and ITH-score. (E) Scatterplot demonstrating the correlation between Cancer associated with the ITH-score.
FIGURE 5
FIGURE 5
(A) Heatmap demonstrating the correlation between the 20 genes expressed between high and low ITH subgroups and the individual immune infiltration components in the X-CELL algorithm. (B) Heatmap demonstrating the prediction of p-values obtained by comparing samples in the ITH-H/ITH-L subgroups by using PD-1 and CTLA4 treatments as well as comparative results of p-values after Bonferroni correction. (C) CMap analysis plot demonstrating the feasibility of various pharmacological treatments for PRAD. (D) Heatmap demonstrating the predictive power of survival models with multiple machine learning algorithms.
FIGURE 6
FIGURE 6
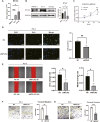
(A) q-PCR showing the comparison of mRNA expression of MYLK2 in PC-3 and LNCap cells with RWPE-1 cells. (B) WB showing the comparison of protein expression of MYLK2 in PC-3 and LNCap cells with RWPE-1 cells. (C) CCK-8 assay showing the proliferative viability of the cells after knocking down MYLK2 compared to the non-knockdown down group in comparison. (D) Cell proliferation is measured by the EdU assay. (E) Wound healing assay showing the migratory ability of PC-3 cells treated with si-NC or si-MYLK2. The comparison of area change and width change between the two groups were statistically significant. (F) Transwell migration assay showing the migration ability PC-3 cells treated with si-NC or si-MYLK2. (G) Transwell invasion assay showing the invasion ability of PC-3 cells treated with si-NC or si-MYLK2. Data are expressed as SD ± mean. *P < 0.05, **P < 0.01, ***P < 0.001.
FIGURE 7
FIGURE 7
(A-D) ITH scores obtained based on the SURVEX package, constructing both the random forest model and the COX regression model of the MOMC‐VM and combining it with machine learning.

References

    1. Adamaki M., Zoumpourlis V. (2021). Prostate Cancer Biomarkers: from diagnosis to prognosis and precision-guided therapeutics. Pharmacol. Ther. 228, 107932. 10.1016/j.pharmthera.2021.107932 - DOI - PubMed
    1. Andor N., Harness J. V., Müller S., Mewes H. W., Petritsch C. (2014). EXPANDS: expanding ploidy and allele frequency on nested subpopulations. Bioinformatics 30 (1), 50–60. 10.1093/bioinformatics/btt622 - DOI - PMC - PubMed
    1. Bertero E., Maack C. (2018). Metabolic remodelling in heart failure. Nat. Rev. Cardiol. 15 (8), 457–470. 10.1038/s41569-018-0044-6 - DOI - PubMed
    1. Carter S. L., Cibulskis K., Helman E., McKenna A., Shen H., Zack T., et al. (2012). Absolute quantification of somatic DNA alterations in human cancer. Nat. Biotechnol. 30 (5), 413–421. 10.1038/nbt.2203 - DOI - PMC - PubMed
    1. Cheuk I. W., Shin V. Y., Siu M. T., Tsang J. Y., Ho J. C., Chen J., et al. (2015). Association of EP2 receptor and SLC19A3 in regulating breast cancer metastasis. Am. J. Cancer Res. 5 (11), 3389–3399. - PMC - PubMed

LinkOut - more resources