. 2025 Jul 18;90(28):9714-9732.
doi: 10.1021/acs.joc.5c00492. Epub 2025 Jun 4.

Twisting, Hydrogen Bonding, Exciplex Formation, and Charge Transfer. What Makes a Bright Fluorophore Not So Bright?

Affiliations

Twisting, Hydrogen Bonding, Exciplex Formation, and Charge Transfer. What Makes a Bright Fluorophore Not So Bright?

Maryann Morales et al. J Org Chem. .

Abstract

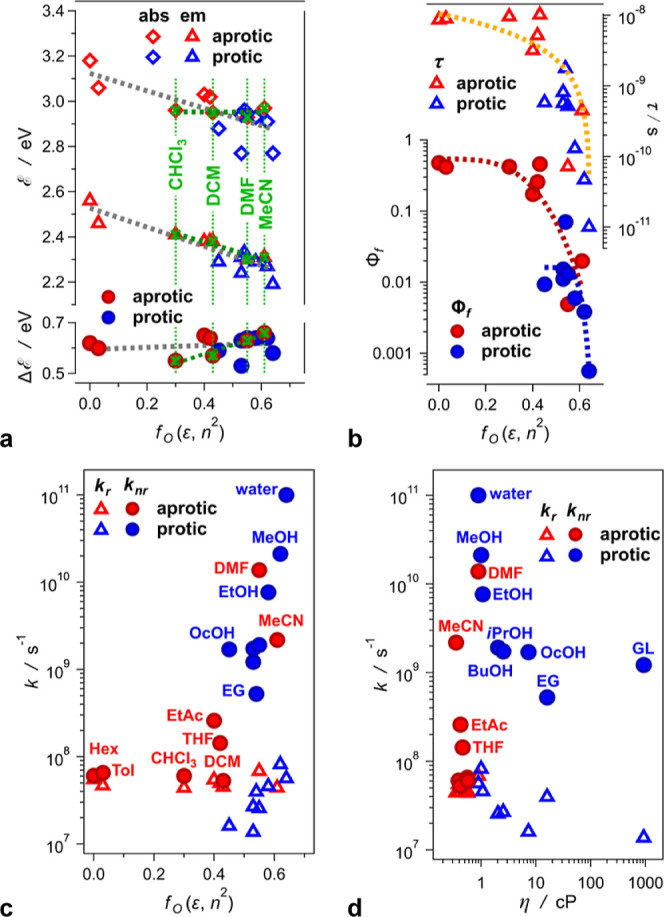
Excited-state charge transfer (CT) and the formation of twisted conformers govern the optical properties of a wide range of dyes. Aminonaphthalimide (ANI) derivatives, popular photosensitizers for blue light, are no exception. The focus herein is on an ANI derivative with an aliphatic amine, which ensures its solubility in a broad variety of solvents including water. Increasing solvent polarity quenches ANI fluorescence because of the expected formation of a dark twisted intramolecular charge-transfer (TICT) state. Contrary to the expectations, however, viscous polar alcohols, which inhibit conformational changes leading to the TICT state, only marginally recover ANI emission. Our analysis reveals that the "solubilizing" aliphatic amine forms an intramolecular exciplex, providing alternative nonradiative deactivation pathways without significant conformational changes and eliminating the viscosity dependence of ANI fluorescence. The findings also show a substantial dependence of ANI photophysics on hydrogen bonding with the solvating media, considerably enhancing the polarity effects. As a result, the fluorescence quantum yield of ANI (exceeding 0.4 in moderately polar solvents) drops below 0.001 when transferred to aqueous media. This feature allows one to showcase the utility of such dyes for imaging bacterial cells, complementing their growing popularity for CT, spintronics, materials, and biomedical applications.


Figures

1
1. Regioisomers of aminonaphthalimides (ANIs).
1
1. Synthesis of ANI-NH2
1
1
Normalized optical absorption, A, and fluorescence, F, spectra of ANI-NH 2 in solvents with different polarity and viscosity (λ ex = 400 nm; and A(λ ex) is kept between 0.1 and 0.2). (a) Optical spectra for selected solvents as recorded, plotted vs wavelength (upper graphs), i.e., A(λ) vs λ and F(λ) vs λ. An example of applying transition-dipole-moment (TDM) corrections to the recorded absorption and fluorescence spectra for hexane (lower graphs) in order to plot them vs energy, E , i.e., A( E ) and F( E ). From the measured spectra, i.e., A(λ) vs λ and F(λ) vs λ, the transition-dipole-moment (TDM) corrections involve not only conversion of the abscissa to energy, i.e., E = h c λ –1 (the top axis of the graph), but also corrections of the absorbance and emission-intensity values considering the following: A( E E = A(λ) and F( E E 5 = F(λ). (b) Corrected optical spectra plotted vs energy, i.e., A( E ) vs E and F( E ) vs E . Aprotic solvents (upper graphs): N,N-dimethylformamide (DMF), acetonitrile (MeCN), ethyl acetate (EtAc), tetrahydrofuran (THF), dichloromethane (DCM), chloroform (CHCl3), toluene (Tol), and n-hexane (Hex). Protic solvents (lower graphs): water pH 7, glycerol (GL), ethylene glycol (EG), methanol (MeOH), ethanol (EtOH), 1-octanol (OcOH), n-butanol (BuOH), and isopropanol (iPrOH).
2
2
Solvent dependence of the photophysical properties of ANI-NH 2 . (a) Dependence of the energy of absorption and emission spectral maxima (Figure b) and of Stokes’ shifts, Δ E , on the Onsager polarity of the solvents, f O(ε, n 2) (Table ). Green markers indicate the aprotic solvents providing plausible conditions for LMO analysis, i.e., linear fit of Δ E vs f O(ε, n 2) for these four solvent yields Δμ 2 r –3 = 0.025 ± 0.04 × 10² Å–1 with R 2 = 0.94, which is in a good agreement with the results obtained for other ANI derivatives. (b) Dependence of the fluorescence quantum yield, Φf, and the lifetime, τ, of the emissive excited state on solvent polarity. (c) Dependence of rate constants of radiative, k r, and nonradiative, k nr, on solvent polarity. (d) Dependence of rate constants of radiative, k r, and nonradiative, k nr, on the dynamic viscosity, η, of the solvents.
3
3
Thermodynamics of photoinduced hole transfer, PHT, from the ANI chromophore core (an electron acceptor, A, and a photosensitizer) to the aliphatic primary amine (an electron donor, D). (a) Dependence of the thermodynamic driving force, −ΔG PHT (0), on the donor–acceptor distance, R DA, for solvents with different polarities, estimated using eq . (b) Dependence of the medium (outer sphere) reorganization energy, λ m, on R DA. ,,−
4
4
Transient-absorption (TA) dynamics of ANI-NH 2 in (a–c) toluene (Tol), (d–f) tetrahydrofuran (THF), (g–i) acetonitrile (MeCN), (j–l) methanol (MeOH), and (m–o) ethylene glycol (EG) (λ ex = 400 nm, 4 μJ per pulse). (a,d,g,j,m) TA spectra recorded at different time delays after the pump, i.e., after the excitation pulse. (b,e,h,k,n) TA kinetic curves recorded at different wavelengths. For all solvents, except Tol, the time is presented in a logarithmic scale to illustrate the picosecond transitions, as well as the slow nanosecond decays. (c,f,i,l,o) Evolution-associated difference spectra (EADS) from multiexponential global-fit (GF) analysis, i.e., ΔA(λ, t) = ΔA (λ) + Σi αi(λ) exp­(− t τ i –1), that yields the following time constants of the depicted transitions, τ i, for the different solvents: (c) τ 1(I→II) = 60 ps, and τ 2(II→ΔA ) = 1.2 ns; (f) τ 1(I→II) = 2.5 ps, τ 2(II→III) = 390 ps, and τ 3(III→S0) = 5.2 ns; (i) τ 1(I→II) = 1.6 ps, τ 2(II→ΔA ) = 450 ps; (l) τ 1(I→II) = 8 ps, τ 2(II→ΔA ) = 47 ps; (o) τ 1(I→II) = 14 ps, τ 2(II→ΔA ) = 90 ps. For solvents where ANI-NH 2 is strongly fluorescent, we introduce the nanosecond lifetimes obtained from time-correlated single-photon counting (TCSPC) to the GF analysis and hold them constant, such as τ3 for THF, while setting ΔA (λ) = 0, i.e., a zero-line spectrum. In this case, the last transition represents a decay to the ground state. Nevertheless, when the TCSPC-obtained lifetimes are considerably longer than the 3 ns TA dynamic rage, such as for toluene (τTCSPC = 8.9 ns, Table ), the GF does not always converge to statistically significant values, which warrants allowing ΔA (λ) to converge to nonzero values.
5
5
DFT and TD-DFT analysis of ANI-NH 2 in n-hexane (Hex), acetonitrile (MeCN), and methanol (MeOH), as implemented at the 6-31+G­(d,p) level of theory. (a) Chemical structure of ANI-NH 2 (Scheme 1), used for the computational analysis. (b,c) Modeled structure of ANI-NH 2 (b) without hydrogen bonding (in implicitly implemented MeCN) and (c) with four MeOH molecules explicitly introduced to form hydrogen bonds with the imide carbonyl oxygens, the aliphatic primary amine, and the aromatic dimethylamino substituent, in implicitly implemented MeOH. The three bonds defining the dihedral angle Ω characterizing the rotation of the dimethylamino moiety are highlighted in cyan. (d,e) Dependence of the energy levels of the S0 and S1 states of ANI-NH 2 on the dihedral angle Ω (d) in implicitly introduced Hex and MeCN and (e) in implicit MeOH medium with and without explicit MeOH molecules hydrogen bonded to the carbonyl oxygens and to the amines. Excited states are explored using TD-DFT. The energy levels of the FC ground states, S0 (FC,i), are obtained via single-point calculations of the corresponding S1 (i) geometries with S0 electronic configurations. The S1 (LE), S1 (E), and S1 (TICT) states are confirmed with frequency calculations as minima on the S1 potential-energy surface. For the S1 (FC) state in all solvents, estimates are obtained via vertical absorption from optimized ground states S0. The red and blue solid straight arrows depict the radiative transitions, i.e., fluorescence and absorption, respectively. The differences between the calculated energies of the S0 and S1 states agree well with the measured absorption and emission spectral maxima (Table ). For Hex, the computed energies of the S0→S1 (FC) and S1 (LE)→S0 (FC,LE) transitions are 3.0 and 2.6 eV, respectively; and the measured absorption and fluorescence maxima are at 3.2 and 2.6 eV, respectively. For MeCN, the computed energies of the S0→S1 (FC) and S1 (LE)→S0 (FC,LE) transitions are 2.8 and 2.5 eV, respectively; and the experimentally obtained absorption and fluorescence maxima are at 3.0 and 2.3 eV, respectively. For MeOH, the computed energies of the S0→S1 (FC) and S1 (LE)→S0 (FC,LE) transitions (with HBs) are 2.9 and 2.4 eV, respectively, and the measured absorption and fluorescence maxima are at 3.0 and 2.4 eV, respectively.
6
6
Natural transition orbitals (NTOs) of ANI-NH 2 in n-hexane, obtained at the APFD/6-31+G­(d,p) level of theory and representing the vertical electronic transitions between different S0 and S1 structures, with occupation numbers of 0.97 or higher.
7
7
Dependence of the optical absorption and fluorescence of ANI-NH2 (40 μM) on the pH of the aqueous medium. (a) Absorption spectra of ANI-NH2 in water solutions containing 10 mM glycine-HCl buffer with pH varying between 1.4 (red) and 3.6 (blue). The gray spectra are recorded at pH values between 1.7 and 3.5. (b) Dependence of the absorbance at 330 and 450 nm (corresponding to the spectral maxima), as well as of the fluorescence quantum yield, on the medium pH as it varies between 1.4 and 3.6. (c) Absorption spectra of ANI-NH2 in water solutions with pH varying between 3 and 10. Inset: pH dependence of the absorbance at the spectral maxima. Ten millimolar glycine-HCl buffer is used for pH ≲4 and 9 ≲pH ≲10; 10 mM phosphate buffer for 5 ≲ pH ≲8.
8
8
Fluorescence staining of Gram-positive and Gram-negative bacteria with ANI-NH2 in aqueous media, 2 mM Tris buffer pH 8.5. (a,b) Fluorescence images of (a) (Gram positive) and (b) (Gram negative) suspended in 80 μM aqueous solution of ANI-NH2 recorded using a FITC filter set. (c,d) Fluorescence spectra of ANI-NH2 (80 μM) in the presence of different amounts of (c) and (d) (λ ex = 400 nm). (e) Dependence of the total emission of ANI-NH2 on the density of bacterial cells. For each sample, the integrated emission is obtained from the area under the curve of its fluorescence spectrum. (f) Dependence of the position of the fluorescence spectral maximum on the density of bacterial cells. The wavelengths of the fluorescence maxima, λ em, are extracted from the recorded emission spectra, i.e., F(λ) vs λ. The energies of the spectral maxima, E em, on the other hand, are extracted from the TDM-corrected emission spectra, i.e., F( E ) vs E (see the caption of Figure ). The conversion from F(λ) to F( E ) changes the shape of the spectra and the wavelength range of the spectral maxima does not match the energy range.

Similar articles

  • Sexual Harassment and Prevention Training.
    Cedeno R, Bohlen J. Cedeno R, et al. 2024 Mar 29. In: StatPearls [Internet]. Treasure Island (FL): StatPearls Publishing; 2025 Jan–. 2024 Mar 29. In: StatPearls [Internet]. Treasure Island (FL): StatPearls Publishing; 2025 Jan–. PMID: 36508513 Free Books & Documents.
  • Short-Term Memory Impairment.
    Cascella M, Al Khalili Y. Cascella M, et al. 2024 Jun 8. In: StatPearls [Internet]. Treasure Island (FL): StatPearls Publishing; 2025 Jan–. 2024 Jun 8. In: StatPearls [Internet]. Treasure Island (FL): StatPearls Publishing; 2025 Jan–. PMID: 31424720 Free Books & Documents.
  • Signs and symptoms to determine if a patient presenting in primary care or hospital outpatient settings has COVID-19.
    Struyf T, Deeks JJ, Dinnes J, Takwoingi Y, Davenport C, Leeflang MM, Spijker R, Hooft L, Emperador D, Domen J, Tans A, Janssens S, Wickramasinghe D, Lannoy V, Horn SRA, Van den Bruel A; Cochrane COVID-19 Diagnostic Test Accuracy Group. Struyf T, et al. Cochrane Database Syst Rev. 2022 May 20;5(5):CD013665. doi: 10.1002/14651858.CD013665.pub3. Cochrane Database Syst Rev. 2022. PMID: 35593186 Free PMC article.
  • Stigma Management Strategies of Autistic Social Media Users.
    Koteyko N, Van Driel M, Billan S, Barros Pena B, Vines J. Koteyko N, et al. Autism Adulthood. 2025 May 28;7(3):273-282. doi: 10.1089/aut.2023.0095. eCollection 2025 Jun. Autism Adulthood. 2025. PMID: 40539215
  • The Black Book of Psychotropic Dosing and Monitoring.
    DeBattista C, Schatzberg AF. DeBattista C, et al. Psychopharmacol Bull. 2024 Jul 8;54(3):8-59. Psychopharmacol Bull. 2024. PMID: 38993656 Free PMC article. Review.

References

    1. Liu T. L., Upadhyayula S., Milkie D. E., Singh V., Wang K., Swinburne I. A., Mosaliganti K. R., Collins Z. M., Hiscock T. W., Shea J.. et al. Observing the cell in its native state: Imaging subcellular dynamics in multicellular organisms. Science. 2018;360:eaaq1392. doi: 10.1126/science.aaq1392. - DOI - PMC - PubMed
    1. Zhao J., Chen J., Ma S., Liu Q., Huang L., Chen X., Lou K., Wang W.. Recent developments in multimodality fluorescence imaging probes. Acta Pharm. Sin. B. 2018;8:320–338. doi: 10.1016/j.apsb.2018.03.010. - DOI - PMC - PubMed
    1. Gao R., Asano S. M., Upadhyayula S., Pisarev I., Milkie D. E., Liu T. L., Singh V., Graves A., Huynh G. H., Zhao Y.. et al. Cortical column and whole-brain imaging with molecular contrast and nanoscale resolution. Science. 2019;363:eaau8302. doi: 10.1126/science.aau8302. - DOI - PMC - PubMed
    1. Lavis L. D., Raines R. T.. Bright Ideas for Chemical Biology. ACS Chem. Biol. 2008;3:142–155. doi: 10.1021/cb700248m. - DOI - PMC - PubMed
    1. Fernandez-Suarez M., Ting A. Y.. Fluorescent probes for super-resolution imaging in living cells. Nat. Rev. Mol. Cell Biol. 2008;9:929–943. doi: 10.1038/nrm2531. - DOI - PubMed

LinkOut - more resources