. 2025 Jun;29(11):e70610.
doi: 10.1111/jcmm.70610.

AMBRA1 Inhibits Non-Small Cell Lung Cancer Progression Through miR-1178/p53/CDK2-Regulated Cell Cycle Arrest

Affiliations

AMBRA1 Inhibits Non-Small Cell Lung Cancer Progression Through miR-1178/p53/CDK2-Regulated Cell Cycle Arrest

Jing Feng et al. J Cell Mol Med. 2025 Jun.

Abstract

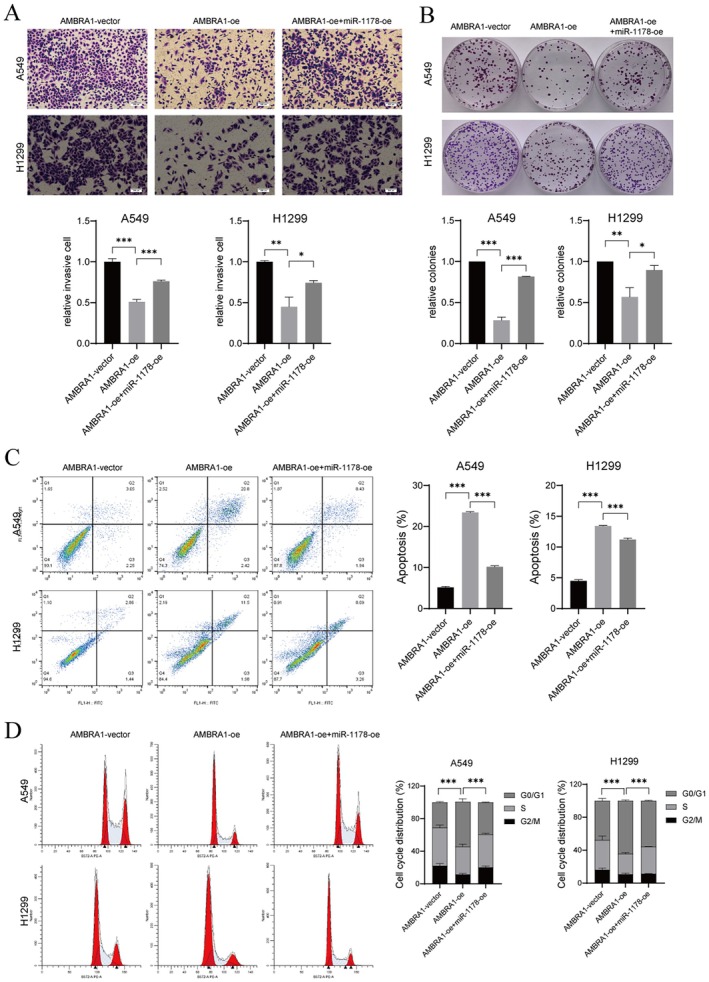
AMBRA1 is associated with a variety of pathological processes in cancer cells, but may have different functions in different tumour microenvironments or genetic backgrounds. In this study, the function and regulatory mechanisms of AMBRA1 were explored in the progression of non-small cell lung cancer (NSCLC). The abnormally expressed miRNAs in AMBRA1-overexpressed and differentially expressed genes in miR-1178-knockdown NSCLC cells were validated by RNA sequencing. Cell viability, proliferation, invasion, apoptosis, and cell cycle were tested through Cell Counting Kit-8 (CCK-8), EdU, colony formation, transwell, and flow cytometry. A mouse tumour xenograft model was conducted to assess the roles of the AMBRA1-miR-1178 axis on NSCLC progression in vivo. AMBRA1 overexpression suppressed NSCLC cell proliferation and invasion, while promoting apoptosis and G0/G1 phase cell cycle arrest in vitro, and inhibited tumour growth in vivo. RNA sequencing revealed miR-1178 as a target of AMBRA1. miR-1178 overexpression partially weakened the suppressive function of AMBRA1 on cell malignant biological behaviours. p53 and CDK2 were confirmed as the downstream targets of miR-1178. Silencing p53 or overexpressing CDK2 reversed the repressive effects of AMBRA1 on the development of NSCLC cells. AMBRA1 may suppress the malignant phenotype of NSCLC cells via regulating the miR-1178-p53-CDK2 signalling pathway.

Keywords: AMBRA1; CDK2; NSCLC; cell cycle; microRNA‐1178; p53.


Conflict of interest statement

The authors declare no conflicts of interest.

Figures

FIGURE 1
FIGURE 1
AMBRA1 overexpression inhibited NSCLC cell proliferation. (A–D) Interference efficiency of two alternative shRNAs targeting AMBRA1 was confirmed by qRT‐PCR and western blot in A549 and H1299 cells. The bar graph on the right shows the quantification of the grey values of the protein bands. (E–H) Overexpression efficiency of AMBRA1‐oe was tested by qRT‐PCR and western blot in A549 and H1299 cells. (I–L) Cell viability and proliferation were tested by CCK‐8 and EdU assays in A549 and H1299 cells transfected with AMBRA1‐shKD or AMBRA1‐oe. The amount of CCK‐8 experimental cells was 2 × 103 cells/well and the amount of EDU experimental cells was 1 × 104 cells/well. Data are representative of three independent experiments (n = 3, mean ± SD). *p < 0.05, **p < 0.01 and ***p < 0.001 versus indicated group or AMBRA1‐vector; #p < 0.05 and ##p < 0.01 versus AMBRA1‐shNC.
FIGURE 2
FIGURE 2
AMBRA1 overexpression suppressed the invasion while increased apoptosis and G0/G1 phase‐cell cycle arrest of NSCLC cells. A549 (A) and H1299 (B) cells transfected with AMBRA1‐shKD or AMBRA1‐oe were seeded into Matrigel‐coated chambers, and cell invasion was tested by transwell assay, and counted in 3 random fields per sample. (C) The number of colonies formed was determined by colony formation assay; for A549 cells, the number of colonies in the AMBRA1‐vector group was 422, in the AMBRA1‐oe was 219, in the AMBRA1‐shNC was 428, and in the AMBRA1‐shKD was 489. As for H1299 cells, the vector group formed 447 colonies, the AMBRA1‐oe formed 198 colonies, the AMBRA1‐shNC formed 421 colonies, and the AMBRA1‐shKD formed 500 colonies. Cells were stained with Annexin V‐FITC/PI and the percentage of apoptotic cells was analysed by flow cytometry (D). Stained with PI (E) and Click‐iT EdU (F) and analysed by flow cytometry. G0/G1, S, and G2/M phase percentages. Results are shown as mean ± SD of three biological replicates. *p < 0.05, **p < 0.01 and ***p < 0.001 versus indicated group.
FIGURE 3
FIGURE 3
AMBRA1 overexpression suppressed NSCLC cell proliferation through down‐regulating miR‐1178. (A) Volcano plots of differentially expressed miRNAs in AMBRA1‐overexpressed H1299 cells. Green points, downregulated miRNAs; red points, upregulated miRNAs in AMBRA1‐overexpressed H1299 cells; black points, miRNAs without significant changes. (B) miR‐1178 level in AMBRA1‐overexpressed or AMBRA1‐knockdown H1299 cells by qRT‐PCR. (C–F) Transfection efficiency of miR‐1178‐siKD and miR‐1178‐oe was verified by qRT‐PCR in A549 and H1299 cells. (G–J) Cell viability and proliferation were tested by CCK‐8 and EdU assays in A549 and H1299 cells co‐transfected with AMBRA1‐oe and miR‐1178‐oe. Results are shown as mean ± SD of three biological replicates. *p < 0.05, **p < 0.01 and ***p < 0.001 versus indicated group or AMBRA1‐vector; #p < 0.05 and ##p < 0.01 versus AMBRA1‐oe group.
FIGURE 4
FIGURE 4
AMBRA1 overexpression inhibited NSCLC cell invasion through decreasing miR‐1178 expression. A549 and H1299 cells were co‐transfected with AMBRA1‐oe and miR‐1178‐oe. (A) cell invasive was tested by transwell assay. (B) colony formation assay was conducted to determine cell proliferation. For A549 cells, the number of colonies in the AMBRA1‐vector group was 376, in the AMBRA1‐oe was 177, and in the AMBRA1‐oe + miR‐1178‐oe was 334. As for H1299 cells, the vector group formed 480 colonies, the AMBRA1‐oe formed 312 colonies, and the AMBRA1‐oe + miR‐1178‐oe formed 435 colonies. The apoptotic cell rate (C) and cell cycle distribution (D) were verified by flow cytometry. Results are shown as mean ± SD of three biological replicates. *p < 0.05, **p < 0.01 and ***p < 0.001 versus indicated group.
FIGURE 5
FIGURE 5
miR‐1178 regulated p53/CDK2 expression in NSCLC cells. (A) Heatmap of DEGs in miR‐1178‐silenced H1299 cells. Green points, downregulated DEGs; red points, upregulated DEGs in miR‐1178‐silenced H1299 cells. (B) Western blot results of DEGs in AMBRA1‐overexpressed H1299 cells. (C) p53 and CDK2 protein expression in miR‐1178‐silenced or miR‐1178‐overexpressed H1299 cells was confirmed by western blot. (D) H1299 cells transfected with miR‐1178‐siKD treated with actinomycin D (ActD) for the indicated periods of time. p53 mRNA levels were analysed by qRT‐PCR. (E–J) The mRNA and protein expression levels of p53 and CDK2 in both A549 cells and H1299 cells transfected with p53‐siKD were detected by qRT‐PCR and western blotting. (K–N) Transfection efficiency of CDK2‐oe was detected by qRT‐PCR and western blot in A549 and H1299 cells. Results are shown as mean ± SD of three biological replicates. **p < 0.01 and ***p < 0.001 versus indicated group.
FIGURE 6
FIGURE 6
AMBRA1 decreased NSCLC cell proliferation and migration through promoting p53 expression and decreasing CDK2 expression. A549 and H1299 cells were co‐transfected with AMBRA1‐oe and p53‐siKD or CDK2‐oe, (A, C) Cell viability was detected by CCK‐8 assay, (B, D) EdU assay was conducted to observe cell proliferation, (E) cell invasiveness was determined by transwell assay, (F) cell colony formation ability was demonstrated with colony formation assays; for A549 cells, the number of colonies in the AMBRA1‐vector group was 469, in the AMBRA‐oe was 105, in the AMBRA1‐oe + P53‐siKD was 403, and in the AMBRA1‐oe + CDK2‐oe was 361. As for H1299 cells, the vector group formed 476 colonies, the AMBRA1‐oe formed 219 colonies, the AMBRA1‐oe + P53‐siKD formed 405 colonies, and the AMBRA1‐oe + CDK2‐oe formed 433 colonies. (G, H) flow cytometry was conducted to determine cell apoptotic rate and cell cycle distribution. Results are shown as mean ± SD of three biological replicates. *p < 0.05, **p < 0.01 and ***p < 0.001 versus indicated group or AMBRA1‐vector; #p < 0.05 and ##p < 0.01 versus AMBRA1‐oe group.
FIGURE 7
FIGURE 7
AMBRA1 inhibited in vivo tumour growth by decreasing miR‐1178 expression. Nude mice were given subcutaneous injections of H1299 cells containing a stable overexpression of AMBRA1 or both AMBRA1 and miR‐1178; tumour volume (A), tumour weight (B) and tumour growth curves (C, D) were measured. (E) Apoptotic cells in tumour tissues were analysed by TUNEL assay. (F) p53 and CycD expression in tumour tissues were confirmed by western blot. Results are shown as mean ± SD of three biological replicates. *p < 0.05, **p < 0.01 and ***p < 0.001 versus indicated group or AMBRA1‐vector; #p < 0.05 and ##p < 0.01 versus AMBRA1‐oe group.

Similar articles

References

    1. Siegel R. L., Miller K. D., Fuchs H. E., and Jemal A., “Cancer Statistics, 2022,” CA: A Cancer Journal for Clinicians 72, no. 1 (2022): 7–33. - PubMed
    1. Zhou B., Zang R., Zhang M., et al., “Worldwide Burden and Epidemiological Trends of Tracheal, Bronchus, and Lung Cancer: A Population‐Based Study,” eBioMedicine 78 (2022): 103951. - PMC - PubMed
    1. Sekihara K., Hishida T., Yoshida J., et al., “Long‐Term Survival Outcome After Postoperative Recurrence of Non‐Small‐Cell Lung Cancer: Who Is ‘cured’ From Postoperative Recurrence?,” European Journal of Cardio‐Thoracic Surgery 52, no. 3 (2017): 522–528. - PubMed
    1. Duma N., Santana‐Davila R., and Molina J. R., “Non‐Small Cell Lung Cancer: Epidemiology, Screening, Diagnosis, and Treatment,” Mayo Clinic Proceedings 94, no. 8 (2019): 1623–1640. - PubMed
    1. Boolell V., Alamgeer M., Watkins D., and Ganju V., “The Evolution of Therapies in Non‐Small Cell Lung Cancer,” Cancers 7, no. 3 (2015): 1815–1846. - PMC - PubMed

MeSH terms