. 2025 Jun;16(3):e13831.
doi: 10.1002/jcsm.13831.

Novel Aptamers Targeting Sclerostin Loop3 Improve Skeletal and Muscle Properties Without Adverse Cardiovascular Effects in Orchiectomized Mice

Affiliations

Novel Aptamers Targeting Sclerostin Loop3 Improve Skeletal and Muscle Properties Without Adverse Cardiovascular Effects in Orchiectomized Mice

Bingna Zhou et al. J Cachexia Sarcopenia Muscle. 2025 Jun.

Abstract

Background: The Wnt/β-catenin pathway and its bone-specific inhibitor, sclerostin, play important roles in skeletal development and homeostasis. The humanized sclerostin antibody, romosozumab, can significantly increase bone mineral density (BMD) of patients with osteoporosis, but it may also increase cardiovascular adverse events, particularly in male patients. We try to investigate the effects of novel aptamers targeting the sclerostin loop3 on the skeleton and muscle of orchiectomized (ORX) mice.

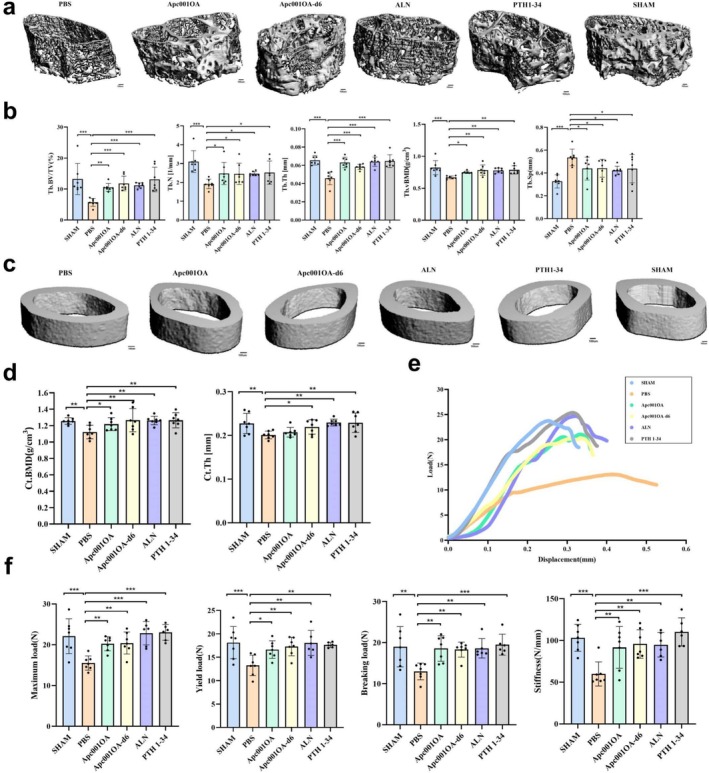
Methods: After 12 weeks of ORX surgery, mice were randomly assigned to receive treatment with sclerostin aptamers (Apc001OA or Apc001OA-d6), alendronate (ALN), teriparatide (PTH 1-34) or phosphate-buffered saline (PBS). After 12 weeks of treatment, skeletal and muscle properties and safety indicators were evaluated in detail.

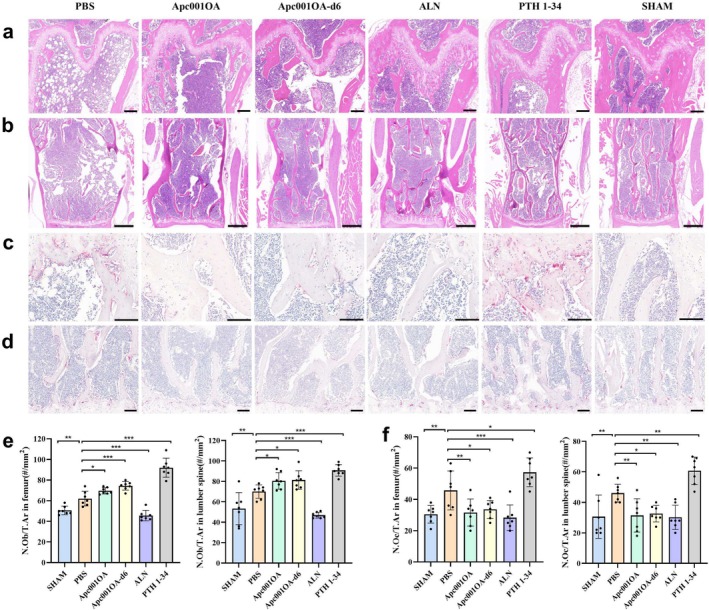
Results: Treatment with Apc001OA and Apc001OA-d6 significantly increased trabecular BMD at the femur by +11.9% and +17.1%, improved parameters of bone microarchitecture (BV/TV by +84.5% and +106.8%), bone strength (maximum load by +30.5% and +31.6%) and bone histological properties (all p < 0.05 vs. PBS group). The therapeutic effects were similar among Apc001OA, Apc001OA-d6, ALN and PTH 1-34 groups (all p > 0.05). After treatment with Apc001OA or Apc001OA-d6, serum sclerostin levels significantly decreased by 25.0% and 24.9% (p < 0.05 vs. PBS group). The expression levels of key genes in the Wnt/β-catenin pathway, Ctnnb1 and Lef1 significantly increased by 2.4- and 3.4-fold in the Apc001OA group and by 2.5- and 3.5-fold in the Apc001OA-d6 group (p < 0.05 vs. PBS group), indicating that the aptamers improved bone properties through activating Wnt/β-catenin pathway. Apc001OA and Apc001OA-d6 significantly improved rotarod latency (p < 0.05 vs. PBS group) of ORX mice, and Apc001OA-d6 could increase forelimb grip strength. Apc001OA, Apc001OA-d6 and PTH 1-34 improved histological properties of muscle in ORX mice. No lesions or pathological changes were observed in the heart, aortic roots, liver, spleen, lungs or kidneys. Immunohistochemistry revealed no abnormal staining of interleukin 6 (IL-6) and tumour necrosis factor-α (TNF-α) in the heart. There was no significant difference in serum concentrations of cardiac functional biomarkers, including creatine kinase-MB (CK-MB), cardiac troponin I (cTnI), B-type natriuretic peptide (BNP) and inflammatory mediators (IL-6 and TNF-α) across all groups, indicating that Apc001OA and Apc001OA-d6 had no adverse cardiovascular effects in ORX mice.

Conclusions: The novel aptamers Apc001OA and Apc001OA-d6, targeting sclerostin loop3, could significantly increase BMD and improve bone microarchitecture, bone biomechanics, muscle function and histological properties of muscle and bone in ORX mice, without adverse cardiovascular effects. These aptamers may serve as potential agents for treating osteoporosis and sarcopenia in men.

Keywords: adverse cardiovascular effects; aptamers; male osteoporosis; sarcopenia; sclerostin loop3.


Conflict of interest statement

The authors declare no conflicts of interest.

Figures

FIGURE 1
FIGURE 1
Schematic diagram of the animal study, characteristics of length, weight and bone turnover biomarkers of mice at euthanasia. (a) Schematic diagram of the animal study. (b) Characteristics of body length, tail length, total length and body weight at euthanasia. *: p < 0.05, **: p < 0.01, ***: p < 0.001 between the two groups. (c) Characteristics of bone turnover biomarkers at euthanasia. *: p < 0.05, **: p < 0.01, ***: p < 0.001 versus PBS group. ALN: alendronate, Apc001OA and Apc001OA‐d6 represent the two groups treated with the two sclerostin aptamers, CTX‐I: the C‐terminal cross‐linking telopeptide of Type I collagen, P1NP: the N‐terminal propeptide of Type 1 procollagen, PBS: phosphate‐buffered saline, PTH 1–34: teriparatide, SHAM: sham, SOST: sclerostin.
FIGURE 2
FIGURE 2
Characteristics of bone microarchitecture properties and bone biomechanical properties of mice at euthanasia. (a) Typical images for trabecular bone microarchitecture of mice after 12 weeks of treatment, Scale bar = 100 μm. (b) Characteristics of trabecular bone microarchitecture properties of mice after 12 weeks of treatment. (c) Typical images for cortical bone microarchitecture of mice after 12 weeks of treatment, Scale bar = 100 μm. (d) Characteristics of cortical bone microarchitecture properties of mice after 12 weeks of treatment. (e) Typical load–displacement curves of mice after 12 weeks of treatment. (f) Characteristics of bone biomechanical properties of mice after 12 weeks of treatment. *: p < 0.05, *: p < 0.01, ***: p < 0.001 versus PBS group. ALN: alendronate, Apc001OA and Apc001OA‐d6 represent the two groups treated with the two sclerostin aptamers, Ct.BMD: cortical bone mineral density, Ct.Th: cortical thickness, PBS: phosphate‐buffered saline, PTH 1–34: teriparatide, SHAM: sham, Tb.BV/TV: trabecular bone volume per total volume, Tb.N: trabecular number, Tb.Sp: trabecular separation, Tb.Th: trabecular thickness, Tb.vBMD: trabecular bone mineral density.
FIGURE 3
FIGURE 3
Characteristics of bone histological properties of mice after 12 weeks of treatment. (a) H&E staining of the left femur of mice after 12 weeks of treatment, Scale bar = 200 μm. (b) H&E staining of the L3–4 of mice after 12 weeks of treatment, Scale bar = 500 μm. (c)TRAP staining of the left femur of mice after 12 weeks of treatment, Scale bar = 100 μm. (d) TRAP staining of the L3–4 of mice after 12 weeks of treatment, Scale bar = 100 μm. (e) Quantitative analysis of osteoblast number relative to tissue area (N.Ob/T.Ar, #/mm2) in femur and lumber spine after 12 weeks of treatment. (f) Quantitative analysis of number of TRAP‐positive osteoclasts related to tissue area (N.Oc/T.Ar, #/mm2) in femur and lumber spine after 12 weeks of treatment. *: p < 0.05, **: p < 0.01, ***: p < 0.001 versus PBS group. ALN: alendronate, Apc001OA and Apc001OA‐d6 represent the two groups treated with the two sclerostin aptamers, H&E: haematoxylin and eosin, N.Ob/T.Ar: osteoblast number relative to tissue area, N.Oc/T.Ar: number of TRAP‐positive osteoclasts related to tissue area, PBS: phosphate‐buffered saline, PTH 1–34: teriparatide, SHAM: sham, TRAP: tartrate resistant acid phosphatase.
FIGURE 4
FIGURE 4
Characteristics of bone histological properties and bone formation rate of mice after 12 weeks of treatment. (a) Von Kossa's staining of the left tibia of mice after 12 weeks of treatment, Scale bar = 1000 μm. (b) Von Kossa's staining of the L1–2 of mice after 12 weeks of treatment, Scale bar = 500 μm. (c) Typical images of unstained and uncalcified tibia showing Ct.MAR of mice after 12 weeks of treatment, Scale bar = 50 μm. (d) Typical images of unstained and uncalcified vertebra of mice showing Tb.MAR after 12 weeks of treatment, Scale bar = 50 μm. (e) Comparison of Ct.MAR of the left tibia of mice after 12 weeks of treatment. (f) Comparison of Tb.MAR of the vertebra of mice after 12 weeks of treatment. *: p < 0.05, **: p < 0.01, ***: p < 0.001 versus PBS group. ALN: alendronate, Apc001OA and Apc001OA‐d6 represent the two groups treated with the two sclerostin aptamers, Ct.MAR: cortical mineral apposition rate, PBS: phosphate‐buffered saline, PTH 1–34: teriparatide, SHAM: sham, Tb.MAR: trabecular mineral apposition rate.
FIGURE 5
FIGURE 5
Relative gene expression in the tibias from mice after 12 weeks of treatment. (a) Relative gene expression of Sp7 versus Gapdh of mice after 12 weeks of treatment. (b) Relative gene expression of Ctnnb1 versus Gapdh of mice after 12 weeks of treatment. (c) Relative gene expression of Lef1 versus Gapdh of mice after 12 weeks of treatment. (d) Relative gene expression of Bglap versus Gapdh of mice after 12 weeks of treatment. (e) Relative gene expression of Runx2 versus Gapdh of mice after 12 weeks of treatment. (f) Relative gene expression of Sost, Lrp5 and Axin1 versus Gapdh of mice after 12 weeks of treatment. *: p < 0.05, **: p < 0.01, ***: p < 0.001 versus PBS group. ALN: alendronate, Apc001OA and Apc001OA‐d6 represent the two groups treated with the two sclerostin aptamers, PBS: phosphate‐buffered saline, PTH 1–34: teriparatide, SHAM: sham.
FIGURE 6
FIGURE 6
Muscular characteristics of the mice during the treatment period. (a) Rotarod test of the mice after 0, 6 and 12 weeks of treatment. *: p < 0.05 versus SHAM group, #: p < 0.05 versus PBS group. (b) Grip strength for forelimbs of the mice after 0, 6 and 12 weeks of treatment. *: p < 0.05 versus SHAM group, #: p < 0.05 versus PBS group. (c) Grip strength for four limbs of the mice after 0, 6 and 12 weeks of treatment. *: p < 0.05 versus SHAM group, #: p < 0.05 versus PBS group. (d) Typical images of H&E staining and cross‐sectional area of the soleus muscle of mice after 12 weeks of treatment, Scale bar = 20 μm, *: p < 0.05, **: p < 0.01, ***: p < 0.001 versus PBS group. (e) The percent of fat mass of the mice after 0, 6, 8 and 12 weeks of treatment. *: p < 0.05 versus SHAM group, #: p < 0.05 versus PBS group. (f) The percent of lean mass of the mice after 0, 6, 8 and 12 weeks of treatment. *: p < 0.05 versus SHAM group, #: p < 0.05 versus PBS group. ALN: alendronate, Apc001OA and Apc001OA‐d6 represent the two groups treated with the two sclerostin aptamers, H&E: haematoxylin and eosin, PBS: phosphate‐buffered saline, PTH 1–34: teriparatide, SHAM: sham.
FIGURE 7
FIGURE 7
Assessment of cardiovascular safety of the treatment. (a) H&E staining of the heart of mice after 12 weeks of treatment, Scale bar = 500 μm. (b) Oil Red O staining of the aortic roots of heart of mice after 12 weeks of treatment, Scale bar = 625 μm. (c) IHC staining of IL‐6 on heart sections of mice after 12 weeks of treatment, Scale bar = 100 μm. (d) IHC staining of TNF‐α on heart sections of mice after 12 weeks of treatment, Scale bar = 100 μm. (e) Serum concentrations of cardiac functional biomarkers of mice after 12 weeks of treatment. (f) Serum levels of inflammatory cytokines of mice after 12 weeks of treatment. ALN: alendronate, Apc001OA and Apc001OA‐d6 represent the two groups treated with the two sclerostin aptamers, BNP: B‐type natriuretic peptide, CK‐MB: creatine kinase‐MB, cTnI: cardiac troponin I, H&E: haematoxylin and eosin, IHC: immunohistochemistry, IL‐6: interleukin 6, PBS: phosphate‐buffered saline, PTH 1–34: teriparatide, SHAM: sham, TNF‐α: tumour necrosis factor‐α.

References

    1. Ensrud K. E. and Crandall C. J., “Osteoporosis,” Annals of Internal Medicine 167 (2017): Itc17–itc32. - PubMed
    1. Vilaca T., Eastell R., and Schini M., “Osteoporosis in Men,” Lancet Diabetes & Endocrinology 10 (2022): 273–283. - PubMed
    1. Sing C. W., Lin T. C., Bartholomew S., et al., “Global Epidemiology of Hip Fractures: Secular Trends in Incidence Rate, Post‐Fracture Treatment, and All‐Cause Mortality,” Journal of Bone and Mineral Research: The Official Journal of the American Society for Bone and Mineral Research 38 (2023): 1064–1075. - PubMed
    1. Bajracharya R., Guralnik J. M., Shardell M. D., et al., “Long‐Term Sex Differences in All‐Cause and Infection‐Specific Mortality Post Hip Fracture,” Journal of the American Geriatrics Society 70 (2022): 2107–2114. - PMC - PubMed
    1. Marini F., Giusti F., Palmini G., and Brandi M. L., “Role of Wnt Signaling and Sclerostin in Bone and as Therapeutic Targets in Skeletal Disorders,” Osteoporosis International 34 (2023): 213–238. - PubMed

Substances