

Effects of combinations of diagnostic and treatment strategies for postpartum haemorrhage: a network meta-analysis
- PMID: 40464263
- PMCID: PMC12135145
- DOI: 10.1002/14651858.CD016259
Effects of combinations of diagnostic and treatment strategies for postpartum haemorrhage: a network meta-analysis
Abstract
Rationale: Postpartum haemorrhage (PPH) is a major cause of maternal mortality worldwide. The combination of accurate diagnosis and effective treatment is necessary to improve outcomes. There is uncertainty about which combination of diagnostic and treatment strategies is most effective.
Objectives: To assess the comparative effectiveness of various combinations of 'diagnostic and treatment' strategies for PPH in women giving birth, and rank them. To explore the relative effects of various diagnostic strategies, when the treatment strategies are the same or similar. To explore the relative effects of various treatment strategies, when the diagnostic strategies are the same or similar.
Search methods: We searched CENTRAL, MEDLINE, Embase, ClinicalTrials.gov, and the World Health Organization International Clinical Trials Registry Platform to 18 October 2024.
Eligibility criteria: Randomised controlled trials or cluster-randomised trials comparing the effects of different combinations of 'diagnostic and treatment' strategies for PPH were eligible. We included studies of women having vaginal or caesarean birth in any setting.
Outcomes: Critical outcomes were: PPH ≥ 500 mL within 24 hours after birth; additional blood loss of ≥ 500 mL following diagnosis of PPH and within 24 hours after birth; PPH ≥ 1000 mL within 24 hours after birth; need for blood transfusion; use of additional uterotonics, and PPH treatment rate. Important outcomes included maternal death.
Risk of bias: We used the Cochrane risk of bias tool (RoB 1).
Synthesis methods: At least two review authors independently assessed trials for inclusion, trustworthiness, risk of bias, and certainty of the evidence using GRADE. We calculated direct and indirect effect estimates, where possible, for critical and important outcomes. Due to limited data, we were unable to perform pairwise meta-analyses and network meta-analyses for the available combinations, or generate rankings.
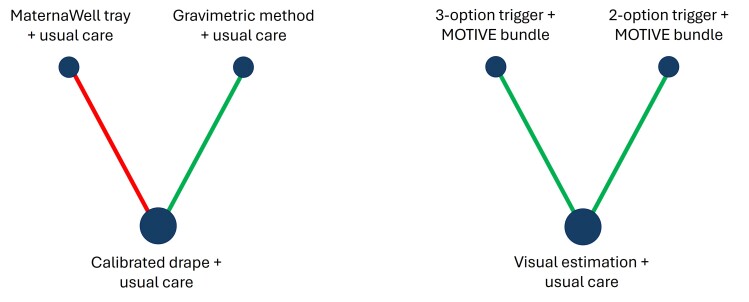
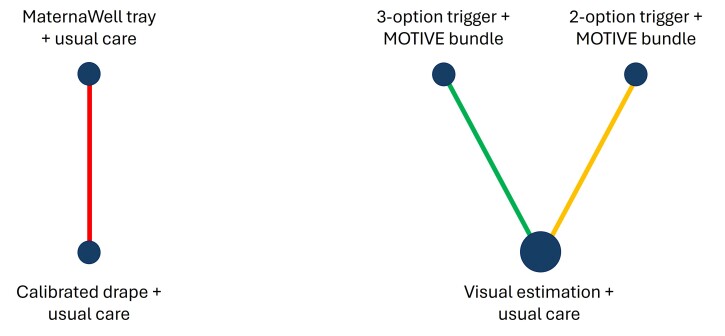
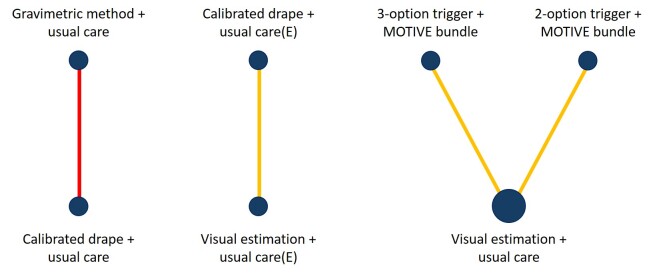
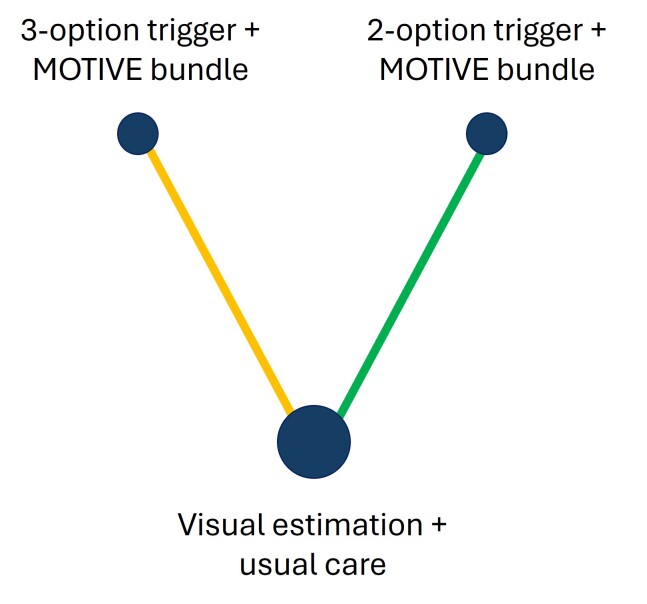
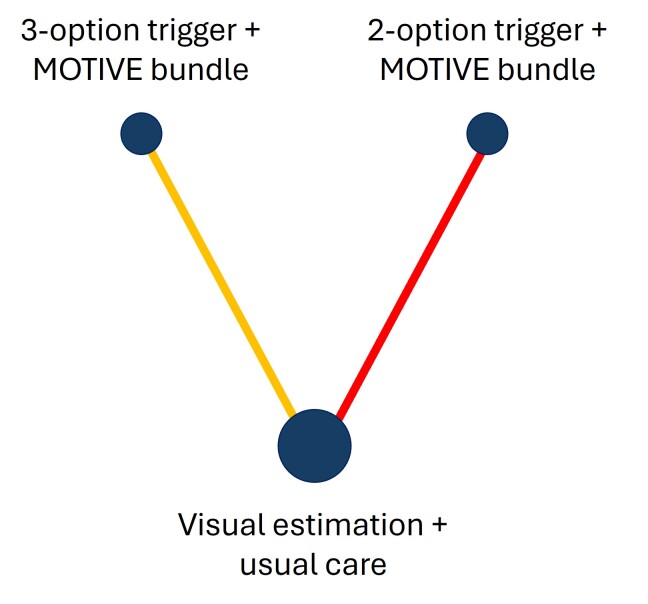
Included studies: We included five trials (10 trial arms, 236,771 women); all included women giving birth vaginally and four had a hospital setting. The combinations of diagnostic and treatment strategies were: visual estimation-based diagnosis plus usual care for treatment; 3-option trigger PPH diagnosis with calibrated drape (1. clinical concern, or 2. blood loss ≥ 300 mL to < 500 mL plus abnormal observations, or 3. blood loss ≥ 500 mL) plus MOTIVE (uterine Massage, Oxytocics, Tranexamic acid, IntraVenous fluids, and Examination and Escalation of care) treatment bundle; 2-option trigger PPH diagnosis with calibrated drape (1. clinical concern, or 2. blood loss ≥ 500 mL) plus MOTIVE treatment bundle; calibrated drape-based diagnosis plus usual care for treatment; gravimetric method-based diagnosis plus usual care for treatment; MaternaWell tray-based diagnosis plus usual care for treatment.
Synthesis of results: 3-option trigger PPH diagnosis plus MOTIVE bundle versus visual estimation-based diagnosis plus usual care (direct evidence; 1 study, 170,956 participants) reduces PPH ≥ 500 mL (RR 0.48, 95% CI 0.39 to 0.58; high-certainty evidence), and PPH ≥ 1000 mL (RR 0.34, 95% CI 0.26 to 0.44; high-certainty). Moderate-certainty evidence suggests it probably makes little or no difference to the need for blood transfusion (RR 0.82, 95% CI 0.62 to 1.08) or additional uterotonics (RR 1.19, 95% CI 0.94 to 1.50), and maternal death (RR 0.73, 95% CI 0.36 to 1.48). 2-option trigger PPH diagnosis plus MOTIVE bundle versus visual estimation-based diagnosis plus usual care (direct evidence; 1 study, 39,176 participants) reduces PPH ≥ 500 mL (RR 0.73, 95% CI 0.60 to 0.89; high-certainty). It probably makes little or no difference to PPH ≥ 1000 mL (RR 0.88, 95% CI 0.69 to 1.12; moderate-certainty), and the need for blood transfusion (RR 1.06, 95% CI 0.55 to 2.04; moderate-certainty), and may make little or no difference to maternal death (RR 1.01, 95% CI 0.00 to 4.0 × 10⁷; low-certainty). High-certainty evidence suggests it increases the need for additional uterotonics (RR 3.54, 95% CI 2.27 to 5.52). 3-option trigger PPH diagnosis plus MOTIVE bundle versus 2-option trigger PPH diagnosis plus MOTIVE bundle (indirect evidence) reduces PPH ≥ 500 mL (RR 0.65, 95% CI 0.49 to 0.86; high-certainty), PPH ≥ 1000 mL (RR 0.38, 95% CI 0.27 to 0.55; high-certainty), and the need for additional uterotonics (RR 0.34, 95% CI 0.20 to 0.55; high-certainty). It probably makes little or no difference to the need for blood transfusion (RR 0.78, 95% CI 0.38 to 1.59; moderate-certainty), and may make little or no difference to maternal death (RR 0.72, 95% CI 0.00 to 2.9 × 10⁷; low-certainty). Calibrated drape-based diagnosis plus usual care (in a European setting (E)) versus visual estimation-based diagnosis plus usual care (E) (direct evidence; 1 study, 25,381 participants) probably makes little or no difference to the need for blood transfusion (RR 0.83, 95% CI 0.57 to 1.21; moderate-certainty). Gravimetric method-based diagnosis plus usual care versus calibrated drape-based diagnosis plus usual care (direct evidence; 1 study, 1195 participants) reduces PPH ≥ 500 mL (RR 0.54, 95% CI 0.32 to 0.90; high-certainty), and may make little or no difference to need for blood transfusion (RR 1.00, 95% CI 0.06 to 15.94; low-certainty). MaternaWell tray-based diagnosis plus usual care versus calibrated drape-based diagnosis plus usual care (direct evidence; 1 study, 63 participants) may make little or no difference to PPH ≥ 500 mL (RR 0.61, 95% CI 0.11 to 3.38; low-certainty), and PPH ≥ 1000 mL (RR 0.30, 95% CI 0.01 to 7.19; low-certainty). Gravimetric method-based diagnosis plus usual care versus MaternaWell tray-based diagnosis plus usual care (indirect evidence) may make little or no difference to PPH ≥ 500 mL (RR 0.89, 95% CI 0.15 to 5.35; low-certainty). No data were available for other critical and important outcomes.
Authors' conclusions: Both 3-option trigger PPH diagnosis plus MOTIVE bundle and 2-option trigger PPH diagnosis plus MOTIVE bundle were more effective than visual estimation-based diagnosis plus usual care (direct evidence). 3-option trigger PPH diagnosis plus MOTIVE bundle was more effective than 2-option trigger PPH diagnosis plus MOTIVE bundle (indirect evidence). As the treatment strategy (MOTIVE bundle) is the same in these combinations, the increased effectiveness is likely due to the 3-option trigger PPH diagnosis, which adds blood loss of ≥ 300 mL to < 500 mL in the drape plus abnormal clinical observations as a PPH diagnostic trigger. None of the comparisons demonstrated differences in blood transfusion or maternal mortality outcomes. Future research should assess the effectiveness of combination diagnostic and treatment strategies in non-hospital settings, and for women having a caesarean birth. Studies should provide more data on side effects, and maternal experience of care.
Funding: Gates Foundation REGISTRATION: PROSPERO (CRD42024600189).
Copyright © 2025 The Authors. Cochrane Database of Systematic Reviews published by John Wiley & Sons, Ltd. on behalf of The Cochrane Collaboration.
Conflict of interest statement
Idnan Yunas: no relevant interests were disclosed.
Malcolm Price: no relevant interests were disclosed.
Kugajeevan Vigneswaran: no relevant interests were disclosed.
Aurelio Tobias: no relevant interests were disclosed.
Adam Devall: no relevant interests were disclosed.
Arri Coomarasamy: Gates Foundation (Grant / Contract).
Figures
Similar articles
-
Uterotonic agents for first-line treatment of postpartum haemorrhage: a network meta-analysis.Cochrane Database Syst Rev. 2020 Nov 24;11(11):CD012754. doi: 10.1002/14651858.CD012754.pub2. Cochrane Database Syst Rev. 2020. PMID: 33232518 Free PMC article.
-
Uterotonic agents for preventing postpartum haemorrhage: a network meta-analysis.Cochrane Database Syst Rev. 2025 Apr 16;4(4):CD011689. doi: 10.1002/14651858.CD011689.pub4. Cochrane Database Syst Rev. 2025. PMID: 40237648 Free PMC article.
-
Tranexamic acid for preventing postpartum haemorrhage after caesarean section.Cochrane Database Syst Rev. 2024 Nov 13;11(11):CD016278. doi: 10.1002/14651858.CD016278. Cochrane Database Syst Rev. 2024. PMID: 39535297 Free PMC article.
-
Cell salvage for the management of postpartum haemorrhage.Cochrane Database Syst Rev. 2024 Dec 20;12(12):CD016120. doi: 10.1002/14651858.CD016120. Cochrane Database Syst Rev. 2024. PMID: 39704317
-
Implementation strategies for WHO guidelines to prevent, detect, and treat postpartum hemorrhage.Cochrane Database Syst Rev. 2025 Feb 26;2(2):CD016223. doi: 10.1002/14651858.CD016223. Cochrane Database Syst Rev. 2025. PMID: 40008632 Free PMC article.
References
-
- Higgins JP, Thomas J, Chandler J, Cumpston M, Li T, Page MJ, et al, editor(s). Cochrane Handbook for Systematic Reviews of Interventions Version 6.4 (updated August 2023). Cochrane, 2023. Available from https://www.training.cochrane.org/handbook.
-
- WHO. WHO recommendations: Uterotonics for the prevention of postpartum haemorrhage. Geneva: Department of Reproductive Health, World Health Organization, 2018. - PubMed
Publication types
MeSH terms
Substances
LinkOut - more resources
Full Text Sources
Research Materials