. 2025 Jul 9;16(7):e0389624.
doi: 10.1128/mbio.03896-24. Epub 2025 Jun 4.

Multi-omics profiling of cross-resistance between ceftazidime-avibactam and meropenem identifies common and strain-specific mechanisms in Pseudomonas aeruginosa clinical isolates

Affiliations

Multi-omics profiling of cross-resistance between ceftazidime-avibactam and meropenem identifies common and strain-specific mechanisms in Pseudomonas aeruginosa clinical isolates

Bartosz J Bartmanski et al. mBio. .

Abstract

Pseudomonas aeruginosa is a highly versatile and resilient pathogen that can infect different tissues and rapidly develop resistance to multiple drugs. Ceftazidime-avibactam (CZA) is an antibiotic often used to treat multidrug-resistant infections; however, the knowledge on the CZA resistance mechanisms in P. aeruginosa is limited. Here, we performed laboratory evolution of eight clinical isolates of P. aeruginosa exposed to either CZA or meropenem (MEM) in sub-inhibitory concentrations and used multi-omics profiling to investigate emerging resistance mechanisms. The majority of strains exposed to MEM developed high resistance (83%, 20/24 strains from eight clinical isolates), with only 17% (4/24) acquiring cross-resistance to CZA. The rate of resistance evolution to CZA was substantially lower (21%, 5/24), while 38% (9/24) acquired cross-resistance to MEM. Whole-genome sequencing revealed strain heterogeneity and different evolutionary paths, with three genes mutated in three or more strains: dacB in CZA-treated strains and oprD and ftsI in MEM-treated strains. Transcriptomic and proteomic analysis underlined heterogeneous strain response to antibiotic treatment with few commonly regulated genes and proteins. To identify genes potentially associated with antibiotic resistance, we built a machine learning model that could separate CZA- and MEM-resistant from sensitive strains based on gene expression and protein abundances. To test some of the identified associations, we performed CRISPR-Cas9 genome editing that demonstrated that mutations in dacB, ampD, and, to a lesser extent, in mexR directly affected CZA resistance. Overall, this study provides novel insights into the strain-specific molecular mechanisms regulating CZA resistance in Pseudomonas aeruginosa.IMPORTANCEPseudomonas aeruginosa is one of the most difficult-to-treat pathogens in the hospital, which often acquires resistance to multiple antibiotics. Ceftazidime-avibactam (CZA) is an essential antibiotic used to treat multidrug-resistant infections, but its resistance mechanisms are not well understood. Here we investigated the evolution of resistance to CZA and meropenem (MEM) in eight clinical bacterial isolates from patients' blood, urine, and sputum. While the rate of resistance evolution to MEM was higher than to CZA, MEM-resistant strains rarely acquired cross-resistance toward CZA. To identify changes at the genome, transcriptome, and proteome levels during antibiotic exposure, we performed multi-omics profiling of the evolved strains and confirmed the effect of several genes on antibiotic resistance with genetic engineering. Altogether, our study provides insights into the molecular response of P. aeruginosa to CZA and MEM and informs therapeutic interventions, suggesting that CZA could still be effective for patients infected with MEM-resistant pathogens.

Keywords: CRISPR/Cas9; Pseudomonas aeruginosa; ceftazidime-avibactam; dacB; genomics; machine learning; meropenem; proteomics; resistance mechanisms; transcriptomics.


Conflict of interest statement

The authors declare no conflict of interest.

Figures

Fig 1
Fig 1
Experimental evolution of antimicrobial resistance to MEM and CZA in clinical isolates. (A) Experimental design. (B) Resistance evolution to MEM and CZA in strains exposed to CZA. (C) Resistance evolution to MEM and CZA in strains exposed to MEM. (D) Percentage of MEM- and CZA-resistant strains (MIC > 8 mg/L) among strains exposed to either MEM or CZA. In panels B and C, the gray horizontal dotted line corresponds to the MIC = 8 mg/L threshold. Boxplots represent median and interquartile range (between the first and the third quartile), while the whiskers extend from the box to the farthest data point lying within 1.5× the interquartile range from the box for n = 24 points (n = 8 strains in triplicate). In panel A, genomesequencer-2 icon by DBCLS (https://togotv.dbcls.jp/en/pics.html) is licensed under CC-BY 4.0 unported (https://creativecommons.org/licenses/by/4.0/). Petri-dish-with-colony-lightyellow icon by Servier (https://smart.servier.com/) is licensed under CC-BY 3.0 unported (https://creativecommons.org/licenses/by/3.0/).
Fig 2
Fig 2
Molecular responses to MEM and CZA exposure across clinical isolates. (A) MIC values for strains exposed to either CZA or MEM after the initial 18 days of passaging and after 24–42 days of passaging. (B) Number of mutations induced by MEM or CZA exposure (depicts the sum of all types of detected mutations, such as SNP, insertion, deletion, and complex rearrangements). (C) Number of differentially expressed genes and differentially abundant proteins induced by MEM or CZA exposure compared to parent strains (PAR) [log2(fold change) ≥ 1, false discovery rate (FDR) ≤ 0.05 determined using Wald test and unpaired two-sided moderated t-test for gene expression and protein abundance, respectively, and adjusted with Benjamini-Hochberg procedure]. (D) GO enrichment analysis of differentially abundant genes and proteins. Color highlights significantly enriched GO terms (FDR ≤ 0.05). For visualization purposes, only GO terms that pass a significance threshold of FDR ≤ 0.001 in at least two strains for transcriptomics or in at least one strain for proteomics are shown.
Fig 3
Fig 3
Molecular signatures of evolved strains are largely specific to the parental strain. (A) PCA plots of normalized transcriptomics and proteomics data for the parent strains and strains evolved in MEM or CZA. (B) Number of differentially expressed transcripts, differentially abundant proteins, or both shared between each number of strains [log2(fold change) ≥ 1, FDR ≤ 0.05 determined using Wald test and unpaired two-sided t-test for gene expression and protein abundance, respectively, and adjusted with Benjamini–Hochberg procedure]. PAR refers to parental strains.
Fig 4
Fig 4
A machine learning model identifies genes and proteins predictive of MEM and CZA resistance. (A) PLS-DA plots for models built for transcriptomics (left) or proteomics (right) data to predict high CZA (top) or MEM (bottom) resistance (threshold at MIC ≥ 32 mg/L). (B) Scheme of the leave-one-strain-out approach to identify genes and proteins predictive of CZA or MEM resistance. (C) Accuracy of the six leave-one-strain-out models on the leave-one-strain-out subset (calculated based on n = 6–9 samples for each left out strain) for each of the omics data types and antibiotics. (D) Number of predictive features selected by one to six of the leave-one-strain-out models (only top 100 features per model were considered for comparison). (E) GO enrichment analysis of features selected by ≥ 5 leave-one-strain-out models. The top 5 GO terms per model are shown sorted by the P-value. Only GO:1901135 passes the FDR ≤ 0.1 threshold.
Fig 5
Fig 5
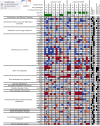
Overview of the antibiotic exposure-associated features identified by different types of analyses. The heatmap depicts transcriptomics log fold changes on the left and proteomics log fold changes on the right within each box for a given strain and gene. Red; upregulated, blue; downregulated. Mutations found for each gene in a given strain are depicted by a circle (non-synonymous SNP), a triangle (synonymous SNP), or a cross (deletion). The top 2 rows show the MIC values for CZA and MEM after the specified number of days. The panels on the right indicate the type of analysis through which each gene was identified (mutations, differential analysis, PLS-DA), and whether the gene was followed up in a CRISPR-Cas9, a transposon mutagenesis assay, or an expression vector cloning assay. Note that due to technical reasons, we removed the MEM-exposed 2C strain from all the analyses.

Similar articles

References

    1. Cabot G, Zamorano L, Moyà B, Juan C, Navas A, Blázquez J, Oliver A. 2016. Evolution of Pseudomonas aeruginosa antimicrobial resistance and fitness under low and high mutation rates. Antimicrob Agents Chemother 60:1767–1778. doi: 10.1128/AAC.02676-15 - DOI - PMC - PubMed
    1. Gellatly SL, Hancock REW. 2013. Pseudomonas aeruginosa: new insights into pathogenesis and host defenses. Pathog Dis 67:159–173. doi: 10.1111/2049-632X.12033 - DOI - PubMed
    1. Pang Z, Raudonis R, Glick BR, Lin TJ, Cheng Z. 2019. Antibiotic resistance in Pseudomonas aeruginosa: mechanisms and alternative therapeutic strategies. Biotechnol Adv 37:177–192. doi: 10.1016/j.biotechadv.2018.11.013 - DOI - PubMed
    1. Carmeli Y, Troillet N, Eliopoulos GM, Samore MH. 1999. Emergence of antibiotic-resistant Pseudomonas aeruginosa: comparison of risks associated with different antipseudomonal agents. Antimicrob Agents Chemother 43:1379–1382. doi: 10.1128/AAC.43.6.1379 - DOI - PMC - PubMed
    1. Cohen NR, Lobritz MA, Collins JJ. 2013. Microbial persistence and the road to drug resistance. Cell Host Microbe 13:632–642. doi: 10.1016/j.chom.2013.05.009 - DOI - PMC - PubMed

MeSH terms