. 2025 Aug 4;224(8):e202411078.
doi: 10.1083/jcb.202411078. Epub 2025 Jun 4.

The reaction mechanism for glycolysis side product degradation by Parkinson's disease-linked DJ-1

Affiliations

The reaction mechanism for glycolysis side product degradation by Parkinson's disease-linked DJ-1

Aiko Watanabe et al. J Cell Biol. .

Abstract

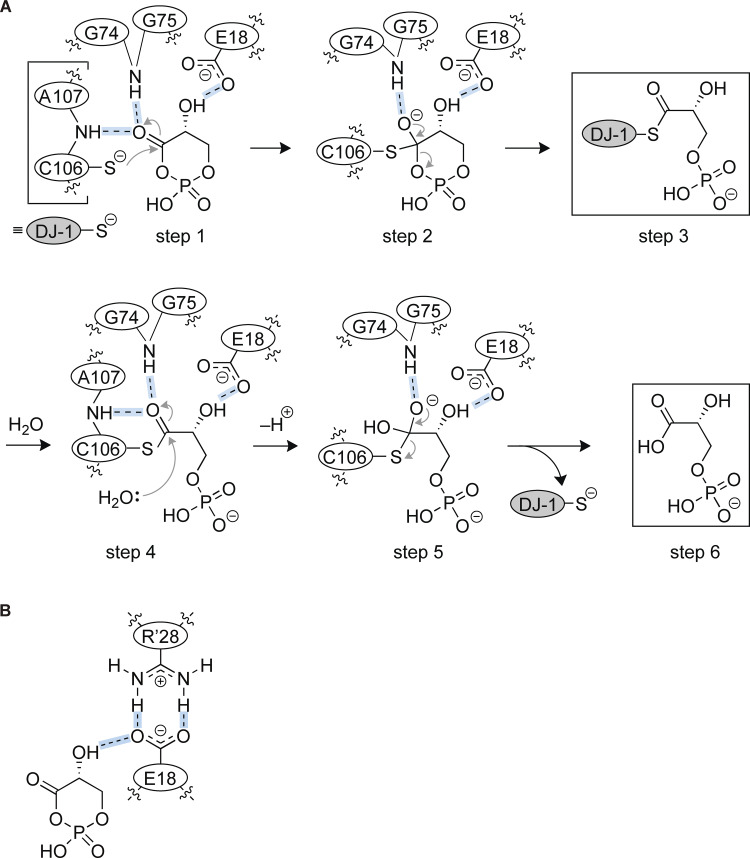
DJ-1/PARK7 is the causative gene for hereditary recessive Parkinson's disease. Recent studies have reported that DJ-1 hydrolyzes cyclic 3-phosphoglyceric anhydride (cPGA), a highly reactive metabolite. However, the molecular mechanisms underlying cPGA hydrolase activity have yet to be fully elucidated. To gain a more comprehensive understanding of this activity in DJ-1, we performed molecular simulations that predicted how DJ-1 recognizes and hydrolyzes cPGA. The accuracy of these structural predictions was validated through systematic mutational analyses exemplified by loss of activity with the A107P mutation. Although DJ-1 possesses both cPGA hydrolase and α-oxoaldehyde hydratase activities in vitro, we confirmed that DJ-1 dysfunction caused an increase in cPGA-derived modifications but had no effect on α-oxoaldehyde-derived modifications in cells. Importantly, A107 and P158, pathogenic missense mutation sites found in Parkinson's disease patients, are critical for cPGA hydrolysis both in vitro and in cells. The evidence-based catalytic mechanism for DJ-1 hydrolysis of cPGA that we propose here explains their pathophysiological significance.


Conflict of interest statement

Disclosures: The authors declare no competing interests exist.

Figures

Figure 1.
Figure 1.
cPGA hydrolase activity is present in YajL but not the other prokaryotic DJ-1 homologs. (A) Reaction mechanism for DJ-1 hydrolase conversion of cPGA to 3PG. Since Abs235 indicates thioester formation following cPGA reaction with N-acetyl-L-cysteine (NAC), cPGA consumption by DJ-1 can be monitored by a reduction in Abs235. (B) cPGA hydrolase activity was not observed in YhbO, ElbB, or HchA but was present in YajL. cPGA was incubated with DJ-1, YajL, YhbO, ElbB, or HchA for 3 min, followed by reaction with NAC. A reduction in Abs235 is indicative of cPGA hydrolase activity (n = 3). (C) Absorbance spectra of reaction mixtures containing cPGA and WT DJ-1 (blue), YajL (pink), YhbO (light blue), ElbB (orange), or HchA (green) followed by incubation with NAC. The black line corresponds to buffer alone. (D) Phenylglyoxalase activities of YhbO (light blue) and HchA (orange). The PGO-derived Abs250 decreased following incubation with YhbO or HchA. The black line corresponds to buffer alone. (E) The ElbB thermal shift melt curve confirmed that the enzyme was correctly folded. The black line corresponds to buffer alone. (F and G) A decrease in Abs235 is indicative of cPGA consumption following incubation for 3 min with WT or the C106S mutant of DJ-1 (F) or YajL (G) (all n = 3). Data shown in C–E are representative of three individual experiments. Data in B, F, and G are the mean ± SD of three experiments. *P < 0.05 using one-way ANOVA with Dunnett’s multiple comparisons test (B, F, and G). RFU, relative fluorescence unit.
Figure 2.
Figure 2.
Molecular simulation of DJ-1 and YajL complexed with cPGA. (A) Molecular model of how cPGA (orange) is recognized by DJ-1. The DJ-1–cPGA complex (left) and the initial structural template of DJ-1 (right) conjugated with the covalent inhibitor 1-ethylindole-2,3-dione (gray) are shown in parallel. (B) DJ-1–cPGA complex. Amino acids in DJ-1 (E15, E18, G74, G75, N76, C106, A107, H126, and P158) that contact cPGA (orange) are highlighted as is R48, which forms a salt bridge with E15, and R28 from another protomer in the DJ-1 dimer forms a salt bridge with E18. (C) Magnified view of the DJ-1 and cPGA-binding site. (D) Molecular model of YajL complexed with cPGA. Amino acids (E14, E17, G74, G75, I76, C106, A107, F127, and P158) that form the cPGA-binding pocket are highlighted as is R27, which forms a salt bridge with E17. R27 is derived from another protomer. (E) Magnified view of the YajL and cPGA-binding site.
Figure 3.
Figure 3.
Dimeric structures of ElbB, HchA, and YhbO weaken cPGA binding. (A) Overlaid image of the DJ-1 or YajL molecular model complexed with cPGA. Magnified view shows the cPGA-binding site (orange) with the surface structure of DJ-1 (gray) and YajL (blue). (B) Molecular model of the cPGA-binding site in ElbB (blue). The helix-forming residues of ElbB that interfere with cPGA binding are highlighted in red. (C) Molecular model of the HchA–cPGA complex with a magnified view. (D) Overlaid image of DJ-1 or YhbO complexed with cPGA. Magnified view shows the surface structure of YhbO in proximity to the cPGA-binding site.
Figure 4.
Figure 4.
The catalytically critical E18 is stringently regulated by R28. (A) Distance plot of residues that form the cPGA-binding site in DJ-1 based on the unstrained 50-ns MD simulation. (B) Absorbance spectra of reaction mixtures containing cPGA and WT (blue), E18A (light blue), E18Q (pink), or R28A (orange) DJ-1. Initial reactions were incubated for 3 min, and then N-acetyl-L-cysteine (NAC) was added. The thioester peak at Abs23 decreases if the DJ-1 mutants can hydrolyze cPGA. The black line corresponds to buffer alone. (C) The cPGA hydrolytic activity of WT, E18A, E18Q, or R28A DJ-1 was monitored by a decrease in Abs235 (all n = 3). (D) Absorbance spectra are as in B following incubation with WT (blue), E15A (light blue), or R48A (orange) DJ-1. (E) The cPGA hydrolytic activity of WT, E15A, or R48A DJ-1 was monitored by a decrease in Abs235 (all n = 3). (F and G) Thermal shift denaturation curves of WT (blue), E15A (light blue), E18A (orange), E18Q (red), or R28A (green) DJ-1. Representative relative fluorescence unit (RFU) (F) and positive derivative [d(RFU)/dT] curves with melting temperatures (Tm) (G) are shown. The black line indicates the buffer control. (H) Distance plot of residues that form the cPGA-binding site in YajL based on the unstrained 50-ns MD simulation. (I) The cPGA hydrolytic activity of WT or the indicated YajL mutants was monitored by a decrease in Abs235 (all n = 3). Data shown in B, D, F, and G are representative of three individual experiments. Data in C, E, and I are the mean ± SD of three experiments. *P < 0.05 using one-way ANOVA with Dunnett’s multiple comparisons test (C, E, and I).
Figure 5.
Figure 5.
G74–G75 comprise an oxyanion hole that supports formation of the substrate–enzyme intermediate connected via C106. (A) Structural model depicting hydrogen bond formation of G74–G75 and A107 with the cPGA carbonyl group. (B) Absorbance spectra when cPGA was incubated with WT (blue), C106S (light blue), A107H (pink), A107I (orange), or A107P (green) DJ-1. Initial reactions were incubated for 3 min, and then N-acetyl-L-cysteine (NAC) was added. The black line indicates the buffer control. (C) The cPGA hydrolytic activity of the indicated DJ-1 mutants was monitored by a decrease in Abs235 (all n = 3). (D) Absorbance spectra showing consumption of cPGA by WT (blue), G74S (light blue), or G75S (orange) DJ-1 mutants. (E) The cPGA hydrolytic activity of the indicated DJ-1 mutants was monitored by a decrease in Abs235 (all n = 3). (F and G) Thermal shift denaturation curves of WT (blue), G74S (light blue), G75S (orange), C106S (green), or A107P (red) DJ-1. Representative relative fluorescence unit (RFU) (F) and positive derivative [d(RFU)/dT] curves with melting temperatures (Tm) (G) are shown. The black line indicates the buffer control. (H and I) cPGA consumption by WT YajL or the indicated YajL mutants was monitored as in C and E (all n = 3). Data shown in B, D, F, and G are representative of three individual experiments. The mean ± SD of three experiments is shown in C, E, H, and I. *P < 0.05 using one-way ANOVA with Dunnett’s multiple comparisons test (C, E, H, and I).
Figure 6.
Figure 6.
P158 in DJ-1 is essential for cPGA hydrolase activity. (A) The positional relationship of cPGA with N76, H126, and P158 in the DJ-1–cPGA molecular model. (B) The cPGA hydrolytic activity of the N76W and H126A mutants was monitored by a decrease in Abs235 (all n = 3). (C) Sequence alignment between human DJ-1 and E. coli YajL. DJ-1 N76 and H126 correspond to I76 and F127 in YajL (shown in red font). Identical and conserved amino acids are shown in black and blue boxes, respectively. (D) The cPGA hydrolytic activity of WT, P158A, or P158∆ DJ-1 was monitored by a decrease in Abs235 (all n = 3). (E and F) The folding stability of WT (blue), P158A (light blue), or P158∆ (orange) DJ-1 was measured using a protein thermal shift assay. Representative relative fluorescence unit (RFU) (E) and positive derivative [d(RFU)/dT] curves with melting temperatures (Tm) (F) are shown. The black line indicates the buffer control. (G) The cPGA hydrolytic activity of WT, P158A, and P158∆ YajL was monitored by a decrease in Abs235 (all n = 3). Data in B, D, and G are the mean ± SD of three experiments. *P < 0.05 using one-way ANOVA with Dunnett’s multiple comparisons test (B, D, and G).
Figure 7.
Figure 7.
Proposed reaction mechanism for DJ-1–mediated cPGA hydrolysis. (A) The reaction is initiated following the formation of hydrogen bonds between the substrate (cPGA) and E18, G74–75, and A107 in the DJ-1 active site (step 1). Attack of C106 on the carbonyl carbon yields the first tetrahedral intermediate that is stabilized by the oxyanion hole comprised by G74 and G75 (step 2). Reformation of the carbon-oxygen double bond leads to formation of the acyl enzyme intermediate via a thioester linkage (step 3). Water then attacks the carbonyl carbon of the acyl enzyme (step 4) to form the second tetrahedral intermediate, which is similarly stabilized by the oxyanion hole as in step 2 (step 5). Lastly, reformation of the carbon-oxygen double bond restores the free enzyme and releases the 3PG product (step 6). (B) Schematic diagram showing how E18 interacts with cPGA. Hydrogen bond formation between E18 and the cPGA hydroxyl group is assisted by the intermolecular salt bridge formed with R28.
Figure 8.
Figure 8.
Endogenous DJ-1 suppressed cPGA modification in cell lysates. (A) Lysates of WT, DJ-1 KO, or DJ-1 KO SH-SY5Y cells expressing exogenous DJ-1 (WT or the indicated mutants) were treated with 1 mM cPGA and then phospho-glyceroyl modifications were detected by Phos-tag SDS-PAGE. The cells without exogenous DJ-1 expression are denoted as “none.” (B) WT or DJ-1 KO HeLa cells stably expressing pSu9-Halo-mGFP and Parkin were pulse labeled with Halo ligand, followed by treatment with antimycin A and oligomycin (AO) for the indicated times, and then immunoblotted. A Haloligand band (black arrowhead) appeared in a time-dependent manner in both WT and DJ-1 KO cells following AO treatment. The gray arrowhead indicates ∼40-kDa bands that are likely a cleavage product of the HaloTag construct generated during GFP chromophore formation. All blots are representative of at least two independent experiments. Source data are available for this figure: SourceData F8.
Figure S1.
Figure S1.
Quantification of DJ-1 methylglyoxalase and cPGA hydrolase activities. (A and B) Initial velocities of 15 mM MGO-derived hemithioacetal consumption when incubated with 10 µM DJ-1. A288 increases following hemithioacetal formation from MGO and N-acetyl-cysteine. kcat was estimated as Vmax divided by [E]0, and Vmax for methylglyoxalase was determined by monitoring A288 changes during hemithioacetal turnover using various substrate concentrations and fitting initial velocities to a Michaelis–Menten plot. (C and D) Initial velocities of cPGA-derived hemithioacetal consumption when 4 mM cPGA was incubated with 10 nM DJ-1. For cPGA hydrolysis, substrate consumption was similarly monitored as A235 increases following hemithioacetal formation from cPGA and N-acetyl-cysteine. A235 changes was monitored under substrate-excess conditions, and initial velocity (V0) was calculated from the linear decrease in A235, corrected for spontaneous decay. kcat was estimated as V0 divided by [E]0.
Figure 9.
Figure 9.
Loss of endogenous DJ-1 had no effect on α-oxoaldehyde modifications but increased phospho-glyceroyl modifications. (A) Cell lysates from WT, DJ-1 KO, or DJ-1 KO HeLa cells expressing exogenous WT DJ-1 were supplemented with cPGA. Phospho-glyceroyl modifications were analyzed by Phos-tag SDS-PAGE, followed by immunoblotting with an anti-GAPDH antibody. (B) The same lysates were treated with 2 mM MGO and immunoblotted with an anti-MGO antibody. The cells without exogenous DJ-1 expression are denoted as none. Blots are representative of at least two independent experiments (A and B). (C) Schematic overview of the experimental setup to assess the phosphoglycerate and α-oxoaldehyde modifications. (D) Volcano plot of the log2 fold change in 3-phosphoglyceroyl lysine peptide and the log10 of the P values (Student’s t test). Peptides with 3-phosphoglyceroyl lysine that significantly increased or decreased in DJ-1 KO cells compared with WT cells (log2 fold change > 1 or log2 fold change less-than −1, P < 0.05) are shown in red (increase) and blue (decrease) circles, respectively. Mean fold changes and P values were calculated from three biological replicates (n = 3). (E) Volcano plot for CML and CEL peptides prepared as in D. (F) Abundance of CEL peptides in WT cells following treatment with MGO. Box plots show the distribution of values. Blue dots indicate individual data points, while gray dots represent outliers (n = 2). (G) Abundance of CML peptides in WT cells treated with glyoxal. Plots were drawn as in F (n = 2). Source data are available for this figure: SourceData F9.

References

    1. Abdallah, J., Mihoub M., Gautier V., and Richarme G.. 2016. The DJ-1 superfamily members YhbO and YajL from Escherichia coli repair proteins from glycation by methylglyoxal and glyoxal. Biochem. Biophys. Res. Commun. 470:282–286. 10.1016/j.bbrc.2016.01.068 - DOI - PubMed
    1. Akhmadi, A., Yeskendir A., Dey N., Mussakhmetov A., Shatkenova Z., Kulyyassov A., Andreeva A., and Utepbergenov D.. 2024. DJ-1 protects proteins from acylation by catalyzing the hydrolysis of highly reactive cyclic 3-phosphoglyceric anhydride. Nat. Commun. 15:2004. 10.1038/s41467-024-46391-9 - DOI - PMC - PubMed
    1. Andreeva, A., Bekkhozhin Z., Omertassova N., Baizhumanov T., Yeltay G., Akhmetali M., Toibazar D., and Utepbergenov D.. 2019. The apparent deglycase activity of DJ-1 results from the conversion of free methylglyoxal present in fast equilibrium with hemithioacetals and hemiaminals. J. Biol. Chem. 294:18863–18872. 10.1074/jbc.RA119.011237 - DOI - PMC - PubMed
    1. Badger, J., Sauder J.M., Adams J.M., Antonysamy S., Bain K., Bergseid M.G., Buchanan S.G., Buchanan M.D., Batiyenko Y., Christopher J.A., et al. 2005. Structural analysis of a set of proteins resulting from a bacterial genomics project. Proteins. 60:787–796. 10.1002/prot.20541 - DOI - PubMed
    1. Berendsen, H.J.C., Postma J.P.M., Vangunsteren W.F., Dinola A., and Haak J.R.. 1984. Molecular-dynamics with coupling to an external bath. J. Chem. Phys. 81:3684–3690. 10.1063/1.448118 - DOI

Substances