. 2025 Jun 6;11(23):eadv4033.
doi: 10.1126/sciadv.adv4033. Epub 2025 Jun 4.

Inhibition of virally induced TFEB proteasomal degradation as a host-centric therapeutic approach for coronaviral infection

Affiliations

Inhibition of virally induced TFEB proteasomal degradation as a host-centric therapeutic approach for coronaviral infection

Travis B Lear et al. Sci Adv. .

Abstract

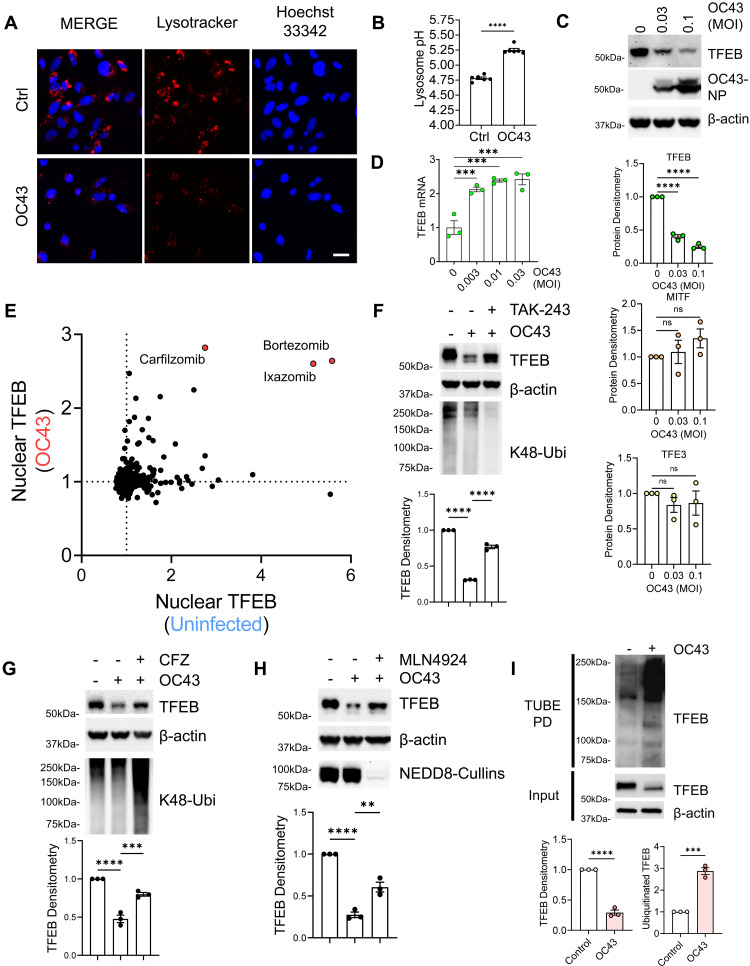
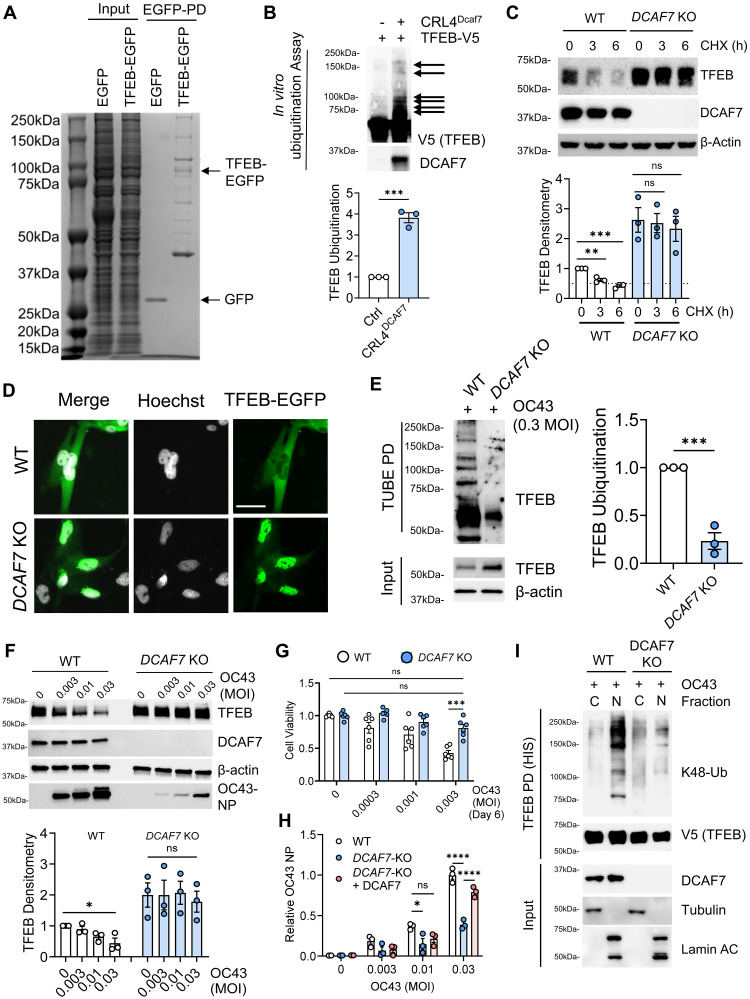
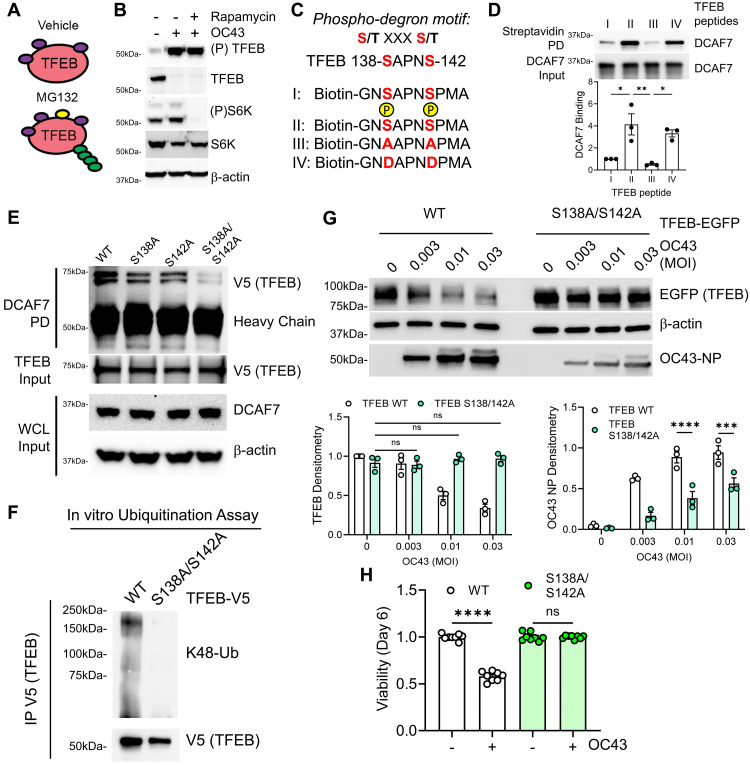
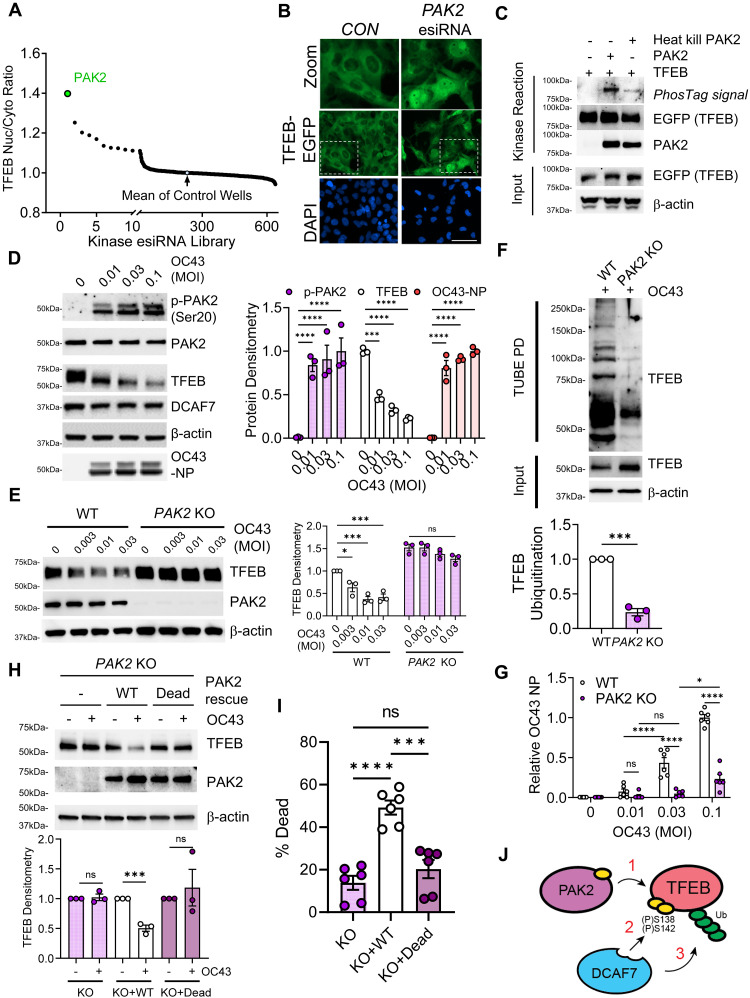
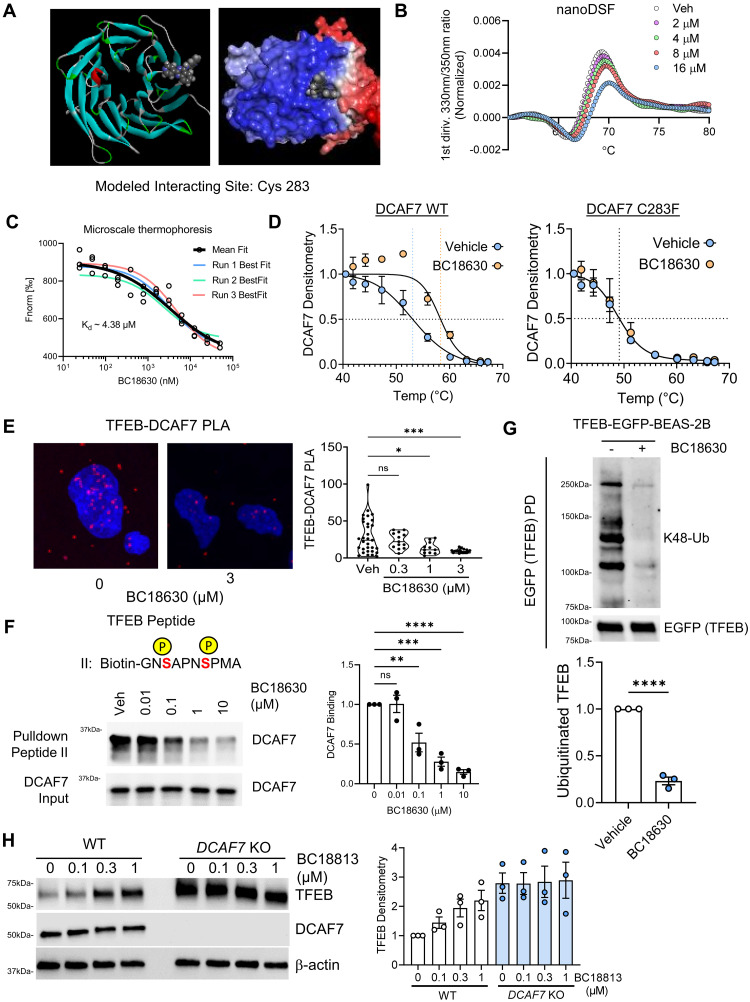
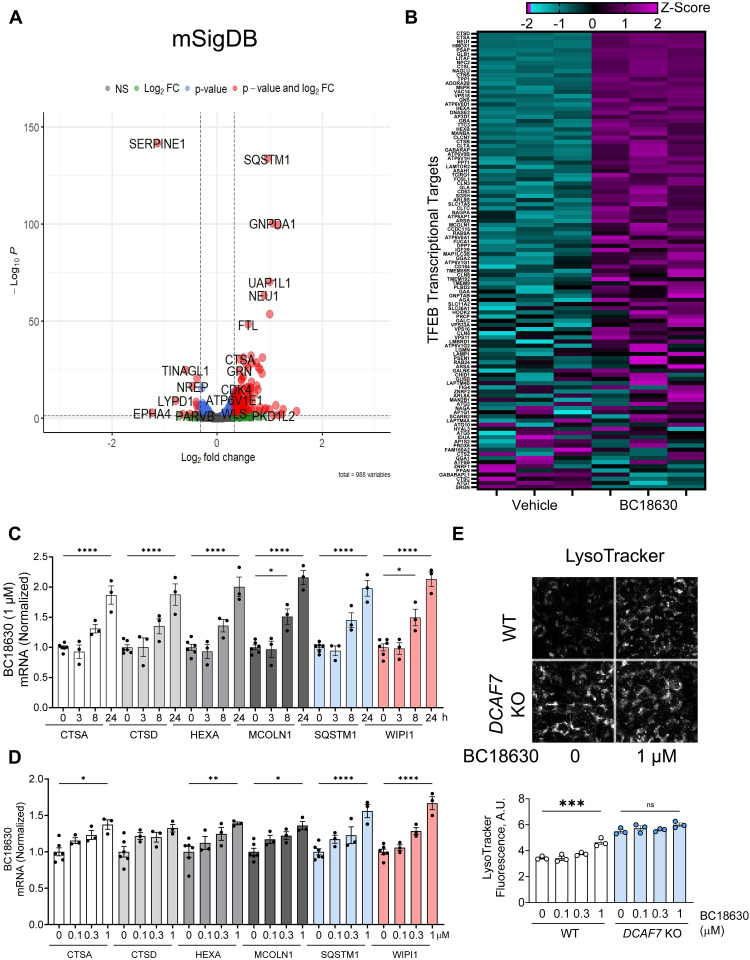
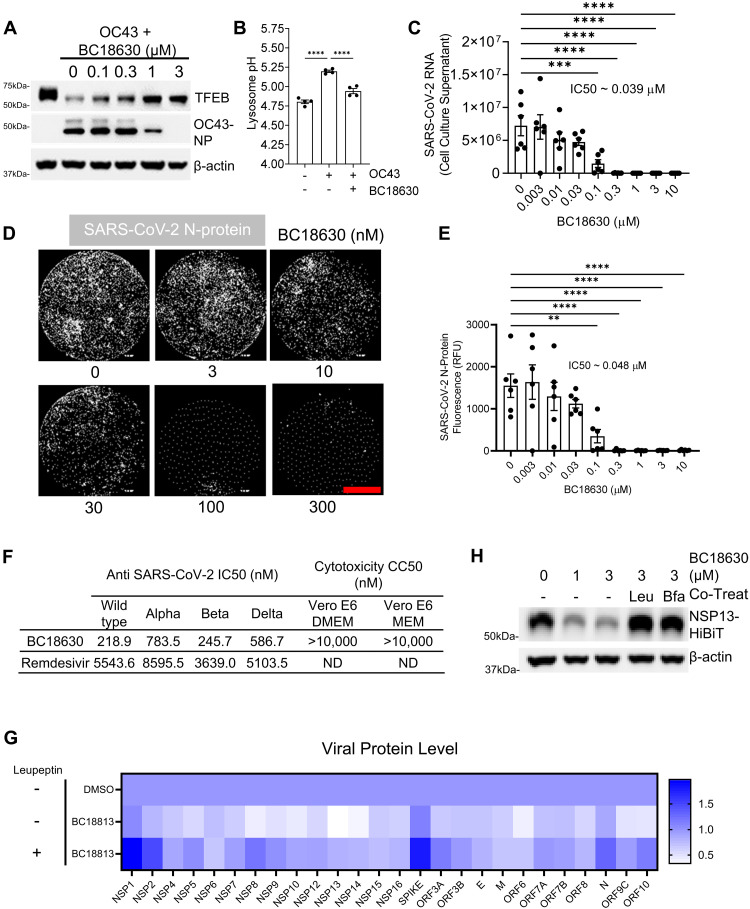
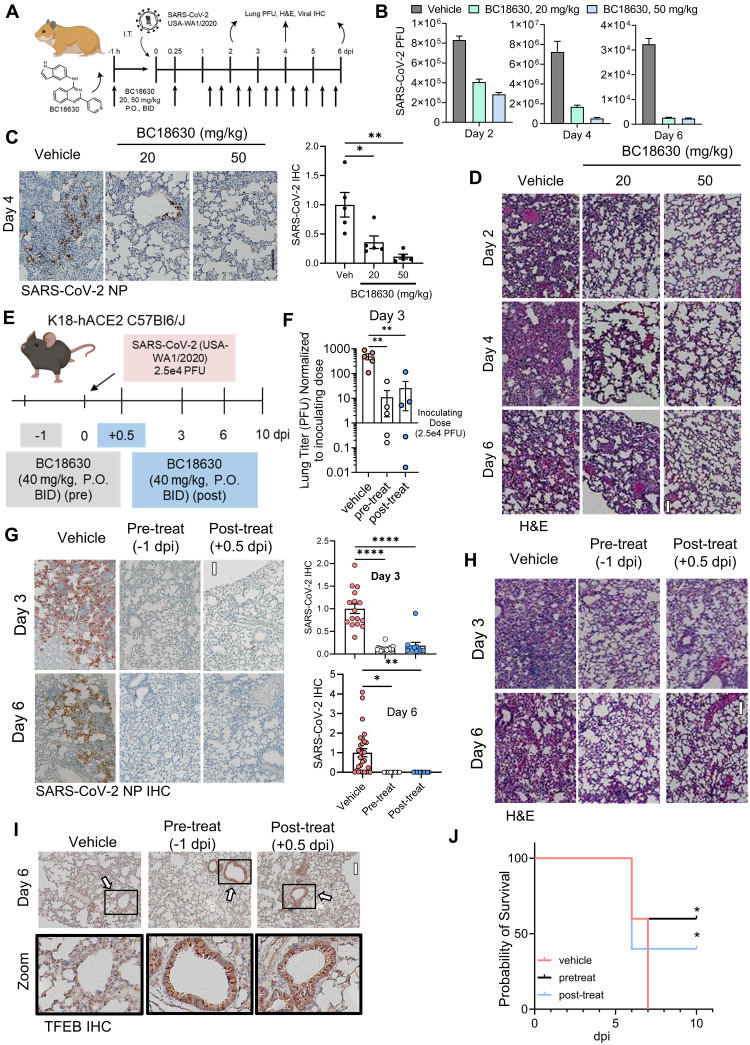
The endolysosomal pathway plays an evolutionarily conserved role in pathogen clearance, and viruses have evolved complex mechanisms to evade this host defense system. Here, we describe a previously unidentified aspect of coronaviral infection, whereby the master transcriptional activator of lysosomal homeostasis-TFEB-is targeted for proteasomal-mediated degradation upon viral infection. Through mass spectrometry analysis and an unbiased small interfering RNA screen, we identify that TFEB protein stability is coordinately regulated by the E3 ubiquitin ligase subunit DCAF7 and the PAK2 kinase. We derive a series of novel small molecules that interfere with the DCAF7-TFEB interaction. These agents inhibit virus-induced TFEB degradation and demonstrate broad antiviral activities including attenuating severe acute respiratory syndrome coronavirus 2 infection in two animal models. Together, these results delineate a virally triggered pathway that impairs lysosomal homeostasis in the host. Small molecule E3 ubiquitin ligase DCAF7 inhibitors that restore lysosomal function represent a novel class of host-directed, antiviral therapies useful for current and potentially future coronaviral variants.


Figures

Fig. 1.
Fig. 1.. Viral infection triggers TFEB ubiquitin-proteasome degradation.
(A) Fluorescence imaging of LysoTracker signal from BEAS-2B cells infected with beta-coronavirus OC43, 48 hours. Scale bar, 50 μm. (B) Quantification of lysosomal pH (lysosensor yellow/blue) in BEAS-2B cells infected with OC43 for 7 hours. Data represent means ± SEM (n = 4). (C) Immunoblotting of BEAS-2B cells infected with OC43 (48 hours postinoculation) and probed for key lysosomal transcription factors. TFEB and homolog protein densitometries were quantified; data represent means ± SEM (n = 3). (D) Quantitative PCR analysis of TFEB mRNA from BEAS-2B cells treated with increasing MOI of OC43 (48 hours). (E) FDA-approved compound screening for enhancers of TFEB nuclear localization under uninfected conditions and in the setting of coronavirus (OC43) infection. BEAS-2B cells stably expressing TFEB-EGFP were analyzed following exposure to a library of ~1100 FDA-approved drugs. Log-fold change in nuclear TFEB signal for each compound is shown in two independent screens, one under basal conditions and one following OC43 infection. The top three hits (red dots) identified from both screens are known proteasomal inhibitors. (F to H) Immunoblotting analysis of TFEB levels from BEAS-2B cells treated with OC43 coronavirus at indicated dose and time with cotreatment of inhibitors of the UPS, TAK-243 (F), CFZ (G), and MLN4924 (H). TFEB densitometry was calculated. Data represent means ± SEM (n = 3). (I) Immunoblot analysis of polyubiquitinated TFEB signal isolated from TUBE PD eluate from BEAS-2B cells infected with or without OC43 (0.3 MOI, 24 hours). Ubiquitinated TFEB and input TFEB protein densitometries were calculated; data represent means ± SEM (n = 3). Not significant (n.s.) P > 0.05; **P < 0.01; ***P < 0.001; ****P < 0.0001 as indicated by two-sided unpaired t test [(B) and (I)], one-way ANOVA with Dunnett’s multiple comparisons [(C) and (D)], or one-way ANOVA with Tukey’s multiple comparisons [(F) to (H)]. MOI, multiplicity of infection.
Fig. 2.
Fig. 2.. E3 ubiquitin ligase DCAF7 controls TFEB protein stability at baseline and during viral infection.
(A) Coomassie protein staining of TFEB-EGFP PD prior to mass spectrometry analysis for TFEB-interacting proteins. EGFP only and TFEB-EGFP are indicated. (B) In vitro TFEB ubiquitination assay. Briefly, in vitro synthesized TFEB protein was incubated with E1, E2, ubiquitin, and Cul4-DDB1-Rbx1 complex, in the absence or presence of recombinant DCAF7. TFEB ubiquitination was quantified; data represent means ± SEM (n = 3). (C) Western blot analysis of a CHX chase in WT or DCAF7 KO BEAS-2B cells. TFEB protein was quantified; data represent means ± SEM (n = 4). h, hours. (D) Fluorescence microscopy of WT or DCAF7 KO BEAS-2B cells expressing TFEB-EGFP to measure TFEB subcellular localization. Scale bar, 10 μm. (E) Immunoblotting of TUBE PD from WT and DCAF7 KO BEAS-2B cells infected with OC43 (24 hours, 0.3 MOI). TFEB ubiquitination was quantified; data represent means ± SEM (n = 3). (F) Immunoblot analysis of WT or DCAF7 KO BEAS-2B cells infected with OC43 for 48 hours. TFEB protein was quantified; data represent means ± SEM (n = 3). (G) Quantification of cell viability (WT and DCAF7 KO) at day 6 post-OC43 infection. Data represent means ± SEM (n = 6). (H) OC43 NP as measured by an in-cell enzyme-linked immunosorbent assay (ELISA) in WT, DCAF7 KO, or DCAF7 KO BEAS-2B cells reconstituted with DCAF7 with increasing MOI of OC43. Data were normalized to WT MOI = 0.03 treatment and represent means ± SEM (n = 3). (I) Immunoblotting of transfected TFEB (V5-HIS-tagged) following PD from the cytosolic and nuclear fractions of WT or DCAF7 KO BEAS-2B. n.s. P > 0.05; *P < 0.05; **P < 0.01; ***P < 0.001; ****P < 0.0001 as indicated by two-sided unpaired t test [(B) and (E)], one-way ANOVA with Tukey’s multiple comparisons [(C) and (F)], or two-way ANOVA with Tukey’s multiple comparisons [(G) and (H)]. MOI, multiplicity of infection.
Fig. 3.
Fig. 3.. Infection enhances TFEB phosphorylation to serve as a phospho-degron.
(A) Schematic of TFEB phosphoproteomics experiment. BEAS-2B cells were treated with vehicle or the proteasomal inhibitor MG132 (1 μM) for 4 hours prior to LC-MS/MS analysis of TFEB phosphorylation status to determine putative phosphorylation sites. Candidate sites are listed in table S1. (B) Immunoblotting of cells infected with OC43 (0.3 MOI, 72 hours) with or without mTOR inhibition (10 nM rapamycin) and phosphorylated TFEB (Ser142, Millipore). (C) TFEB sequence corresponding to a known phospho-degron motif (56). Sequence of biotin-tagged TFEB peptides corresponding to the putative phosphorylation site. (D) TFEB peptide binding assay with recombinant DCAF7. TFEB peptides were conjugated to streptavidin beads and used as bait for DCAF7 protein. DCAF7 densitometry calculated; data represent means ± SEM (n = 3). (E) Binding assay of TFEB (S-A) mutants with DCAF7. (F) In vitro TFEB ubiquitination assay of V5-tagged WT or S138A/S142A TFEB. Briefly, in vitro TnT synthesized TFEB protein was precipitated from the synthesis mixture and incubated with E1, E2, ubiquitin, Cul4-DDB1-Rbx1 complex, and recombinant DCAF7. TFEB ubiquitination was examined with immunoblotting. (G) Immunoblot analysis of BEAS-2B cells transfected with either WT TFEB or the double serine phosphomutant TFEB for 18 hours prior to OC43 infection (at indicated MOI for an additional 72 hours). TFEB and OC43 NP densitometry were calculated; data represent means ± SEM (n = 3). (H) Viability assay of BEAS-2B cells stably expressing TFEB-EGFP WT or phosphomutant (S138A/S142A), following OC43 infection (0.3 MOI, 6 days). Viability determined by CellTiterGlo2.0 measurement; data represent means ± SEM (n = 8). n.s. P > 0.05; *P < 0.05; **P < 0.01; ***P < 0.001; ****P < 0.0001 as indicated by one-way ANOVA with Tukey’s multiple comparisons [(D) and (H)] and two-way ANOVA with Tukey’s multiple comparisons (G).
Fig. 4.
Fig. 4.. Viral infection activates PAK2 kinase to prime TFEB for degradation.
(A) High-content imaging screen of kinase regulators of TFEB-EGFP nuclear localization. The kinase PAK2 was identified as a top regulator of TFEB nuclear levels. (B) Representative images of TFEB-EGFP localization following control or PAK2 RNAi treatment. Boxed area is shown at higher magnification (zoom). Scale bar, 50 μm. (C) Immunoblot analysis of in vitro kinase assay with PAK2 and TFEB. Phosphosignal detected by the Phos-tag Biotin Probe (Fujifilm) chemical system (95). (D) Immunoblotting demonstrating PAK2 activation (serine-20 phosphorylation) in BEAS-2B cells following OC43 infection (48 hours). Protein levels were quantified; data represent means ± SEM (n = 3). (E) Immunoblotting of TFEB in WT or PAK2 KO BEAS-2B cells following infection with OC43 (48 hours). TFEB was quantified; data represent means ± SEM (n = 3). (F) TUBE PD assay from WT or PAK2 KO BEAS-2B cells following 24 hours of OC43 infection (0.3 MOI). Ubiquitinated TFEB was quantified; data represent means ± SEM (n = 3). (G) Quantification of infection through an in-cell ELISA assay of WT or PAK2 KO BEAS-2B cells (OC43, 48 hours). Data represent means ± SEM (n = 6). (H) Immunoblotting of PAK2 KO cells reconstituted with WT or kinase “dead” [T402A (101)] PAK2 followed by OC43 infection (72 hours, 0.3 MOI). TFEB was quantified; data represent means ± SEM (n = 3). (I) Viability assays of PAK2 KO cells reconstituted with WT or inactive PAK2 enzyme and infected with OC43 (6 days, 0.3 MOI). Viability represented as percent decrease relative to control. Data represent means ± SEM (n = 6). (J) Schematic of PAK2-induced priming phosphorylation (step 1), required for DCAF7-mediated binding (step 2), and TFEB polyubiquitination (step 3). n.s. P > 0.05; *P < 0.05; ***P < 0.001; ****P < 0.0001 as indicated by one-way ANOVA with Tukey’s post hoc [(E), (G), (H)], two-way ANOVA with Tukey’s post hoc (D), or two-sided unpaired t test (F).
Fig. 5.
Fig. 5.. Small molecule DCAF7 inhibitors disrupt DCAF7-TFEB binding and activate TFEB protein level.
(A) Representation of BC18630 structure docking with the original DCAF7 homology model. BC18630 is predicted to interact with DCAF7 between the β strands of the WD propeller domain. (B) nanoDSF of DCAF7 and BC18630. The first derivative of the 350-nm/330-nm fluorescent ratio is displayed for each BC18630 dose, showing shift consistent with direct target engagement. (C) MST of DCAF7 and BC18630. Fluorescently labeled DCAF7 protein was incubated with BC18630, heated across a temperature gradient, and thermophoretic fluorescent change measured. Normalized fluorescence of heated versus unheated (Fnorm) was determined and plotted against BC18630 concentration to calculate a binding coefficient. (D) CETSA assay of endogenous DCAF7, and reconstituted DCAF7 with mutated predicted interacting site (Cys283Phe) expressed in cells and incubated BC18630. Immunoblotted DCAF7 protein densitometry was quantified (n = 3). (E) PLA of TFEB and DCAF7 in BEAS-2B cells treated with BC18630. The TFEB-DCAF7 association is indicated by red dots. Data represent mean and interquartile range (n = 11 to 25 cells). (F) Peptide binding assay with BC18630 competition. Biotin-labeled phosphorylated TFEB peptides (Ser138 and Ser142) were conjugated to streptavidin beads and incubated with DCAF7 protein that was preincubated with BC18630. After binding and washing, the eluate was analyzed for DCAF7 signal and quantified. Data represent means ± SEM (n = 3). (G) TFEB cellular ubiquitination assay with BC18630 treatment. TFEB-EGFP protein was immunoprecipitated and ubiquitinated TFEB signal was quantified; data represent means ± SEM (n = 3). (H) Immunoblot analysis WT or DCAF7 KO BEAS-2B cells treated with increasing concentrations of BC18813 (18 hours). TFEB was quantified; data represent means ± SEM (n = 3). n.s. P > 0.05; *P < 0.05; **P < 0.01; ***P < 0.001; ****P < 0.0001, or P value noted, as indicated by one-way ANOVA with Dunnett’s post hoc [(E) and (F)] or two-sided t test (G).
Fig. 6.
Fig. 6.. Small molecule DCAF7 inhibition activates TFEB transcriptional program.
(A) RNA-seq results (GEO accession number: GSE292982) from BEAS-2B cells treated with BC18630 (3 μM) or vehicle for 18 hours. Data are represented as a volcano plot with significance plotted against fold change (n = 3 per group). Genes plotted include the mSigDB collection (102). (B) Heatmap of RNA-seq data from BEAS-2B cells treated with or without BC18630 (3 μM) for 18 hours. Genes shown are previously identified TFEB targets associated with autophagy and lysosomal biogenesis (103). Data are Z score from n = 3 biological replicates. (C and D) Quantitative PCR analysis of known lysosomal transcriptional targets of TFEB obtained from BEAS-2B cells treated with BC18630 (1 μM) for the indicated time (C) with increasing concentrations (D) and harvested at 18 hours. Data represent fold change in indicated target mRNA levels relative to control treatment; means ± SEM (n = 3 to 6). (E) Fluorescent micrograph of WT or DCAF7 KO BEAS-2B cells treated with BC18630 (18 hours) and stained with LysoTracker. Fluorescence was quantified; data represent median LysoTracker signal from each sample, means ± SEM (n = 3). n.s. P > 0.05; *P < 0.05; **P < 0.01; ***P < 0.001; ****P < 0.0001, or P value noted, compared to vehicle or control or as indicated by one-way ANOVA with Dunnett’s multiple comparisons [(C) and (D)] or one-way ANOVA with Tukey’s multiple comparisons (E).
Fig. 7.
Fig. 7.. In vitro protection from coronaviral infection using small molecule DCAF7 inhibitors.
(A) Immunoblot analysis of OC43 (0.3 MOI, 48 hours) infected BEAS-2B cells treated with increasing concentrations of BC18630. (B) Quantification of lysosomal pH in BEAS-2B cells infected with OC43 for 7 hours without or with 18 hours pretreatment of BC18630 (100 nM). Data represent means ± SEM (n = 4). (C to E) Cell-based SARS-CoV-2 infection assay with Calu-3 human lung cells, DCAF7 inhibitors, and SARS-CoV-2 (USA-WA-1/2020, MOI 0.01). Viral RNA was detected from cell supernatant (C). Data represent means ± SEM (n = 6); IC50 determined by sigmoidal nonlinear regression. Cells were fixed and stained for SARS-CoV-2 NP for fluorescence microscopy and quantification of viral signal [(D) and (E)]. Data represent means ± SEM (n = 6), and IC50 values were determined by sigmoidal nonlinear regression. (F) Vero E6 kidney cells were infected with SARS-CoV-2 WT and WHO previously annotated VOCs Alpha, Beta, and Delta along with BC18630 or remdesivir. Infection was quantified, data are IC50 estimates, n = 4, calculated from nonlinear regression with variable Hill slope. Cytotoxicity (CC50) of DCAF7 inhibitor was estimated to be larger than 10 μM, the highest concentration tested. ND, not determined. (G) Codon-optimized SARS-CoV-2 viral protein sequences (65) were cloned into HiBiT-tagged expression vectors, expressed in BEAS-2B, and their stability landscape was profiled. Viral proteins expressed in BEAS-2B for 18 hours, and then treated with BC18813 (3 μM, 24 hours) with lysosomal inhibition (leupeptin, 2 μM). Data are mean values of n = 2 to 4 biological replicates. (H) Immunoblot analysis of BEAS-2B cells transfected with NSP13-HiBiT and treated with DCAF7 inhibitor (24 hours) and lysosomal inhibitor leupeptin (Leu, 2 μM) or BFA (0.2 μM). **P < 0.01; ***P < 0.001; ****P < 0.0001 as indicated by one-way ANOVA with Tukey’s post hoc (B) or by one-way ANOVA with Dunnett’s post hoc [(C) and (E)]. Scale bar, 2000 μm.
Fig. 8.
Fig. 8.. In vivo protection from coronaviral infection using small molecule DCAF7 inhibitors.
(A to D) In vivo SARS-CoV-2 hamster infection model. (A) Five Syrian golden hamsters per group were treated with BC18630 (P.O.) one hour prior to inoculation with SARS-CoV-2 (i.t.). Six hours later, a second dose of BC18630 was administered and then BID for 5 days. Animals were euthanized on days 2, 4, and 6 dpi. (B) SARS-CoV-2 PFU assays from pooled lungs tissue lysate of n = 3 animals. Data represent means ± SEM of technical replicates (n = 3). (C) IHC of SARS-CoV-2 NP in lung at 4 dpi; signal was quantified from five random fields; means ± SEM. (D) Representative images of H&E-stained lungs. (E to J) SARS-CoV-2 K18-hACE2 C57BL/6J transgenic mice model with pre- and postinfection BC18630 treatment. (E) Mice infected with SARS-CoV-2 (USA-WA1/2020, 2.5 × 10⁴ PFU) were either given BC18630 (40 mg/kg) 24 hours before infection (pre-treat, BID thereafter), 12 hours after infection (post-treat, BID thereafter), or vehicle treatment. Groups were euthanized on days 3 and 6, with a survival experiment lasting until day 10. (F) Lung viral titer at 3 dpi using plaque assay; initial inoculated dose shown as reference. Data represent means ± SEM of n = 5. (G) IHC of SARS-CoV-2 NP in lung at 3 and 6 dpi. Signal was quantified, n = 8 to 29 random fields per treatment; data represent means ± SEM. (H) H&E histology of infected mouse lungs. I. IHC of host TFEB protein in lung at 6 dpi. Arrows indicate TFEB staining in airways. (J) Survival analysis, data shown using the Kaplan-Meier plot. N = 5 mice per treatment, 0/5 vehicle mice survived, 3/5 pretreated mice survived, and 2/5 posttreated mice survived. n.s. P > 0.05; *P < 0.05; **P < 0.01; ****P < 0.0001 as indicated by one-way ANOVA with Dunnett’s post hoc [(C) and (G)] or Fleming-Harrington test (J). Scale bar, 100 μm.

Similar articles

References

    1. World Health Organization, WHO Coronavirus Disease (COVID-19) Dashboard (2024); https://data.who.int/dashboards/covid19/.
    1. Diamond M. S., Kanneganti T. D., Innate immunity: The first line of defense against SARS-CoV-2. Nat. Immunol. 23, 165–176 (2022). - PMC - PubMed
    1. Tay M. Z., Poh C. M., Rénia L., MacAry P. A., Ng L. F. P., The trinity of COVID-19: Immunity, inflammation and intervention. Nat. Rev. Immunol. 20, 363–374 (2020). - PMC - PubMed
    1. Merad M., Blish C. A., Sallusto F., Iwasaki A., The immunology and immunopathology of COVID-19. Science 375, 1122–1127 (2022). - PubMed
    1. Wang X., Lu L., Jiang S., SARS-CoV-2 evolution from the BA.2.86 to JN.1 variants: Unexpected consequences. Trends Immunol. 45, 81–84 (2024). - PubMed

MeSH terms

Substances

LinkOut - more resources