. 2025 Jun 6;11(23):eadt0539.
doi: 10.1126/sciadv.adt0539. Epub 2025 Jun 4.

Diversity and longitudinal records: Genetic architecture of disease associations and polygenic risk in the Taiwanese Han population

Affiliations

Diversity and longitudinal records: Genetic architecture of disease associations and polygenic risk in the Taiwanese Han population

Ting-Yuan Liu et al. Sci Adv. .

Abstract

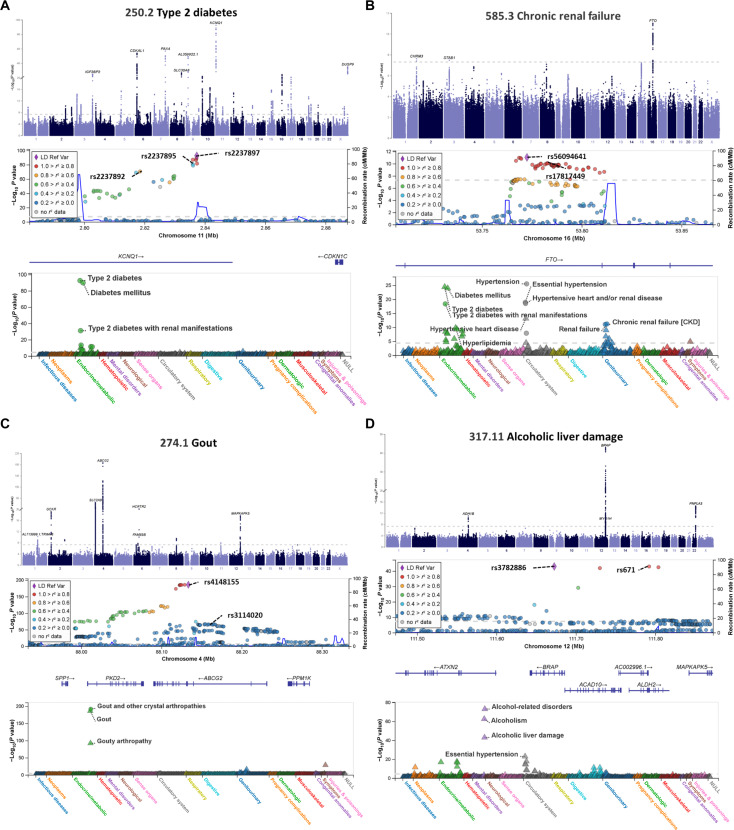
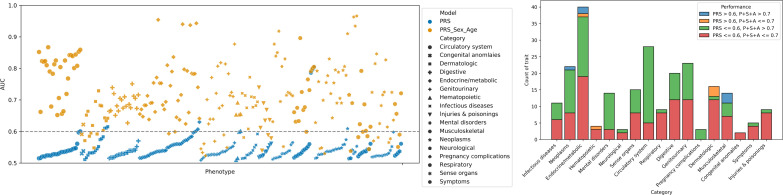
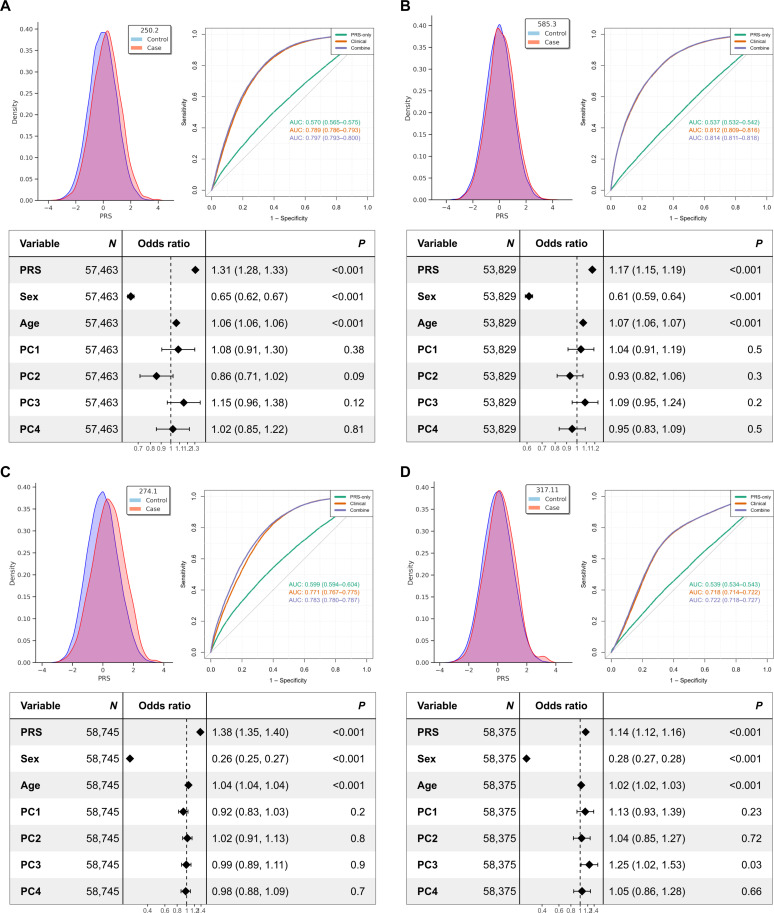
We addressed the underrepresentation of non-European populations in genome-wide association studies (GWASs) by building HiGenome, a large-scale genetic resource for the Taiwanese Han population. Using a custom genotyping array, we integrated deidentified electronic medical records (2003 to 2021) with genomic data to enable GWASs, phenome-wide association studies, and polygenic risk score (PRS) analysis. Among 413,000 participants, 323,397 passed ancestry and quality control filtering. GWASs covered 1085 traits, focusing on diseases prevalent in Taiwan such as type 2 diabetes, chronic kidney disease, gout, and alcoholic liver damage. PRSs were calculated for 238 traits, with the strongest associations observed in musculoskeletal disorders. Incorporating PRS into clinical practice supports early risk prediction and personalized prevention. To further expand translational value, we also conducted pharmacogenomic analysis and human leukocyte antigen typing. HiGenome offers a large-scale genetic and clinical dataset from the Taiwanese Han population, supporting population-specific analyses and precision medicine development in East Asia. The hospital-based design enables continuous follow-up and longitudinal data expansion.


Figures

Fig. 1.
Fig. 1.. Analysis platforms for our genotyping chip.
The center of the schematic depicts our foundational data derived using the TPMv1 chip, revealing variants identified using blood DNA samples. We conducted an imputation analysis to enhance the data’s richness, preparing the dataset for future integrative analyses for other databases. Around the center are our extended analytical platforms: pharmacogenomics, human leukocyte antigen typing, parentage testing, ancestry analysis, and PRS modeling.
Fig. 2.
Fig. 2.. HiGenome cohort clinicodemographic data.
(A) HiGenome contains data from individuals residing in densely populated residential areas in Taiwan. These data were primarily collected by CMUH and its affiliated institutions. (B) The left part presents the duration of follow-up, indicating a predominance of patients who were followed up for less than 1 year up to 18 years. The right part presents the annual distribution of diagnoses identified from the patients’ EMRs, indicating a gradual increase in the number of diagnoses. (C) In terms of patient recruitment, most patients were enrolled from the hospital’s internal medicine department. (D) Diagnoses were classified using PheCodes. Most diagnoses were related to the circulatory system. (E) Age distribution for each trait, with the x axis representing the median age of the case group and the y axis representing the median age of the control group. Each color represents a unique category, with the size of the legend reflecting the number of participants. The reference line indicates equal age proportions between groups; the right half demonstrates the gender distribution for each trait. (F) The right half is an enlarged view focusing on the control group with a male proportion ranging between 0.4 and 0.54. The x axis indicates the male proportion in the case group, whereas the y axis indicates the male proportion in the control group. The left half indicates traits with exclusively female (lower left) or male (upper right) participants. This focused view on the right half clearly demonstrates gender proportion disparities. The male proportion in the control group ranges between 0.5 and 0.42, with notable variances in the case group due to disease characteristics.
Fig. 3.
Fig. 3.. PCA and ancestral analysis of data from the HiGenome cohort and 1000 Genomes Project.
(A) Scatterplot depicting the PCA results for principal components 1 and 2. This analysis was conducted using data from both the HiGenome cohort and the 1000 Genomes Project. Most patients in the HiGenome cohort were clustered within the EAS cohort of the 1000 Genomes Project. (B) Visualization after the exclusion (from the EAS cohort) of data points with deviations exceeding an IQR of 3. (C) Focused view of the EAS region, with data points excluded because of deviation. (D) Subset of the HiGenome cohort juxtaposed with the EAS cohort. (E) Primary ancestral components for each individual. Most individuals in the HiGenome cohort belonged to the EAS population, which comprised Southern Han Chinese individuals, Han Chinese individuals from Beijing, and Kinh individuals from Ho Chi Minh, Vietnam. Postvisualization of ancestry for all participants; those with >50% from a singular ancestry are depicted in the upper section, whereas those without >50% from a single ancestry are depicted in the lower section, with different colors indicating varying origins.
Fig. 4.
Fig. 4.. Atlas of GWASs depicting significant genetic associations across traits.
The outermost circle presents the most significant genes for each trait, plotted on the basis of their P values on a Manhattan plot. On this circle, the 10 most significant genes for each disease category are marked and color coded in accordance with disease classification. The middle circle depicts the number of individuals affected by each trait. The innermost circle depicts the number of significant genes (P < 5 × 10⁻⁸) associated with each trait.
Fig. 5.
Fig. 5.. Comprehensive GWASs of selected diseases.
Manhattan plots (top) of significant gene loci associated with various diseases: (A) T2D, (B) CKD, (C) gout, and (D) ALD. The x axis represents the absolute chromosomal positions of the genes, and the y axis represents the corresponding P values. Region plots (middle) of the most significant variant loci adjacent to those associated with the EAS population; variant associations are color coded to indicate the degree of correlation. Results of PheWASs (bottom) for the most significant variant loci associated with each disease, color coded in accordance with disease classification.
Fig. 6.
Fig. 6.. Statistical analysis of PRS models across traits.
(Left) AUC value for each trait. Traits in blue indicate AUC values derived exclusively from the PRS, where traits in yellow indicate AUC values derived from the model incorporating both the PRS and clinical features. Each symbol indicates unique disease classification. Most traits initially exhibited an AUC of <0.6; however, with the addition of clinical features, most traits exhibited an AUC of >0.6. (Right) High-performance PRS models. Traits with a PRS AUC of >0.6 and PRS+clinical features AUC of >0.7 are highlighted in blue. These traits are predominantly related to endocrinological, musculoskeletal, and other relevant diseases. AUC, area under the curve; PRS, polygenic risk score.
Fig. 7.
Fig. 7.. Detailed PRS analysis of key diseases.
The top-left panel displays the distribution of PRSs in the case and control groups for (A) T2D, (B) CKD, (C) gout, and (D) ALD. The x axis represents the normalized PRSs. The top-right panel displays the results of 10-fold cross-validation for AUC values; the outcomes of models including PRS, clinical features, or their combination are indicated using different colors. The bottom panel presents a forest plot for each feature, offering insights into patient count, OR, and statistical significance. PRS, polygenic risk score.

Similar articles

Cited by

References

    1. Fatumo S., Chikowore T., Choudhury A., Ayub M., Martin A. R., Kuchenbaecker K., A roadmap to increase diversity in genomic studies. Nat. Med. 28, 243–250 (2022). - PMC - PubMed
    1. Hindorff L. A., Bonham V. L., Brody L. C., Ginoza M. E. C., Hutter C. M., Manolio T. A., Green E. D., Prioritizing diversity in human genomics research. Nat. Rev. Genet. 19, 175–185 (2018). - PMC - PubMed
    1. Huntley C., Torr B., Sud A., Rowlands C. F., Way R., Snape K., Hanson H., Swanton C., Broggio J., Lucassen A., Cartney M. M., Houlston R. S., Hingorani A. D., Jones M. E., Turnbull C., Utility of polygenic risk scores in UK cancer screening: A modelling analysis. Lancet Oncol. 24, 658–668 (2023). - PubMed
    1. Thomas S. A., Browning C. J., Charchar F. J., Klein B., Ory M. G., Bowden-Jones H., Chamberlain S. R., Transforming global approaches to chronic disease prevention and management across the lifespan: Integrating genomics, behavior change, and digital health solutions. Front. Public Health 11, 1248254 (2023). - PMC - PubMed
    1. Martin A. R., Kanai M., Kamatani Y., Okada Y., Neale B. M., Daly M. J., Clinical use of current polygenic risk scores may exacerbate health disparities. Nat. Genet. 51, 584–591 (2019). - PMC - PubMed

Supplementary concepts

LinkOut - more resources