. 2025 Jun 6;11(23):eadt5708.
doi: 10.1126/sciadv.adt5708. Epub 2025 Jun 4.

Predicting therapeutic clinical trial enrollment for adult patients with low- and high-grade glioma using supervised machine learning

Affiliations

Predicting therapeutic clinical trial enrollment for adult patients with low- and high-grade glioma using supervised machine learning

Mulki Mehari et al. Sci Adv. .

Abstract

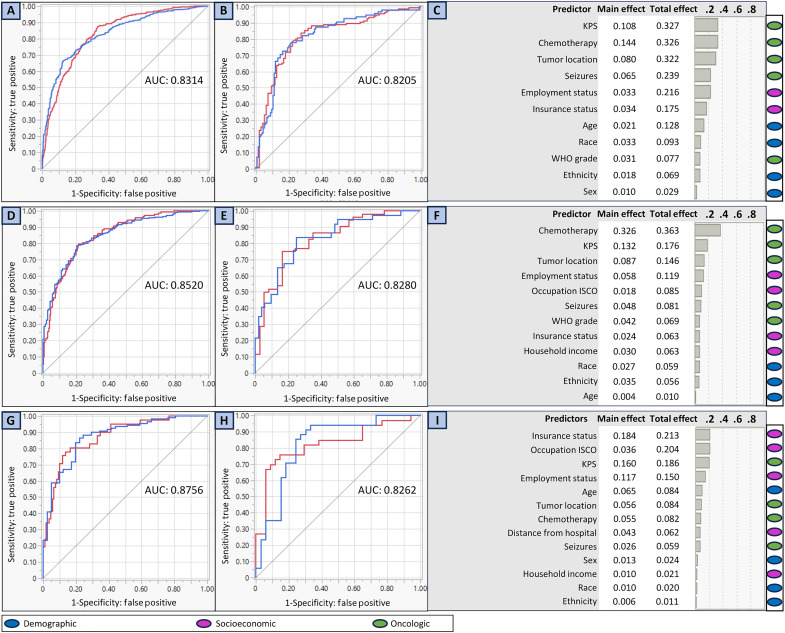
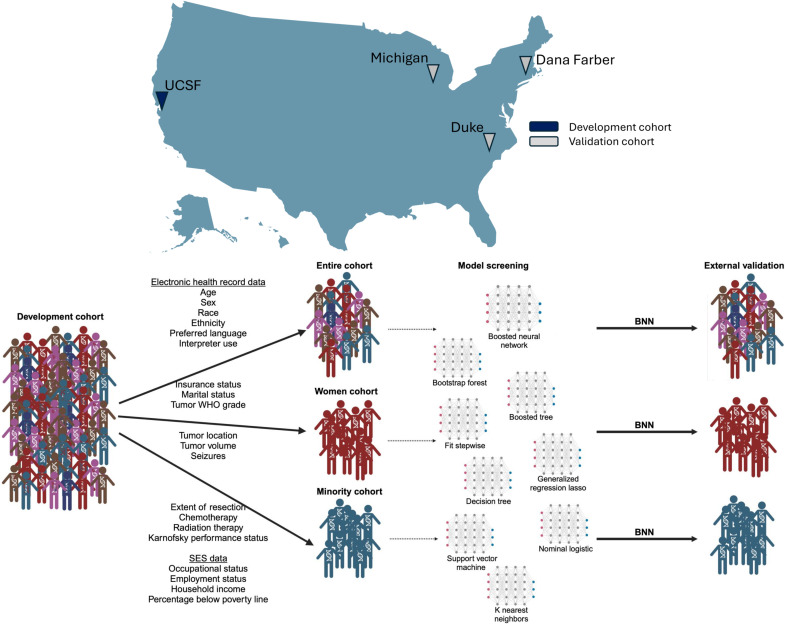
Therapeutic clinical trial enrollment does not match glioma incidence across demographics. Traditional statistical methods have identified independent predictors of trial enrollment; however, our understanding of the interactions between these factors remains limited. To test the interactive effects of demographic, socioeconomic, and oncologic variables on trial enrollment, we designed boosted neural networks (BNNs) for all glioma patients (n = 1042), women (n = 445, 42.7%), and minorities (n = 151, 14.5%) and externally validated these models [whole cohort, n = 230; women, n = 89 (38.7%); minority, n = 66 (28.7%)]. For the whole-cohort BNN, the most influential variables on enrollment were oncologic variables, including KPS [total effect (TE), 0.327], chemotherapy (TE, 0.326), tumor location (TE, 0.322), and seizures (TE, 0.239). The women-only BNN exhibited a similar trend. Conversely, for the minority-only BNN, socioeconomic variables [insurance status (TE, 0.213), occupation classification (TE, 0.204), and employment status (TE, 0.150)] were most influential. These results may help prioritize patient-specific initiatives to increase accrual.


Figures

Fig. 1.
Fig. 1.. ROC curves and ranked variables of importance for BNN models for trial enrollment.
The figure depicts the receiver operator characteristic (ROC) curves and variables of importance for predicting therapeutic clinical trial enrollment using BNN models for the whole, women-only, and minority-only cohorts. In all ROC curves, the red lines represent clinical trial enrollment, while the blue lines represent lack of enrollment. The AUC values for each ROC curve are listed. The main and total effects for each variable are listed in variables of importance output for each model. Adjacent to the variables of importance outputs are color-coded heatmaps indicating whether the ranked factors are demographic, socioeconomic, or oncologic variables. (A) The ROC curve for the whole development cohort. (B) The ROC curve for the whole validation cohort. (C) The variables of importance for the whole-cohort model in descending order of importance. (D) The ROC curve for the women development cohort. (E) The ROC curve for the women validation cohort. (F) The ranked variables of importance for the women cohort model in descending order of importance. (G) The ROC curve for the minority development cohort. (H) The ROC curve for the minority validation cohort. (I) The ranked variables of importance for the minority cohort model in descending order of importance.
Fig. 2.
Fig. 2.. Shapley values for influential predictors for the whole-cohort BNN model.
The figure shows the distribution of Shapley values for each influential predictor in the whole-cohort BNN model. Each dot corresponds to the Shapley value for each predictor for a single patient. Positive and negative Shapley values indicate increased and decreased probability of enrollment, respectively. Each predictor is stratified into two levels, with the characteristic associated with higher mean Shapley values color coded in dark blue and the characteristic with the lower mean Shapley values color coded in dark red. t tests were used to assess for differences in mean Shapley values for each predictor. Predictors are arranged from most influential to least influential (left to right) according to the variables of importance calculation for the predictive model. **P < 0.01; ***P < 0.0001.
Fig. 3.
Fig. 3.. GPREDICT schematic for BNN development and validation for the whole cohort, women-only cohort, and minority-only cohort.
The figure represents four academic medical centers, and the schematic depicts the sequence of dividing the whole cohort into the women-only and minority-only cohorts for model development, model screening with internal cross-validation, and external validation.

Similar articles

Cited by

References

    1. Chang S. M., Barker F. G. II, Schmidt M. H., Sloan A. E., Kasper R., Phillips L., Shih K., Hariharan S., Berger M. S., The Glioma Outcomes Investigators , Clinical trial participation among patients enrolled in the Glioma Outcomes Project. Cancer 94, 2681–2687 (2002). - PubMed
    1. Escritt K., Mann M., Nelson A., Harrop E., Hope and meaning-making in phase 1 oncology trials: A systematic review and thematic synthesis of qualitative evidence on patient-participant experiences. Trials 23, 409 (2022). - PMC - PubMed
    1. Reihl S. J., Patil N., Morshed R. A., Mehari M., Aabedi A., Chukwueke U. N., Porter A. B., Fontil V., Cioffi G., Waite K., Kruchko C., Ostrom Q., Barnholtz-Sloan J., Hervey-Jumper S. L., A population study of clinical trial accrual for women and minorities in neuro-oncology following the NIH Revitalization Act. Neuro Oncol. 24, 1341–1349 (2022). - PMC - PubMed
    1. Murthy V. H., Krumholz H. M., Gross C. P., Participation in cancer clinical trials: Race-, sex-, and age-based disparities. JAMA 291, 2720–2726 (2004). - PubMed
    1. US Congress, National Institutes of Health Revitalization Act of 1993, Public Law 103-43 (Washington, DC, 10 June 1993).