. 2025 Jun 6;11(23):eadt1466.
doi: 10.1126/sciadv.adt1466. Epub 2025 Jun 4.

Fecal metabolite profiling identifies critically ill patients with increased 30-day mortality

Affiliations

Fecal metabolite profiling identifies critically ill patients with increased 30-day mortality

Alexander P de Porto et al. Sci Adv. .

Abstract

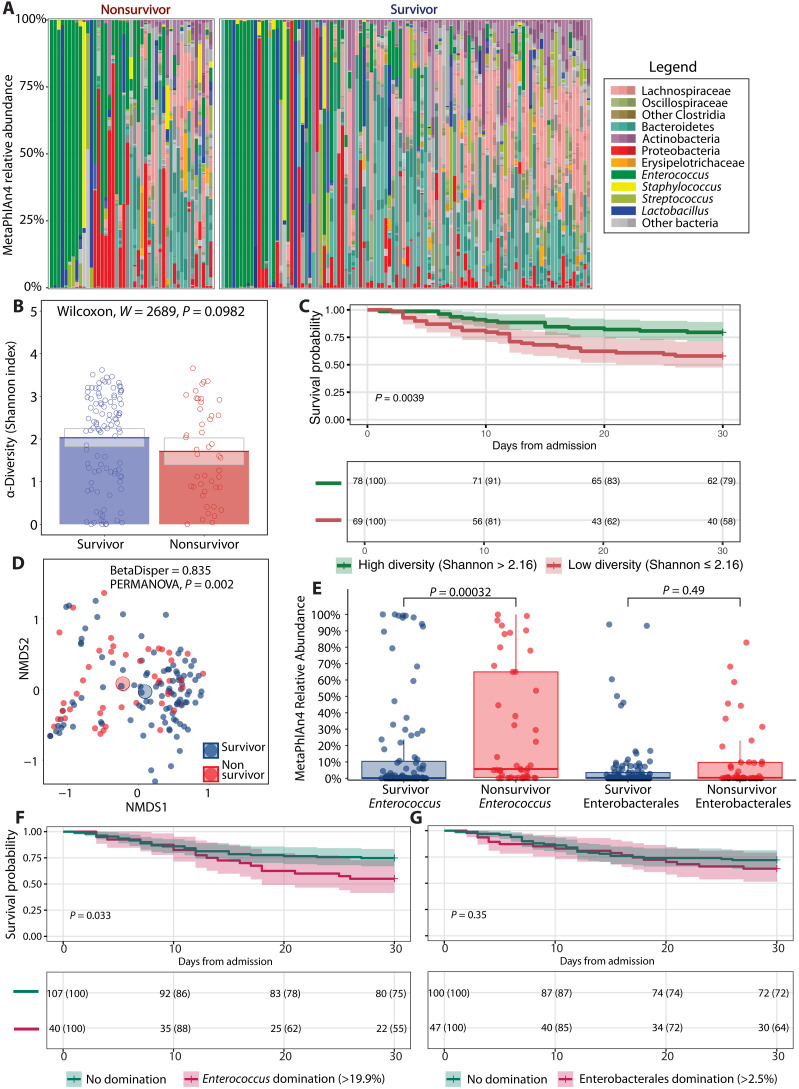
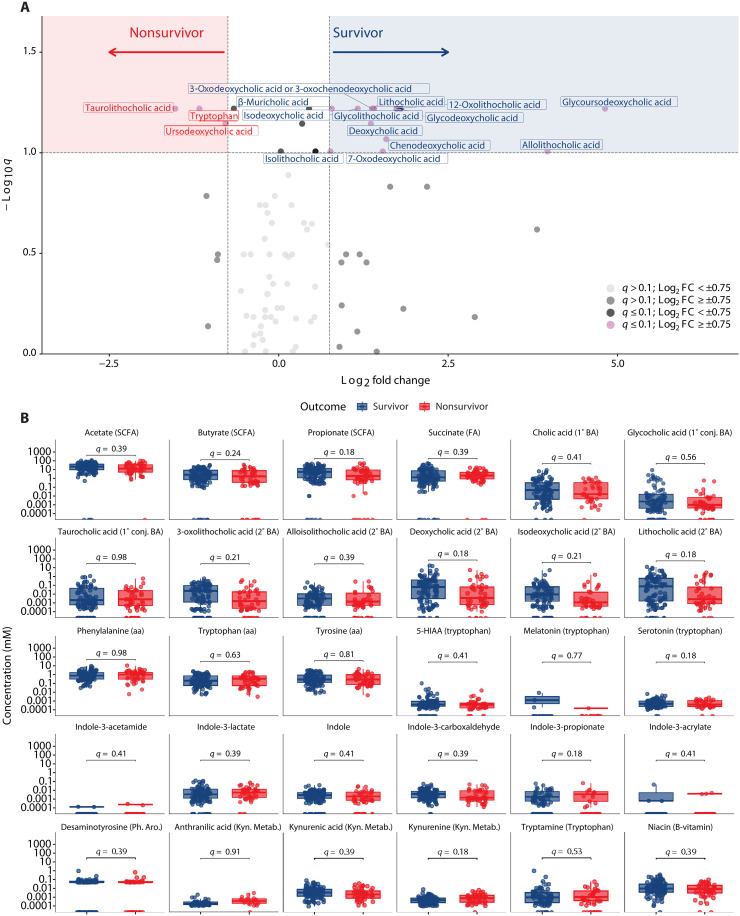
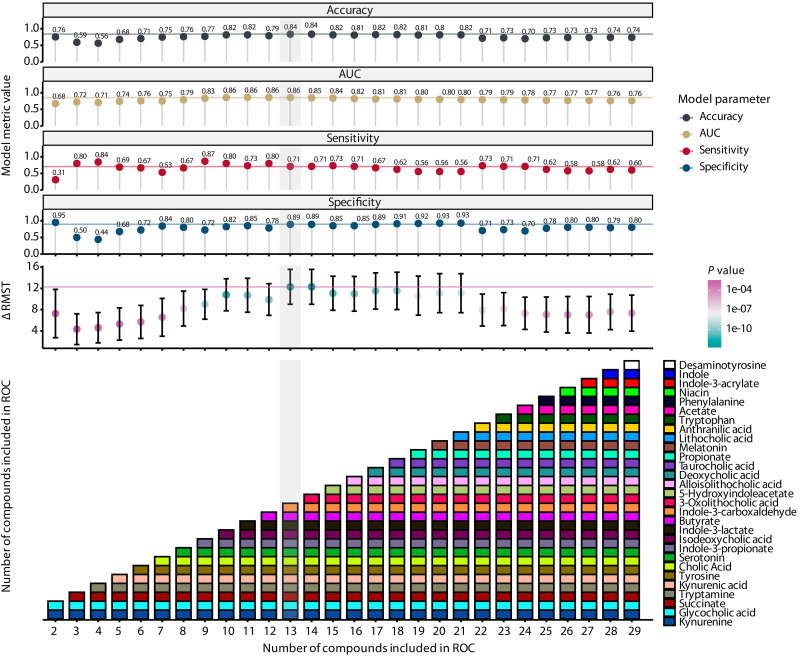
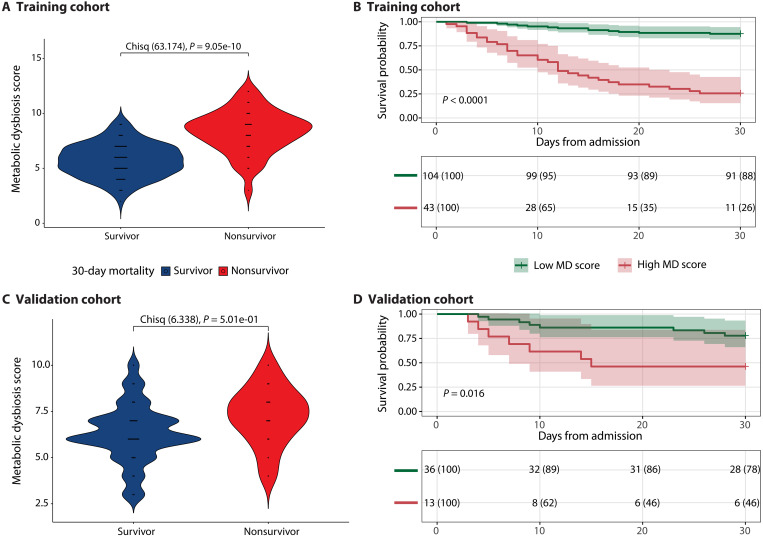
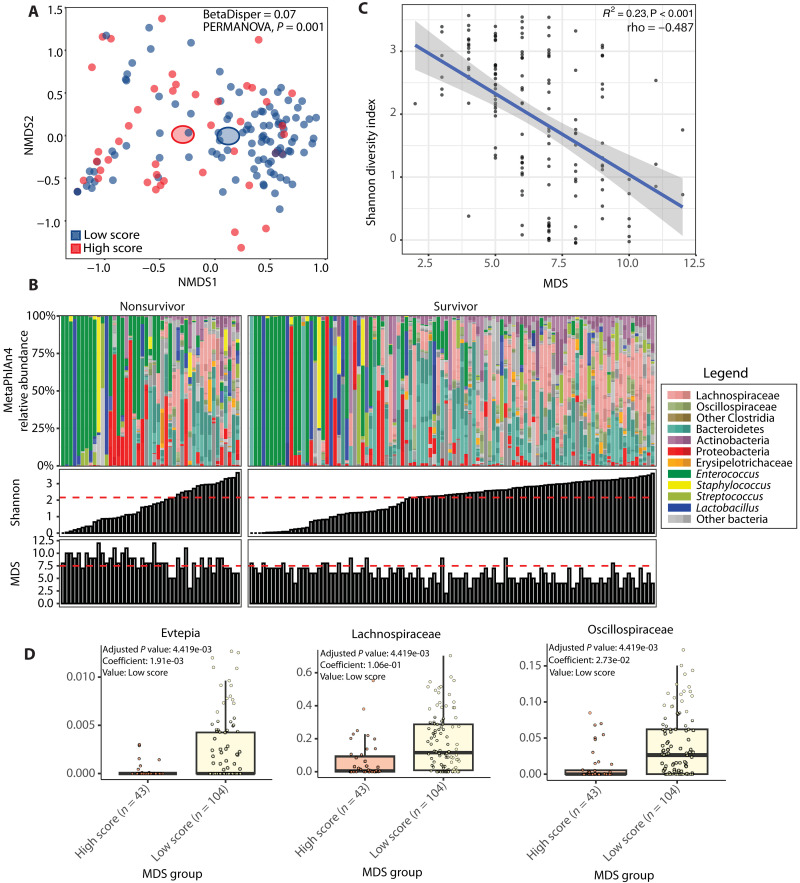
Critically ill patients admitted to the medical intensive care unit (MICU) have reduced intestinal microbiota diversity and altered microbiome-associated metabolite concentrations. Metabolites produced by the gut microbiota have been associated with survival of patients receiving complex medical treatments and thus might represent a treatable trait to improve clinical outcomes. We prospectively collected fecal specimens, defined microbiome compositions by shotgun metagenomic sequencing, and quantified microbiota-derived fecal metabolites by mass spectrometry from 196 critically ill patients admitted to the MICU for non-COVID-19 respiratory failure or shock to correlate microbiota features and metabolites with 30-day mortality. Microbiota compositions of the first fecal sample after MICU admission did not independently associate with 30-day mortality. We developed a metabolic dysbiosis score (MDS) that uses fecal concentrations of 13 microbiota-derived metabolites, which predicted 30-day mortality independent of known confounders. The MDS complements existing tools to identify patients at high risk of mortality by incorporating potentially modifiable, microbiome-related, independent contributors to host resilience.


Figures

Fig. 1.
Fig. 1.. Shotgun metagenomic-derived diversity metrics and relevant taxa for survival outcomes.
(A) Relative abundances for each patient where taxa are grouped and colored at varying, biologically relevant taxonomic levels. (B) Bar graph of alpha diversity, estimated by the Shannon index. (C) Kaplan-Meier curve with 30-day survival probabilities after admission to the ICU, stratifying patients according to their Shannon diversity values as determined by an optimal threshold analysis. (D) Beta diversity as determined by nonmetric multidimensional scaling (NMDS). (E) Box plot of relative abundances of pathogenic taxa. (F) Kaplan-Meier curve with 30-day survival probabilities after admission to the ICU, stratifying patients according to Enterococcus relative abundance status (genus level). (G) Thirty-day survival probabilities after admission to the ICU, stratifying patients according to Enterobacterales relative abundance status (order level). Bar graphs show average values for each group, while gray boxes denote 95% CIs. Box plots show interquartile ranges (IQRs) where the center bolded line represents the median and the whiskers (vertical lines) extend either to 1.5 times the IQR or to the minimum and maximum values, depending on whichever is closest to the median value. Kaplan-Meier survival analyses have time after ICU admission represented on the x axis in days with the probability of survival of each stratified group shown on the y axis. Survival probability is shown below each curve at 10-day intervals. Groups in (B) and (E) were compared using Wilcoxon rank sum, two-tailed unpaired tests where P values were adjusted (q values) for multiple comparisons via the Benjamini-Hochberg method. Groups in (C), (F), and (G) were compared using a log-rank test to assess significance. In (D), homogeneity of dispersion was assessed using the Bray-Curtis distance matrix and tested via a permutation analysis of variance (PERMANOVA) model.
Fig. 2.
Fig. 2.. Qualitative and quantitative metabolomics across survivors and nonsurvivors.
(A) Volcano analysis of qualitatively estimated metabolites, where values with q ≤ 0.1 are shown above the horizontal line and log2FC values greater than 0.75 or less than −0.75 fall in the red and blue shaded areas. (B) Metabolites were quantitatively calculated across survival groups. 5-HIAA, 5-hydroxyindoleacetic acid; aa, amino acid; BA, bile acid; Conj, conjugated; FA, fatty acid; Kyn. Metab, kynurenine metabolite; Ph.Aro, Phenolic Aromatic metabolite; SCFA, short chain fatty acid. In (A) and (B), Wilcoxon rank sum, two-tailed unpaired tests were performed, and P values were adjusted (q values) for multiple comparisons via the Benjamini-Hochberg method.
Fig. 3.
Fig. 3.. Model and survival metrics of the MDS.
The top panels show accuracy, AUC, sensitivity, specificity, and the difference in RMST between low and high scores (as determined by an optimal threshold analysis) of each model. The lowest panel shows the number of compounds sequentially added into the model (x axis) with the compounds noted in each iteration (y axis and colored boxes). The order of compounds added into the scores was determined by increasing absolute β values from a ridge regression. RMST P values were determined using a log-rank test.
Fig. 4.
Fig. 4.. Evaluating the MDS for predicting survival outcomes on both the training and validation cohorts.
Violin plots of the MDS for survivors and nonsurvivors in the training cohort (A) and validation cohort (C). Chisq, chi-square. Kaplan-Meier survival analyses starting from the day of admission to the ICU, stratifying patients according to their MDSs (as determined by an optimal threshold analysis) for the training cohort (B) and validation cohort (D). Chi-square tests were performed in (A) and (C) for integer values of the MDS. Kaplan-Meier survival analyses have time after ICU admission represented on the x axis in days with the probability of survival of each stratified group shown on the y axis. Survival probability is shown below each curve at 10-day intervals.
Fig. 5.
Fig. 5.. Fecal taxonomic and metabolic correlations.
(A) Nonmetric multidimensional scaling plot based on Bray-Curtis distance metric. Each dot represents an individual patient color coded by its MDS. (B) In the top panel, relative abundances for each patient are shown where taxa are grouped and colored at varying, biologically relevant taxonomic levels. The panels below show the Shannon diversity index and MDS, respectively, for each individual patient. Horizontal lines represent the threshold determined by the Youden index that optimized sensitivity and specificity for the binary outcome of 30-day mortality. (C) Plot showing the correlation between the Shannon diversity index on the y axis and the MDS on the x axis. (D) Box plots with results from MaAsLin2 differential abundance analysis at the family level uncorrected for confounders. The y axis shows the relative abundance, and the x axis shows the MDS group. In (A), homogeneity of dispersion was assessed using the Bray-Curtis distance matrix and tested via a PERMANOVA. In (C), each dot represents an individual patient. The regression line is shown, and the gray bar around the regression line represents 95% CI. R2 is calculated from linear regression, while rho is Spearman statistics with its corresponding P values to show the strength of correlation. In (D), box plots show IQRs (75%: third quartile and 25%: first quartile) where the center bolded line represents the median. The upper whisker extends from the third quartile to the largest value no further than 1.5 × IQR from the third quartile. The lower whisker extends from the first quartile to the smallest value at most 1.5 × IQR of the first quartile.

Similar articles

References

    1. Vincent J.-L., van der Poll T., Marshall J. C., The end of “one size fits all” sepsis therapies: Toward an individualized approach. Biomedicines 10, 2260 (2022). - PMC - PubMed
    1. Famous K. R., Delucchi K., Ware L. B., Kangelaris K. N., Liu K. D., Thompson B. T., Calfee C. S., ARDS Network , Acute respiratory distress syndrome subphenotypes respond differently to randomized fluid management strategy. Am. J. Respir. Crit. Care Med. 195, 331–338 (2017). - PMC - PubMed
    1. Maslove D. M., Tang B., Shankar-Hari M., Lawler P. R., Angus D. C., Baillie J. K., Baron R. M., Bauer M., Buchman T. G., Calfee C. S., Dos Santos C. C., Giamarellos-Bourboulis E. J., Gordon A. C., Kellum J. A., Knight J. C., Leligdowicz A., McAuley D. F., McLean A. S., Menon D. K., Meyer N. J., Moldawer L. L., Reddy K., Reilly J. P., Russell J. A., Sevransky J. E., Seymour C. W., Shapiro N. I., Singer M., Summers C., Sweeney T. E., Thompson B. T., van der Poll T., Venkatesh B., Walley K. R., Walsh T. S., Ware L. B., Wong H. R., Zador Z. E., Marshall J. C., Redefining critical illness. Nat. Med. 28, 1141–1148 (2022). - PubMed
    1. Agudelo-Ochoa G. M., Valdés-Duque B. E., Giraldo-Giraldo N. A., Jaillier-Ramírez A. M., Giraldo-Villa A., Acevedo-Castaño I., Yepes-Molina M. A., Barbosa-Barbosa J., Benítez-Paéz A., Gut microbiota profiles in critically ill patients, potential biomarkers and risk variables for sepsis. Gut Microbes 12, 1707610 (2020). - PMC - PubMed
    1. Schlechte J., Zucoloto A. Z., Yu I.-L., Doig C. J., Dunbar M. J., McCoy K. D., McDonald B., Dysbiosis of a microbiota–immune metasystem in critical illness is associated with nosocomial infections. Nat. Med. 29, 1017–1027 (2023). - PMC - PubMed