. 2025 Jun 6;11(23):eadt5400.
doi: 10.1126/sciadv.adt5400. Epub 2025 Jun 4.

A cell-type-specific epigenetic mechanism encodes social investigatory behavior via Lrhcn1 and Hcn1

Affiliations

A cell-type-specific epigenetic mechanism encodes social investigatory behavior via Lrhcn1 and Hcn1

Pengwei Qin et al. Sci Adv. .

Abstract

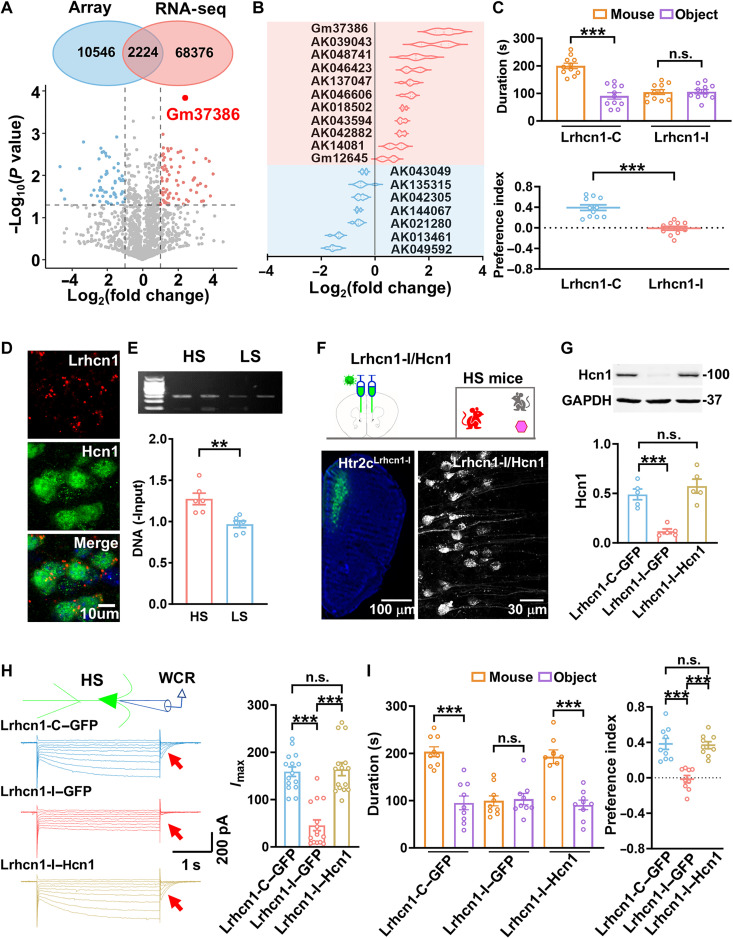
Social investigation is a complex behavior essential for understanding the surrounding world and is impaired in some major neuropsychiatric disorders. Yet, little is known about whether and, if yes, how social investigation is encoded in a specific type of cortical neurons. Here, we generated a computer vision tool to track social behavior of naïve mice and categorized them as high versus low social states. We integrated a genetically guided TRAP2 strategy with single-cell Ca2+ image and found that activity dynamics of serotonin receptor 2c (Htr2c)-expressing neurons in the prelimbic cortical layer 5 encode high social states. We uncovered a long noncoding RNA Lrhcn1 that controls Hcn1 transcription and regulates ensemble activity of Htr2c neurons, and this regulation motivates social investigation. Htr2c neurons directly and functionally project to nitric oxide synthase (Nos1) neurons in the hypothalamic nucleus. Gain- and loss-of function studies demonstrated that this projection specifically processes socially conveyed information.


Figures

Fig. 1.
Fig. 1.. Social investigation activates Htr2c neurons.
(A to C) Illustration (A), trajectory (B), and three-dimensional investigatory frames (C) of high (HS) versus low (LS) social groups; a social zone, a neutral zone, and an object zone are defined in three-chamber interaction test (also see movie S1). (D) Illustration of genetically guided TRAP2 strategy for mapping socially activated neurons in the brain. (E) Representative images showing TRAP2ed neurons in the PrL5 of HS mice. A bar graph showing the number of trapped neurons in the prelimbic cortical layer 5 (PrL5), the anterior cingulate area (ACA), infralimbic area (ILA), the NAc, the lateral septal nucleus (LS), the hippocampus (HP), the BLA, the lateral hypothalamic area (LHA), the zona incerta (ZI), midbrain reticular nucleus (MRN), the ventral tegmental area (VTA), the supra-mammillary nucleus (SUM), the mediodorsal thalamic nucleus (MD), the central medial thalamic nucleus (CM), the paraventricular nucleus of the thalamus (PVT), and paraventricular hypothalamic nucleus (PVH) of uncategorized control (Con), LS, and HS mice [n = 4 mice per group, two-way analysis of variance (ANOVA) with Dunnett’s multiple comparison: PrL5, LS versus HS mice, P < 0.0001]. (F) The co-labeling of Htr2c neurons (red) with CTIP2 (green). (G) Representative images showing trapped neurons (red) labeled with Htr2c (green) in both HS and LS mice. (H) Plot showing the number of TRAP2ed neurons in Htr2c+ neurons and Htr2c neurons of LS and HS mice (n = 13 mice per group, two-way ANOVA with Bonferroni’s multiple comparisons test: Htr2c+, HS versus LS, P < 0.0001). n.s., not significant. (I) The numbers of TRAP2ed Htr2c (left) and Htr2c+ (right) neurons in HS and LS mice are plotted against times spent in a social zone [t-SZ; n = 13 mice per group, coefficient of determination (R2) = 0.63 in LS mice and 0.91 in HS mice, P < 0.0001, Pearson’s correlation].
Fig. 2.
Fig. 2.. Ca2+ activity in Htr2c neurons encodes social investigatory behavior.
(A) Illustration and representative images showing the expression of GCaMP6m (green) in Htr2c neurons stained with anti-Htr2c (red) after the injection of the rAAV2/9-hSyn-fDIO-GCaMP6m into the PrL5 of Htr2c-FLP mice. (B) Experimental design of the miniaturized two-photo deep-brain Ca2+ imaging of Htr2cGCaMP6m neurons in a freely behaving mouse (also see movie S2). (C) Top: Activity dynamics of Htr2c neurons during the entire experimental session (13 min). Htr2c neurons are ordered by socially activated (red bar) versus nonactivated (blue bar) ensembles. Bottom: Mean ensemble activation. Dashed line, introduction of a stimulus mouse with an object into the arena. Behaviors 1 to 5: Social interaction, nonsocial interaction, object exploration, arena exploration, and others. Scale bar, 60 s. (D) Representative activity (top) and mean activation (bottom) of Htr2c neurons. Dashed line indicates start of events. Scale bar, 2 s. (E) Plots showing the maximum z-scores (n = 5 mice, P < 0.0001, one-way ANOVA) and the mean z-scores (n = 5 mice per group, P < 0.0001, one-way ANOVA) in approaching (n = 51 events) to, sniffing (n = 74 events), or chasing (n = 43 events) a novel conspecific mouse or exploring the arena (n = 55 events) and the novel object (n = 51 events). (F) Experimental schedule and a plot showing the number of activated Htr2c neurons across two experimental sessions (n = 82 to 98 social events per 5 mice, P = 0.17, t test). (G) Correlation between activity of Htr2c neurons and mean activity of social investigation ensemble in session 1 versus session 2 (n = 186 neurons, R = 0.73, P < 0.0001, Pearson’s correlation).
Fig. 3.
Fig. 3.. Activation of Htr2c neurons mediates social investigation.
(A) Experimental schedule (top), representative image of hM4Di in Htr2c neurons (Htr2chM4Di neurons), spontaneous action potential firings from Htr2chM4Di neurons before and after application of CNO, and a plot showing that application of CNO inhibits action potential firings in Htr2chM4Di neurons (n = 19 recordings per 4 mice, P < 0.0001, t test). ip, intraperitoneally; h, hours. (B) Inactivation of Htr2c neurons inhibits social investigation of HS mice. Plots showing the duration of mouse and object exploration (n = 11 mice per group, two-way ANOVA with Tukey’s multiple comparisons test: Htr2ctdT-CNO, mouse versus object, P < 0.0001; Htr2chM4Di-CNO, mouse versus object, P = 0.98; Htr2chM4Di-saline, mouse versus object, P < 0.0001) and the preference index (P < 0.0001, one-way ANOVA with Tukey’s multiple comparisons test) after application of CNO or saline in Htr2chM4Di or Htr2ctdT mice. (C) Experimental schedule, representative image of hM3Dq expression in Htr2c neurons (Htr2chM3Dq neurons), and action potential firings from Htr2chM3Dq neurons in response to CNO (n = 15 recordings per 5mice, P < 0.0001, t test). (D) Activation of Htr2c neurons enhances social investigation of LS mice. Plots showing the duration of mouse and object exploration (n = 11 mice per group, two-way ANOVA with Tukey’s multiple comparisons test: Htr2cGFP-CNO, mouse versus object, P = 0.23; Htr2chM3Dq-CNO, mouse versus object, P < 0.0001; Htr2chM3Dq-saline, mouse versus object, P = 0.36) and the preference index (P < 0.0001, one-way ANOVA with Tukey’s multiple comparisons test) after application of CNO or saline in Htr2chM3Dq or Htr2cGFP mice.
Fig. 4.
Fig. 4.. Lrhcn1 knockdown in Htr2c neurons inhibits social investigation in HS mice.
(A) Microarray (array) and RNA-seq (pink) assays (top) and volcano plot (bottom) showing significantly difference of 2224 lncRNA transcripts in Htr2c neurons of HS mice, compared with those of LS mice. (B) Differences of 18 lncRNA transcripts in Htr2c neurons between HS and LS mice (n = 9 mice). (C) The duration of mouse and object exploration in HS mice after the expression of a scrambled control (Lrhcn1-C) and small interfering RNA specifically inhibiting Lrhcn1(Lrhcn1-I, n = 11 mice per group, two-way ANOVA with Tukey’s multiple comparisons test: Lrhcn1-C, mouse versus object, p < 0.0001; Lrhcn1-I, mouse versus object, P = 0.99) and the preference index (P < 0.0001, t test). (D) Representative image showing FISH of Lrhcn1 (red) with Hcn1 (green) in Htr2c neurons of HS mice. (E) The physical association of Lrhcn1 with Hcn1 promoter in Htr2c neurons (n = 6 mice per group, P = 0.003, t test). (F) The expression of Lrhcn1-I and Hcn1 in Htr2c neurons. (G) The Hcn1 protein levels after the expression of Lrhcn1-C–GFP, Lrhcn1-I–GFP, or Lrhcn1-I–Hcn1 in the PrL5 region of Htr2c-FLP HS mice (n = 5 mice per group, P = 0.0001, one-way ANOVA). GAPDH, glyceraldehyde-3-phosphate dehydrogenase. (H) The hyperpolarization-activated currents by voltage-clamp steps from −50 to −130 mV with 10-mV increments. Tail currents are plotted (n = 15 recordings per 5 mice per group, P < 0.0001, one-way ANOVA). WCR, whole-cell patch-clamp record; Imax, maximum tail current. (I) The duration of mouse and object exploration in HS mice with the expression of Lrhcn1-C–GFP, Lrhcn1-I–GFP, or Lrhcn1-I–Hcn1 in the PrL5 region (n = 9 mice per group, two-way ANOVA with Tukey’s multiple comparisons test: Lrhcn1-C–GFP, mouse versus object, P < 0.0001; Lrhcn1-I–GFP, mouse versus object, P = 0.97; Lrhcn1-I–Hcn1, mouse versus object, P < 0.0001) and the preference index (P < 0.0001, one-way ANOVA).
Fig. 5.
Fig. 5.. Expression of Lrhcn1 in Htr2c neurons promotes social investigation of LS mice.
(A) Experimental schedule (top) and Hcn1 mRNA levels in Htr2c neurons after the injection of the rAAV2/9-hSyn-fDIO-GFP (control), the rAAV2/9–hSyn–fDIO–Lrhcn1–IRES–Hcn1-C (Lrhcn1/Hcn1-C), and the rAAV2/9–hSyn–fDIO–Lrhcn1–IRES–Hcn1-I (Lrhcn1/Hcn1-I) virus into the PrL5 of Htr2c-FLP LS mice (n = 5 mice per group, P = 0.005, one-way ANOVA). (B) The Hcn1 protein levels in Htr2c neurons expressing control, Lrhcn1/Hcn1-C, or Lrhcn1/Hcn1-I in LS mice (n = 5 mice per group, P = 0.002, one-way ANOVA). (C) The hyperpolarization-activated currents in Htr2c neurons with the expression of Lrhcn1-C–GFP, Lrhcn1-I–GFP, or Lrhcn1-I–Hcn1 (n = 15 recordings per 5 mice per group, P < 0.0001, one-way ANOVA). (D) Two-photo deep-brain Ca2+ imaging of Htr2cGCaMP6m neurons in freely behaving LS mice. (E) Ca2+ activity (top) of Htr2c neurons that are ordered by socially activated (red bar) versus nonactivated (blue bar) events and mean Ca2+ activity (bottom) during social interaction test in Lrhcn1/Hcn1-I LS mice. Dashed line, introduction of a stimulus mouse with an object. Scale bar, 60 s. (F) Plots showing the numbers (P < 0.0001, one-way ANOVA), the maximum (P < 0.0001, one-way ANOVA), and mean (P < 0.0001, one-way ANOVA) z-scores of Ca2+ activity in Htr2c neurons with the expression of control (n = 124 social event per 5 mice), Lrhcn1–Hcn1-C (n = 162 social events/5 mice), or Lrhcn1–Hcn1-I (n = 113 social events per 5 mice) in LS mice. (G) The duration of mouse and object exploration of the LS mice with the expression of control, Lrhcn1–Hcn1-C, or Lrhcn1–Hcn1-I (n = 11 mice per group, two-way ANOVA with Tukey’s multiple comparisons test: control, mouse versus object, P = 0.6; Lrhcn1/Hcn1-C, mouse versus object, P < 0.0001; Lrhcn1/Hcn1-I, mouse versus object, P = 0.59) and the preference index (P = 0.0009, one-way ANOVA with Tukey’s multiple comparisons test).
Fig. 6.
Fig. 6.. Htr2c→SUM projection mediates social investigation.
(A) A representative image showing ChR2 expression in Htr2c neurons (Htr2cChR2). (B and C) Representative images (B) and a plot (C) showing activated neurons in the SUM, the VTA, and the MRT, but not in the other brain regions of Htr2cChR2 mice, following delivery of blue lase lights (n = 4 mice per group, two-way ANOVA with Tukey’s multiple comparisons test: Htr2cGFP versus Htr2cChR2: SUM, P < 0.0001; VTA, P = 0.013; MRT, P = 0.0014). (D) The duration of mouse and object exploration in Htr2cGFP and Htr2cChR2 LS mice (n = 11 mice per group, two-way ANOVA with Tukey’s multiple comparisons test: Htr2cGFP, mouse versus object, P = 0.37; Htr2cChR2, mouse versus object, P < 0.0001) and the preference index (P = 0.07, t test). (E) The time spent moving (n = 11 mice per group, P = 0.8, t test) and the distance traveled (n = 11 mice per group, P = 0.75, t test) in the arena during 10-min experimental session. (F) The duration of mouse and object exploration in Htr2cGFP and Htr2cChR2 LS mice (n = 11 mice per group, two-way ANOVA with Tukey’s multiple comparisons test: Htr2cGFP, mouse versus object, P = 0.72; Htr2cChR2, mouse versus object, P = 0.67) and the preference index (P = 0.23, t test). (G) The duration of mouse and object exploration in Htr2cGFP and Htr2cChR2 LS mice (n = 11 mice per group, two-way ANOVA with Tukey’s multiple comparisons test: Htr2cGFP, mouse versus object, P = 0.76; Htr2cChR2, mouse versus object, P = 0.59) and the preference index (P = 0.78, t test).
Fig. 7.
Fig. 7.. A cell-type–specific cortical-subcortical circuit for social investigation.
(A) The expression of ChR2 in Htr2c neurons and whole-cell patch clamp recordings from Nos1GFP neurons. The synaptic responses were evoked by delivery of blue laser lights (BLL) onto axon terminals of Htr2cChR2 neurons. (B and C) Representatives (B) and plot (C) showing the EPSCs recorded at −70 mV, blocked by TTX, reversed by 4-AP, and were sensitive to CNQX (n = 15 recordings per 5mice, one-way ANOVA with Tukey’s multiple comparisons test: control versus TTX, P < 0.0001; TTX versus TTX and 4-AP-CNQX, P < 0.0001). (D) Experimental schedule (top) for terminal inhibition of Htr2c projection to Nos1 neurons. Whole-cell patch clamp (bottom) showing that the EPSCs of Nos1GFP neurons were inhibited by bath application of CNO (n = 18 recordings per 6 mice). The representative traces are taken before (0), during (i) and after (ii) CNO application. (E) The duration of mouse and object exploration in Htr2chM4Di or Htr2ctdT HS mice after application of CNO or saline (n = 11 mice per group, two-way ANOVA with Tukey’s multiple comparisons test: Htr2ctdT-CNO, mouse versus object, P < 0.0001; Htr2chM4Di-CNO, mouse versus object, P = 0.99; Htr2chM4Di-saline, mouse versus object, P < 0.0001) and the preference index (P < 0.0001, one-way ANOVA). (F) Experimental schedule for DREADD inhibition of Htr2c neurons and optogenetic activation of Nos1 neurons, representative image of ChR2 expression in Nos1 neurons, and action potential firings from Nos1 neurons in response to optogenetic activation. DC, depolarizing currents. h, hours. (G) The duration of mouse and object exploration in four groups of mice (n = 11 mice per group, two-way ANOVA with Tukey’s multiple comparisons test: Htr2chM4DiNos1tdT, mouse versus object, P = 0.91; Htr2cGFPNos1tdT, Htr2cGFPNos1ChR2, and Htr2chM4DiNos1ChR2, mouse versus object, P < 0.0001) and the preference index (P < 0.0001, one-way ANOVA).

References

    1. Cléry J. C., Hori Y., Schaeffer D. J., Menon R. S., Everling S., Neural network of social interaction observation in marmosets. eLife 10, e65012 (2021). - PMC - PubMed
    1. Kingsbury L., Huang S., Wang J., Gu K., Golshani P., Wu Y. E., Hong W., Correlated neural activity and encoding of behavior across brains of socially interacting animals. Cell 178, 429–446.e16 (2019). - PMC - PubMed
    1. Phillips M. L., Robinson H. A., Pozzo-Miller L., Ventral hippocampal projections to the medial prefrontal cortex regulate social memory. eLife 8, e44182 (2019). - PMC - PubMed
    1. Baeyens F., Vansteenwegen D., De Houwer J., Crombez G., Observational conditioning of food valence in humans. Appetite 27, 235–250 (1996). - PubMed
    1. Hopper L. M., Lambeth S. P., Schapiro S. J., Whiten A., Observational learning in chimpanzees and children studied through ‘ghost’ conditions. Proc. Biol. Sci. 275, 835–840 (2008). - PMC - PubMed

MeSH terms

Substances

LinkOut - more resources