. 2025 Jun 6;11(23):eadu4417.
doi: 10.1126/sciadv.adu4417. Epub 2025 Jun 4.

Low-dose radiation by radiopharmaceutical therapy enhances GD2 TRAC-CAR T cell efficacy in localized neuroblastoma

Affiliations

Low-dose radiation by radiopharmaceutical therapy enhances GD2 TRAC-CAR T cell efficacy in localized neuroblastoma

Quaovi H Sodji et al. Sci Adv. .

Abstract

Chimeric antigen receptor (CAR) T cells have limited efficacy against solid tumors including neuroblastoma. Here, we evaluated whether low-dose radiation delivered by radiopharmaceutical therapy (RPT), known to potentiate immune checkpoint inhibitors, can synergize with CRISPR-edited GD2 TRAC-CAR T cells to improve outcomes in neuroblastoma. We found that in the localized model of neuroblastoma, low-dose radiation delivered by 177Lu-NM600, an alkylphosphocholine mimetic RPT agent, followed 9 days later by GD2 TRAC-CAR T cells led to complete tumor regression. Irradiation of neuroblastoma before GD2 TRAC-CAR T cells enhanced the release by CAR T cells of perforin, granzyme B, tumor necrosis factor-α, and interleukin-7 while abrogating transforming growth factor-β1. Low-dose RPT up-regulated the death receptor Fas on neuroblastoma, potentially enabling CAR-independent killing. This suggests that low-dose RPT can enhance suboptimal CAR T cell efficacy against solid tumors. However, optimization of radiation dose and timing may be needed for each patient and RPT agent to account for varied tumor radiosensitivity and dosimetry.


Figures
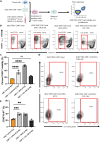
Fig. 1.
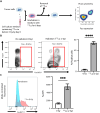
Fig. 1.. Antigen stimulation of GD2 TRAC-CAR T cells mitigates the deleterious effect of 177Lu radionuclide exposure on CAR T cell viability.
(A) CHLA-20 cells were cocultured with GD2 TRAC-CAR T cells at an E:T ratio of 10:1 in medium containing 177Lu activity capable of delivering 2 Gy to all cells. After 3 days, 177Lu was removed and CAR T cell viability was assessed by flow cytometry. (B) Representative contour plot illustrating the viability of irradiated (2 Gy) GD2 TRAC-CAR T cells (CD45+) cocultured with GD2+ tumors (CHLA-20 and M21) and a GD2− tumor (CCL-136). (C) Viability of GD2 TRAC-CAR T cells exposed to 177Lu radionuclide after antigen-dependent versus antigen-independent stimulation. (D) Representative contour plot illustrating the proliferation (Ki-67 expression) of irradiated GD2 TRAC-CAR T cells in the presence of GD2+ or GD2− tumors. (E) Antigen stimulation of GD2 TRAC-CAR T cells during irradiation results in CAR T cell proliferation, evidenced by increased Ki-67 expression. **P = 0.0015; ***P = 0.0009; ****P < 0.0001. Error bars indicate SD. ns, not significant.
Fig. 2.
Fig. 2.. Radiation delivered by 177Lu to neuroblastoma cells enhances their vulnerability to GD2 TRAC-CAR T cell–mediated killing and stimulates cytokine secretion.
(A) CHLA-20 cells were cultured in a medium containing 177Lu, delivering 2 Gy of radiation to tumor cells by day 6. Following radiation delivery, 177Lu was removed and tumor viability was determined using a trypan blue assay. Viable CHLA-20 cells, irradiated and nonirradiated, were then cocultured with GD2 TRAC-CAR T cells at a 10:1 E:T ratio for 24 hours, and tumor viability was measured by flow cytometry. (B) Viability of irradiated CHLA-20 cells after coculture with GD2 TRAC-CAR T cells compared to radiation or TRAC-CAR T cells alone. **P = 0.0027; ***P = 0.0003; ****P < 0.0001. (C) Secretion of T helper 1 cytokines TNF-α and IFN-γ and (D) T helper 2 cytokines IL-4 and IL-13 by GD2 TRAC-CAR T cells after their coculture with irradiated CHLA-20 cells compared to nonirradiated CHLA-20 cells. TNF-α: *P = 0.0126; **P = 0.0076; ***P = 0.0003. IFN-γ: *P = 0.0176; **P = 0.0051. IL-4: *P = 0.0150; **P = 0.0017. IL-13: *P = 0.0186. Error bars indicate SD.
Fig. 3.
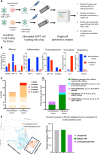
Fig. 3.. NM600 RPT delivers 177Lu to a human neuroblastoma xenograft mouse model.
(A) Structure of unbound NM600 and NM600 chelating 177Lu (177Lu-NM600). (B) Flank CHLA-20 tumor–bearing NRG mice received 177Lu-NM600 (500 μCi) intravenously, and serial SPECT/CT scans were performed after 3, 24, 96, and 168 hours (hrs). After 180 hours, the mice were euthanized and ex vivo biodistribution of 177Lu-NM600 was evaluated. (C) Representative maximum intensity projection SPECT/CT of 177Lu-NM600 in a CHLA-20 tumor–bearing NRG mouse. sc, subcutaneously. (D) Ex vivo biodistribution of 177Lu-NM600 in the CHLA-20 xenograft model 180 hours after intravenous injection of 177Lu-NM600. (E) The highest radiation dose of 100 μCi used for subsequent in vivo studies is not associated with end-organ toxicities including hepatotoxicity [ALP (alkaline phosphatase), ALT (alanine transaminase), GGT (γ-glutamyl transferase), TBILI (total bilirubin), ALB (albumin), and CHOL (cholesterol)], bone marrow toxicity [WBC (white blood cells), LYM (lymphocytes), MON (monocytes), and NEU (neutrophils)], and nephrotoxicity [BUN (blood urea nitrogen)]. (F) A low dose of 177Lu-NM600 (50 μCi) promotes angiogenesis in the TME. *P = 0.0355; ***P = 0.0002. Error bars indicate SD.
Fig. 4.
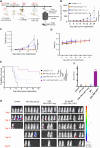
Fig. 4.. Low mean tumor dose of 1.8 Gy delivered in vivo by 177Lu-NM600 enhances GD2 TRAC-CAR T cell cytotoxicity against a localized human xenograft model of neuroblastoma and improves overall survival.
(A) Experimental scheme: 107 CHLA-20 cells were subcutaneously injected on the right flank of NRG mice. Tumor implantation was confirmed by IVIS, and mice were randomized into four groups: control (PBS: n = 4), low-dose RPT alone (1.8 Gy, n = 5), GD2 TRAC-CAR T cells alone (3 × 10⁶ CAR+ cells), and low-dose RPT followed by GD2 TRAC-CAR T cells (n = 8) delivered 9 days post-RPT. The treatment effect was assessed by measuring tumor volume and bioluminescence. Treatment-related toxicity measured by tracking weight loss and behavioral assessments. (B) Tumor volumes between the control group, monotherapy groups, and combination therapy. Complete tumor regression by combination therapy was observed by day 29 posttumor injection (*P < 0.012; **P = 0.0087). (C) Total flux (p/s) of tumors as measured by IVIS. The total flux was statistically lower in the combination group than in either monotherapy by day 29 posttumor injection (two-way ANOVA with Dunnett’s multiple comparisons test; *P < 0.01; ****P < 0.0001). (D) The weight of each mouse was averaged for each group over time. (E) Kaplan-Meier curves: All mice (eight of eight) in the combination group were alive 125 days posttumor injection compared to one of five mice in either monotherapy group (**P = 0.0019; ***P = 0.0002). (F) CR in each treatment group at day 125 posttumor injection. All mice (eight of eight) had persistent CR in the combination group compared to one of five mice in the low-dose RPT alone group and none in the control and GD2 TRAC-CAR T cell groups. (G) Representative bioluminescence (radiance: p/sec per square centimeter per steradian) images of all treatment groups. The control and GD2 TRAC-CAR T–only group images in this figure are intentionally duplicated (same experimental design).
Fig. 5.
Fig. 5.. Low mean tumor dose radiation of 3.6 Gy delivered in vivo by 177Lu-NM600 improves the efficacy of GD2 TRAC-CAR T cells against a localized human xenograft model of neuroblastoma.
(A) 107 CHLA-20 cells were subcutaneously injected on the right flank of NRG mice. Tumor implantation was confirmed by IVIS, and mice were randomized into four groups: control (PBS: n = 4), 3.6 Gy of RPT alone (n = 5), GD2 TRAC-CAR T alone (3 × 10⁶ cells), and 3.6 Gy of RPT followed by GD2 TRAC-CAR T cells (n = 8) delivered 9 days post-RPT. The treatment effect was assessed by measuring tumor volume and bioluminescence. Treatment-related toxicity measured by tracking weight loss and behavioral assessment. (B) Tumor volumes between the control group, monotherapy groups, and combination therapy. Day 29 posttumor injection, the combination led to significant tumor regression compared to the control and GD2 TRAC-CAR T cell alone groups (*P = 0.015; **P = 0.009). (C) The tumor total flux (p/s) was significantly lower in the combination group than in GD2 TRAC-CAR T cell alone and control groups by day 29 posttumor injection (two-way ANOVA with Dunnett’s multiple comparisons test; *P = 0.023; ****P < 0.0001) but not statistical different from the 3.6-Gy monotherapy group. (D) Weights were averaged in each group over time. (E) Kaplan-Meier curves: 62.5% of mice (five of eight) in the combination group were alive 125 days posttumor injection compared to zero of five mice in either monotherapy group (*P < 0.035; **P = 0.0027; ***P = 0.0002). (F) CR in each treatment group at day 125 posttumor injection. Five of eight mice had persistent CR in the combination group compared to none in all other groups. (G) Representative bioluminescence (radiance: p/sec per square centimeter per steradian) images of all treatment groups. The control and GD2 TRAC-CAR T–only group images in this figure are intentionally duplicated (same experimental design).
Fig. 6.
Fig. 6.. In vivo tumor irradiation with 1.8-Gy mean tumor dose enhances GD2 TRAC-CAR T cell infiltration in the TME of human neuroblastoma xenograft models.
(A) NRG mice bearing large CHLA-20 tumor (~200 mm3) were treated either with GD2 TRAC-CAR T cells or with the combination of 1.8-Gy mean tumor dose from RPT followed by CAR T cell infusion delivered 9 days later. Five days after CAR T cell infusion, the mice were euthanized and the number (#) of GD2 TRAC-CAR T cells (B) per gram of tumor and (C) in the whole spleen was analyzed by flow cytometry. A 1.8-Gy mean tumor dose from RPT yielded an approximately twofold increase in infiltration of GD2 TRAC-CAR T cells in the TME compared to administering GD2 TRAC-CAR T cells alone (**P = 0.0052). No statistical difference in GD2 TRAC-CAR T cells was noted in the spleen with either treatment.
Fig. 7.
Fig. 7.. Irradiation of neuroblastoma induces a polyfunctional phenotype in CD8+ GD2 TRAC-CAR T cells.
(A) CD8+ GD2 TRAC-CAR T cells were cocultured with irradiated or nonirradiated CHLA-20 tumor cells at an E:T ratio of 1:2 for 20 hours. The CD8+ GD2 TRAC-CAR T cells were stained and loaded onto an IsoCode chip, and the single-cell secretome was measured for 16 hours. (B) The relative fluorescence intensity (RFU) of selected cytokines/chemokines, categorized as effector, inflammatory, chemoattractive, stimulatory, or regulatory, was measured. (C) Number of individual proteins or analytes secreted by a single CAR T cell. (D) PSI of CD8+ GD2 TRAC-CAR T cells when cocultured with irradiated tumor cells versus nonirradiated tumor cells. (E) 3D UMAP visualization of CD8+ GD2 TRAC-CAR T cells under different coculture conditions. CD8+ GD2 TRAC-CAR T cells cocultured with irradiated tumor display a distinctive and characteristic proteomic phenotype. ND, not detected.
Fig. 8.
Fig. 8.. Irradiation of GD2+ neuroblastoma cells by 177Lu up-regulates Fas expression.
(A) CHLA-20 cells were incubated with 177Lu sufficient to deliver 2 Gy by day 6. Fas expression on tumor cells was evaluated by flow cytometry. (B) Fas expression on irradiated neuroblastoma cells was significantly higher than that on nonirradiated neuroblastoma cells. ****P < 0.0001. (C) The mean fluorescence intensity (MFI) of Fas on irradiated neuroblastoma cells was also much higher compared to nonirradiated neuroblastoma cells. ***P = 0.0005.

References

    1. Maude S. L., Laetsch T. W., Buechner J., Rives S., Boyer M., Bittencourt H., Bader P., Verneris M. R., Stefanski H. E., Myers G. D., Qayed M., De Moerloose B., Hiramatsu H., Schlis K., Davis K. L., Martin P. L., Nemecek E. R., Yanik G. A., Peters C., Baruchel A., Boissel N., Mechinaud F., Balduzzi A., Krueger J., June C. H., Levine B. L., Wood P., Taran T., Leung M., Mueller K. T., Zhang Y., Sen K., Lebwohl D., Pulsipher M. A., Grupp S. A., Tisagenlecleucel in children and young adults with B-cell lymphoblastic leukemia. N. Engl. J. Med. 378, 439–448 (2018). - PMC - PubMed
    1. Neelapu S. S., Locke F. L., Bartlett N. L., Lekakis L. J., Miklos D. B., Jacobson C. A., Braunschweig I., Oluwole O. O., Siddiqi T., Lin Y., Timmerman J. M., Stiff P. J., Friedberg J. W., Flinn I. W., Goy A., Hill B. T., Smith M. R., Deol A., Farooq U., McSweeney P., Munoz J., Avivi I., Castro J. E., Westin J. R., Chavez J. C., Ghobadi A., Komanduri K. V., Levy R., Jacobsen E. D., Witzig T. E., Reagan P., Bot A., Rossi J., Navale L., Jiang Y., Aycock J., Elias M., Chang D., Wiezorek J., Go W. Y., Axicabtagene ciloleucel CAR T-cell therapy in refractory large B-cell lymphoma. N. Engl. J. Med. 377, 2531–2544 (2017). - PMC - PubMed
    1. Teoh P. J., Chng W. J., CAR T-cell therapy in multiple myeloma: More room for improvement. Blood Cancer J. 11, 84 (2021). - PMC - PubMed
    1. Tomasik J., Jasiński M., Basak G. W., Next generations of CAR-T cells - New therapeutic opportunities in hematology? Front. Immunol. 13, 1034707 (2022). - PMC - PubMed
    1. Patel U., Abernathy J., Savani B. N., Oluwole O., Sengsayadeth S., Dholaria B., CAR T cell therapy in solid tumors: A review of current clinical trials. EJHaem 3, 24–31 (2022). - PMC - PubMed

MeSH terms