. 2025 Jun 6;11(23):eads1624.
doi: 10.1126/sciadv.ads1624. Epub 2025 Jun 4.

Subpolar North Atlantic cooling reinforced by colder, drier atmosphere with a weakening Atlantic meridional overturning circulation

Affiliations

Subpolar North Atlantic cooling reinforced by colder, drier atmosphere with a weakening Atlantic meridional overturning circulation

Yifei Fan et al. Sci Adv. .

Abstract

In contrast to global warming, the subpolar North Atlantic has experienced long-term cooling throughout the 20th century. This cooling, known as the North Atlantic cold blob, has been hypothesized to arise from reduced poleward oceanic heat transport associated with a slowdown of the Atlantic meridional overturning circulation (AMOC). Here, by diagnosing historical simulations from multiple coupled climate models, we find that ocean heat transport is not the only pathway through which the AMOC modulates sea surface temperature variability. A weakened AMOC is also associated with colder, drier lower atmospheric conditions, which lead to a reduction in surface warming expected from increasing amounts of heat-trapping gases by reducing downward clear-sky longwave radiation at the surface. This radiative pathway and the oceanic processes contribute equally to the North Atlantic cold blob. These results highlight the importance of the AMOC's impact on atmospheric properties and their radiative effects.


Figures

Fig. 1.
Fig. 1.. The Subpolar North Atlantic SST trend, the AMOC trend, and the intermodel relationship between the two.
(A) Observed linear SST trends from 1900 to 2014, estimated as the average of ERSSTv5, HadISST, and Kaplan SSTs (Materials and Methods). (B) Same as (A) but for the multimodel means (MMMs) across the 11 cold blob (CB) models. (C) Same as (B) but for the MMMs across the nine warm blob (WB) models. The magenta box in [(A) to (C)] represents the domain of the subpolar North Atlantic. (D) Time series of subpolar North Atlantic (SPNA) SST anomalies in the observations (black), the CB-MMMs (blue), and the WB-MMMs (red). For observations, the SPNA regional mean is calculated over the domain of 25°W-45°W and 50°N-60°N, as shown by the box in (A); for CB- and WB-MMMs, it is calculated over the domain of 25°W-45°W and 45°N-55°N, as shown by the box in [(B) and (C)]. (E) Time series of AMOC index anomalies averaged across the CB models (blue) and the WB models (red). Linear regressions (dashed lines) and corresponding 95% confidence intervals (shading) for the data in [(D) and (E)] are also illustrated. The linear trends and their corresponding SDs are provided in the legends. (F) Simulated subpolar North Atlantic SST trend versus AMOC trend for each model, together with the linear regression (dashed line) across models, associated 95% confidence interval (shading), and explained variance (R2). Colors indicate model equilibrium climate sensitivity (ECS) values, and models with no available ECS value are marked by gray. The CB and WB models are shown by the small dots and squares, respectively. The CB-MMM and the WB-MMM are indicated by the large dot and square, respectively.
Fig. 2.
Fig. 2.. SST trends induced by the seven different physical processes.
The (A) CB-MMM and (B) WB-MMM SST trends, (C) the CB-MMM minus WB-MMM differences in simulated SST trends, and (D) the differences in SST trends regressed on the AMOC index trend. From left to right are the seven partial temperature changes due to changes in surface albedo feedback (T1), surface longwave cloud radiative forcing (T2), surface shortwave cloud radiative forcing (T3), surface clear-sky downward shortwave irradiance (T4), surface clear-sky downward longwave irradiance (T5), ocean heat transport convergence (T6), and surface latent heat and sensible heat fluxes (T7). Values in the Labrador Sea and the Nordic Seas are masked because the decomposition error can be non-negligible in these ice-present regions. The hatching in [(C) and (D)] indicates where the CB-MMM minus WB-MMM differences are not statistically significant at the 95% confidence level, estimated via a bootstrapping method.
Fig. 3.
Fig. 3.. Total SST trends and SST trends induced by oceanic and radiative processes.
(A) CB-MMM SST trends, (B) WB-MMM SST trends, (C) CB-MMM minus WB-MMM differences in SST trends, and (D) the differences in SST trends regressed on the AMOC index trend. From left to right are the sum of all terms (total), the sum of T6 and T7 (oceanic), and the sum of T2, T3, T4, and T5 (radiative). The hatching in [(C) and (D)] indicates where the CB-MMM minus WB-MMM differences are not statistically significant at the 95% confidence level. The magenta box in each panel represents the location of the subpolar North Atlantic domain, and the numbers shown at the top right are corresponding domain averages.
Fig. 4.
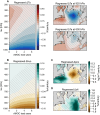
Fig. 4.. The estimated fingerprints of the AMOC on SSTs through different physical processes.
(A) The CB-MMMs (top row) and WB-MMMs (bottom row) of the decomposed SST anomalies regressed on the AMOC index anomalies (see Materials and Methods; unit: K/Sv). From left to right are the SST anomalies associated with one Sverdrup of AMOC change induced by the surface albedo feedback (T1), surface longwave cloud radiative forcing (T2), surface shortwave cloud radiative forcing (T3), surface clear-sky downward shortwave irradiance (T4), surface clear-sky downward longwave irradiance (T5), ocean heat transport convergence (T6), and surface latent heat and sensible heat fluxes (T7). (B) From left to right are the sum of all terms (total), the sum of T6 and T7 (oceanic), and the sum of T2, T3, T4, and T5 (radiative). (C) The subpolar North Atlantic regional means of the regressed SST anomalies.
Fig. 5.
Fig. 5.. CB-MMM minus WB-MMM differences in the subpolar North Atlantic regional mean SST trends.
(A) The subpolar North Atlantic regional means of partial temperature changes, with radiative terms (T2 to T5) and oceanic terms (T6 and T7) shown by pink and blue bars, respectively. The total SST trend is indicated by the dark blue line. (B) Sums of the radiative terms (pink) and the oceanic terms (blue) in (A). The stippling in (A) and (B) represents the corresponding partial temperature changes obtained from the AMOC regression or, in other words, the portion of the temperature changes that is explainable by the AMOC trend.
Fig. 6.
Fig. 6.. CB-MMM minus WB-MMM differences in AMOC’s imprint on the atmosphere.
(A) Subpolar North Atlantic domain mean air temperature trends (ΔTa; unit: K/century) regressed on the AMOC index trend. Left: Subpolar North Atlantic domain mean air temperature trends regressed on AMOC index trends with the AMOC leading the air temperature by different numbers of years. Right: The regressed trends at 925 and 500 hPa when the AMOC leads by 3 years. (B) Subpolar North Atlantic domain mean specific humidity trends (Δhus; unit: ‰/century) regressed on the AMOC index trend with the AMOC leading the specific humidity by different numbers of years. (C) Trends in water vapor path (vertically integrated through the atmospheric column) regressed on the AMOC index trend with the AMOC leading by 3 years (Δprw; unit: kg/m2/century). (D) Same as (C) but for trends in cloud area fraction for the whole atmospheric column (Δclt; unit: %/century). The hatching indicates that the CB-MMM minus WB-MMM difference is not statistically significant at the 95% confidence level.

Similar articles

References

    1. Intergovernmental Panel on Climate Change (IPCC), “Framing and Context” in Global Warming of 1.5°C: IPCC Special Report on Impacts of Global Warming of 1.5°C above Pre-Industrial Levels in Context of Strengthening Response to Climate Change, Sustainable Development, and Efforts to Eradicate Poverty (Cambridge Univ. Press, 2022), pp. 49–92.
    1. Li L., Lozier M. S., Li F., Century-long cooling trend in subpolar North Atlantic forced by atmosphere: An alternative explanation. Clim. Dyn. 58, 2249–2267 (2022).
    1. Fan Y., Liu W., Zhang P., Chen R., Li L., North Atlantic Oscillation contributes to the subpolar North Atlantic cooling in the past century. Clim. Dyn. 61, 5199–5215 (2023).
    1. Drijfhout S., van Oldenborgh G. J., Cimatoribus A., Is a decline of AMOC causing the warming hole above the North Atlantic in observed and modeled warming patterns? J. Clim. 25, 8373–8379 (2012).
    1. Kim H., An S.-I., On the subarctic North Atlantic cooling due to global warming. Theor. Appl. Climatol. 114, 9–19 (2013).

LinkOut - more resources