. 2025 Jun 4;16(1):5189.
doi: 10.1038/s41467-025-60328-w.

Intracellular accumulation of amyloid-ß is a marker of selective neuronal vulnerability in Alzheimer's disease

Affiliations

Intracellular accumulation of amyloid-ß is a marker of selective neuronal vulnerability in Alzheimer's disease

Alessia Caramello et al. Nat Commun. .

Abstract

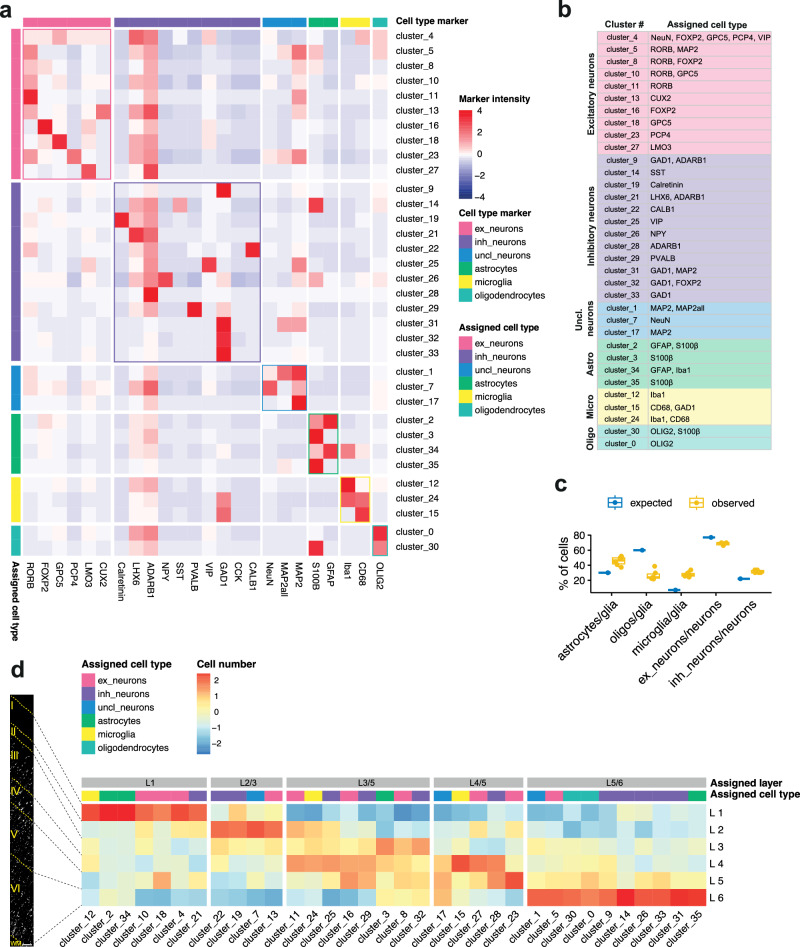
Defining how amyloid-β and pTau together lead to neurodegeneration is fundamental to understanding Alzheimer's disease (AD). We used imaging mass cytometry to identify neocortical neuronal subtypes lost with AD in post-mortem brain middle temporal gyri from non-diseased and AD donors. Here we showed that L5,6 RORB+FOXP2+ and L3,5,6 GAD1+FOXP2+ neurons, which accumulate amyloid-β intracellularly from early Braak stages, are selectively vulnerable to degeneration in AD, while L3 RORB+GPC5+ neurons, which accumulate pTau but not amyloid-β, are not lost even at late Braak stages. We discovered spatial associations between activated microglia and these vulnerable neurons and found that vulnerable RORB+FOXP2+ neuronal transcriptomes are enriched selectively for pathways involved in inflammation and glycosylation and, with progression to AD, also protein degradation. Our results suggest that the accumulation of intraneuronal amyloid-β, which is associated with glial inflammatory pathology, may contribute to the initiation of degeneration of these vulnerable neurons.


Conflict of interest statement

Competing interests: This study was partly funded by Biogen. PMM has received consultancy fees from Sudo Biosciences, Ipsen Biopharm Ltd., Rejuveron Therapeutics, Nimbus Therapeutics and Biogen. He has received honoraria or speakers’ fees from Novartis and Biogen and has received research or educational funds from BMS, Biogen, Novartis, Invicro and Nimbus Therapeutics. The remaining authors declare no competing interests.

Figures

Fig. 1
Fig. 1. Use of imaging mass cytometry (IMC) for identification of neuronal and glial subtypes in human post-mortem brain.
a FFPE sections of MTG from 12 non-disease controls and 31 AD cases were processed for IMC. Depending on the analysis, samples were divided based on expression of TREM2 common allele (CV) or TREM2 risk variants (R62H and R47H) and Braak stages. b List of candidate neuronal markers tested in developing the IMC antibody panel with their expected cortical distributions in middle temporal gyrus (MTG), prefrontal cortex (PFC), and entorhinal cortex (EC) layer II, previous associations with neuronal vulnerability, and corresponding references. Antibodies included in the final panel are indicated in red. c Example of IMC images obtained from one region of interest (ROI) processed with the final antibody panel. Each ROI ablated spans the entire thickness of the neocortex cortex (L1-L6). d A cartoon illustrating the full methodological pipeline from antibody testing (first by immunofluorescence microscopy [IF] and then using IMC), staining and ablation of full sample cohort, automated image analysis using SIMPLI (see Methods) to final data analysis in R. Graphics were created in BioRender (Caramello, A. (2025) https://BioRender.com/z22okvn). Scale bars in c represent 100 μm.
Fig. 2
Fig. 2. Characteristic markers and cell type assignments for clusters of nuclei detected in IMC.
a Heatmap showing relative mean intensities of marker expression (columns) in each identified cluster (rows). Markers were grouped based on their cell-type specificities (see top of plot, “cell type marker”). Their relative intensities in each cluster were used to assign clusters to cell types (see left of plot, “assigned cell type”). b Final assignment of neuronal and glial cell types to each cluster, with main markers expressed by each cluster indicated on the right. c Observed and expected proportions of astrocytes, oligodendrocytes, and microglia relative to the total glia population (left) and of excitatory (which include unclassified neurons) or inhibitory neurons to the total neuronal population (right) in the CtrlCV samples (sections from n = 6 brains). d Distributions of cells from each cluster within the 6 cortical layers (CtrlCV samples only), normalised by total numbers of nuclei per layer. Cell type and layer assigned to clusters are indicated in the coloured “Assigned cell type” and grey “Assigned layer” boxes above, respectively. Quantification was performed on three ROIs acquired from a single section of each sample and pooled together. Boxplots in (c) show median (middle line), interquartile range (box), and variability outside of first and third quartiles (lines extending from box). Source data are provided as a Source Data file. Scale bars in (d) represent 100 μm.
Fig. 3
Fig. 3. Neuronal subpopulations and cortical layers selectively affected in AD.
Average cell numbers per cluster per sample, comparing either controls and AD samples from donors heterozygotic for the common TREM2 allele (a; CtrlCV, sections from n = 6 brains; AlzCV, n = 18) or controls and AD samples homozygotic for the TREM2 common allele and those heterozygotic for R62H or R47H risk variants combined (c; CtrlCV, n = 6; CtrlTREM2, n = 6; AlzCV, n = 18; AlzTREM2, n = 13) or separately (e; CtrlCV, n = 6; CtrlTREM2, n = 6; AlzCV, n = 18; AlzR62H, n = 7; AlzR47H, n = 6). Only clusters with significant differences in sizes between sample groups are shown. The density of cells (cell number/mm2) in each cortical layer (L1-6) from all clusters showing layer-specific vulnerabilities (distribution of all neuronal clusters shown in Figure S5.b), comparing either controls and AD samples carrying the common TREM2 allele (c; CtrlCV, n = 6; AlzCV, n = 18) or controls and AD samples homozygotic for TREM2 common allele and those heterozygotic for R62H or R47H risk variants combined (d; CtrlCV, n = 6; CtrlTREM2, n = 6; AlzCV, n = 18; AlzTREM2, n = 13) or considered separately (d; CtrlCV, n = 6; CtrlTREM2, n = 6; AlzCV, n = 18; AlzR62H, n = 7; AlzR47H, n = 6). Quantification was performed on three ROIs acquired from a single section of each sample and pooled together before performing statistical analyses between groups. Statistical significance was calculated with Dirichlet regression (a,c,e), two-sided Wilcoxon signed-rank test (b), or either ANOVA and two-sided Tukey tests or Kruskal–Wallis and two-sided Wilcoxon signed-rank test, depending on whether groups showed normal or non-normal distributions, respectively (d, f). Boxplots show median (middle line), interquartile range (box), and variability outside of the first and third quartile (lines extending from the box). P values are indicated as: non-significant, ns, p > 0.05; *p ≤ 0.05; **p ≤ 0.01; ***p ≤ 0.001; ****p ≤ 0.0001. Source data are provided as a Source Data file.
Fig. 4
Fig. 4. Intracellular accumulation of AT8+ pTau and 4G8+ Aβ (intraAβ) in neuronal subtypes.
Proportions of pTau+ (a) and intraAβ+ (c) cells in each neuronal subtype cluster separately for CtrlCV (sections from n = 6 brains), CtrlTREM2 (n = 6), AlzCV (n = 18) and AlzTREM2 (n = 13) samples. Quantification was performed on three ROIs acquired from a single section of each sample and pooled together. Coloured boxes on the left highlight groups of neuronal types (excitatory, inhibitory and unclassified neurons) to which clusters were assigned to (“assigned neuronal type”). IMC images showing co-localisations of: RORB+ and AT8+ pTau in a AlzCV (Braak 5/6) tissue section (b); RORB+ neurons and 4G8+ Aβ in a CtrlCV (Braak 2) section (d); GAD1+ neurons and 4G8+ Aβ in a CtrlCV (Braak 0) section (e). Double-positive neurons (RORB+AT8+ in b; RORB+4G8+ in d; GAD1+4G8+ in e; yellow arrowheads) are found in the cortical layers shown in Fig. 3b, d, f. Source data are provided as a Source Data file. Scale bars in (b,d,e) represent 100 μm.
Fig. 5
Fig. 5. Reactive microglia are spatially associated with vulnerable neurons and plaques.
Average number of CD68+GAD1+ cells (cluster_15) per sample group in sections from non-disease control or AD donors homozygotic for the TREM2 common allele or heterozygotic for TREM2 R62H or R47H risk variants with the latter analysed together (a; CtrlCV, n = 6; CtrlTREM2, n = 6; AlzCV, n = 18; AlzTREM2, n = 13) or separately (b; CtrlCV, n = 6; CtrlTREM2, n = 6; AlzCV, n = 18; AlzR62H, n = 7; AlzR47H, n = 6). c Triple immunostaining for Iba1 (red), GAD1 (green), CD68 (grey) and DAPI (blue) in CtrlCV and AlzTREM2 donor sections with showing triple positive Iba1+CD68+GAD1+cells (yellow arrowhead). d Orthogonal projection of the region indicated by the white dashed square in (c). e Cell-cell interaction analyses between microglia and inhibitory or excitatory neuronal clusters from all samples analysed were performed with the buildSpatialGraph function. The calculated interaction score “sum_sigval” indicates the relative interactions between (>0) or relative proximity avoidance (<0) of the selected cell types. f Densities of CD68+GAD1+ cells by cortical layer (cluster_15) in CtrlCV (n = 6), CtrlTREM2 (n = 6), AlzCV (n = 18) and AlzTREM2 (n = 13) samples. g Layer-specific density of Aβ+ mask (shown in Fig. S8.i) generated from the 4G8 Aβ channel to identify plaques and their total areas within the sections of CtrlCV (n = 6), CtrlTREM2 (n = 6), AlzCV (n = 18), and AlzTREM2 (n = 13) samples. Quantification was performed on three ROIs acquired from a single section of each sample and pooled together before performing statistical analyses between groups. Statistical significance estimates were calculated with Dirichlet regression (a, b) or either ANOVA and two-sided Tukey tests or Kruskal–Wallis and two-sided Wilcoxon signed-rank test depending on whether groups showed normal or non-normal distributions, respectively (f, g). Boxplots show median (middle line), interquartile range (box) and variability outside of the first and third quartiles (lines extending from box). P values are indicated as: non-significant, ns, p > 0.05; *p ≤ 0.05; **p ≤ 0.01; ***p ≤ 0.001; ****p ≤ 0.0001. Source data are provided as a Source Data file. Scale bars in (c) represent 100 μm.
Fig. 6
Fig. 6. Pathways enriched in Braak pseudo-time trajectory analyses of IMC-snRNAseq matched vulnerable neuronal clusters.
a UMAP representation of clustered MTG-derived neuronal subpopulations from snRNAseq dataset. b Matched neuronal clusters from IMC (orange line below) and snRNAseq (green line above) experiments. Colours of the connecting lines identify neuronal types (excitatory, inhibitory, and unclassified neurons) to which clusters were assigned to (“assigned neuronal subtype”). Relative widths of the connecting lines describe their relative match scores (a measure of confidence in the correspondence between the direct transcriptomic and immunohistological cluster associations with wider lines corresponding to higher matching scores). Summary clinical disease (left) and Braak (right) pseudo-time trajectories for the Exc−L4−6−RORB−LCN15 and Exc−L5−RORB−LINC01202 clusters (black line in c,d with trajectory directions indicated by the red arrowhead). e Heatmap describing the relative expression of gene pathways enriched at successive stages (modules) of Braak pseudo-time for the Exc−L4−6−RORB−LCN15 (upper) and Exc−L5−RORB−LINC01202 (lower) clusters. Pathways enriched in modules corresponding to the successive consecutive Braak pseudo-time stages identified for Exc−L4−6−RORB−LCN15 (f) and Exc−L5−RORB − LINC01202 (g) cluster trajectory analyses. Only pathways with FDR < 0.05, odds ratio > 8 and overlapping genes ≥ 3 were analysed.

References

    1. Fu, H., Hardy, J. & Duff, K. E. Selective vulnerability in neurodegenerative diseases. Nat. Neurosci.21, 1350–1358 (2018). - PMC - PubMed
    1. Chin, J. et al. Reelin depletion in the Entorhinal cortex of human amyloid precursor protein transgenic mice and humans with Alzheimer’s disease. J. Neurosci.27, 2727 (2007). - PMC - PubMed
    1. Morrison, J. H. et al. A monoclonal antibody to non-phosphorylated neurofilament protein marks the vulnerable cortical neurons in Alzheimer’s disease. Brain Res.416, 331–336 (1987). - PubMed
    1. Saiz-Sanchez, D., De la Rosa-Prieto, C., Ubeda-Banon, I. & Martinez-Marcos, A. Interneurons, tau and amyloid-β in the piriform cortex in Alzheimer’s disease. Brain Struct. Funct.220, 2011–2025 (2015). - PubMed
    1. Xu, Y., Zhao, M., Han, Y. & Zhang, H. GABAergic inhibitory interneuron deficits in Alzheimer’s disease: implications for treatment. Front. Neurosci.14 (2020). - PMC - PubMed

MeSH terms

LinkOut - more resources