. 2025 Jun 4;16(1):5180.
doi: 10.1038/s41467-025-60441-w.

Single cell profiling of human airway identifies tuft-ionocyte progenitor cells displaying cytokine-dependent differentiation bias in vitro

Affiliations

Single cell profiling of human airway identifies tuft-ionocyte progenitor cells displaying cytokine-dependent differentiation bias in vitro

Viral S Shah et al. Nat Commun. .

Abstract

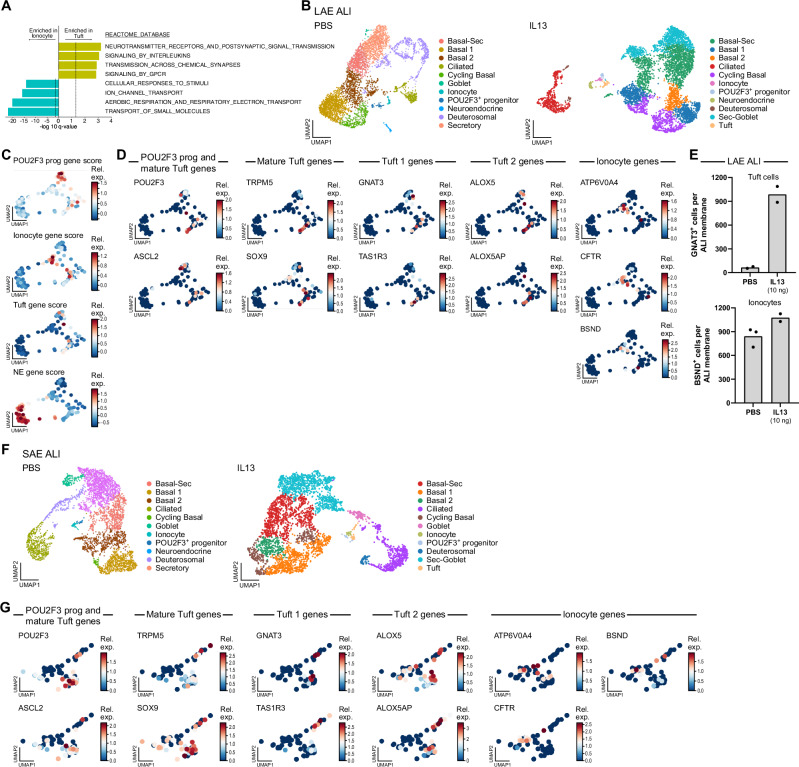
Human airways contain specialized rare epithelial cells including CFTR-rich ionocytes that regulate airway surface physiology and chemosensory tuft cells that produce asthma-associated inflammatory mediators. Here, using a lung cell atlas of 311,748 single cell RNA-Seq profiles, we identify 687 ionocytes (0.45%). In contrast to prior reports claiming a lack of ionocytes in the small airways, we demonstrate that ionocytes are present in small and large airways in similar proportions. Surprisingly, we find only 3 mature tuft cells (0.002%), and demonstrate that previously annotated tuft-like cells are instead highly replicative progenitor cells. These tuft-ionocyte progenitor (TIP) cells produce ionocytes as a default lineage. However, Type 2 and Type 17 cytokines divert TIP cell lineage in vitro, resulting in the production of mature tuft cells at the expense of ionocyte differentiation. Our dataset thus provides an updated understanding of airway rare cell composition, and further suggests that clinically relevant cytokines may skew the composition of disease-relevant rare cells.


Conflict of interest statement

Competing interests: Aviv Regev is a founder and equity holder of Celsius Therapeutics, an equity holder in Immunitas Therapeutics, and until August 31, 2020, was a SAB member of Syros Pharmaceuticals, Neogene Therapeutics, Asimov and Thermo Fisher Scientific. From August 1, 2020, Aviv Regev has been an employee of Genentech and has equity in Roche. Avinash Waghray is an employee of Immunology and Inflammation Research Therapeutic Area, Sanofi, Cambridge, MA. Srinivas Vinod Saladi is a co-founder of Reinwik Inc. Brian Lin is a consultant for Rhino Therapeutics and a co-founder of Cellsor. The remaining authors declare no competing interests.

Figures

Fig. 1
Fig. 1. Deep cell atlas of the human lung reveals the presence of ionocytes in both human proximal and distal airways and proximal and distal ALI cultures.
A Regional sampling for a deep lung cell atlas. Numbered circles represent sampled locations. B Lung cell atlas. Uniform manifold approximation and projection (UMAP) embedding of cell profiles (dots) from the large airways (left) and lung lobe regions (right) colored by cell type annotation. C–F Epithelial lung and ALI cell profiles. UMAP embeddings of epithelial cell profiles from the proximal airway (C), distal lung lobe (D), and ALI cultures generated from large airway basal cells isolated from primary bronchus (E) or from small airway basal cells isolated from microdissected small airway less than 2 mm in diameter (F). G–I Ionocyte abundance in the human proximal and distal airways and human proximal and distal ALI cultures. G Number of BSND+ mature ionocytes per ALI (y axis) in Large ALI and Small ALI cultures (x axis). n = 3 ALIs averaged from 3 separate donors, Two tailed unpaired T test. Error bars are standard deviation. H Whole mount images of dissected large (left) and small (right) airways stained for BSND (magenta) and acetylated Tubulin (green). Insets: Representative examples of BSND+ ionocytes (magenta). I Number of BSND+ mature ionocytes per mm2 (y axis) in microdissected large airways and small airways (x axis). n = 26 for large airways and 33 for small airways across three normal human lungs (Hu66, Hu67, and Hu68). One way ANOVA (Sidak’s multiple comparisons). Error bars are standard deviation. Elements of 1 A was created with BioRender https://BioRender.com/0ruztco.
Fig. 2
Fig. 2. Transcriptional and chromatin accessibility profiles reveal a replicative rare cell progenitor and a pre-ionocyte state.
APOU2F3+ tuft-like cells are predicted to be progenitors of mature ionocytes. UMAP embedding of scRNA-seq profiles (dots) of rare epithelial cells in our deep lung cell atlas, colored by cell annotation (left) and showing RNA velocity vectors (right) directed from tuft-like cells to ionocytes. B Human large airways and human Large ALI cultures both contain POU2F3+ cells. Antibody staining of a section of the right primary bronchus for POU2F3 (red) and DAPI (blue) and LAE ALI for POU2F3 (green) and DAPI (blue). This staining has been repeated in 3 separate samples. C–EPOU2F3+ tuft-like cells include replicating and non-replicating cells. C Mean expression (dot color, relative expression) and percentage of cells (dot size) expressing selected cell identity and cell proliferation markers (columns) in different rare epithelial cell subsets (rows). D UMAP embedding of scRNA-seq profiles (dots) of rare cells, colored by cell cycle classification (left) or cell type annotation (right). E Large ALI cultures co-stained with POU2F3 (yellow, top) and MKI67 (purple, middle). The bottom panel shows cells expressing both markers (arrows). This staining was repeated in 3 samples. F Distinct chromatin state marks POU2F3+ progenitors. UMAP embedding of large airways epithelial cell scATAC-seq profiles (dots) colored by de novo cell type annotation. Zoom of boxed rare cells highlight chromatin accessibility at select gene loci associated with tuft cells, ionocytes, and progenitor cells.
Fig. 3
Fig. 3. Type 2 pathway cytokines induce mature tuft cell differentiation.
A Neural and immune genes are induced in mature tuft cells. Significance (signed-log10 (q-value), x axis) of enrichment of the four functional gene sets (y axis) in the REACTOME database, most enriched in genes up-regulated in mature tuft cells (positive values) or ionocytes (negative values). B IL-13 treatment shifts the Large ALI cell composition. UMAP embedding of scRNA-seq profiles (dots) from control (left; same plot as in Fig. 1E, reproduced here for convenience) and IL-13-treated (right) LAE ALIs, colored by cell subset annotation. C–E Mature tuft cells are induced in IL-13-treated LAE ALIs. Zoom of a portion of the UMAP embedding in IL-13 treated LAE ALIs (from B, right) colored by scores for rare cell marker gene signatures (Supplementary Data 2) (C) or by expression of rare cell marker genes (D). E Number of antibody-stained cells (y axis) for GNAT3 expressing tuft cells (n = 2 ALIs (Hu19, Hu67)) and BSND expressing ionocytes n = 3 ALIs (Hu19, Hu62, Hu67) in LAE ALI treated with PBS or IL13 (10 ng/ml) (x axis). (All experimental treatments were done in parallel; Methods). F Mature SAE ALIs are treated for 96 h with PBS (control) or IL13 (20 ng/ml). IL-13 treatment shifts SAE ALI cell composition. UMAP embedding of scRNA-seq profiles (dots) from control (left; as in Fig. 1F) and IL-13-treated (right) SAE ALIs, colored by cell type annotation. G Mature tuft cells are induced in IL-13-treated SAE ALIs. Zoom of a portion of the UMAP embedding in IL-13 treated SAE ALIs (from G, right) colored by expression of rare cell marker genes.
Fig. 4
Fig. 4. Type 2 pathway cytokines redirect the lineage of bipotent Tuft-Ionocyte Progenitor (TIP) cells.
A, B Sorting strategy to enrich rare cells. A. Mean expression (dot color, relative expression) and proportion of cells (dot size) expressing genes encoding the cell surface proteins NCAM1 and KIT in human in vivo scRNA-seq data from Fig. 1B. B Expression level (∂∂CT, qPCR, y axis) of key rare cell marker genes (marked on top left) in sorted cell populations from human ALI cultures (x axis, labeled by sorting marker). n = 3 technical replicates. Error bars are standard deviation. Based on this expression data, dissociated cells were stained for anti-human CD45–BV421 (1:100; BioLegend 368522), anti-human CD31–BV421 (1:100; BioLegend 303124), anti-human CD326(EPCAM)–APC (1:100 BioLegend 324208), CD117(KIT)–FITC (1:100; BioLegend 313231) and anti-human CD56(NCAM)–BV711 (1:100; BD Biosciences 563169). A negative sort was performed for CD45 (immune cells) and CD31 (endothelial cells), with positive selection for CD326 (epithelial cells), CD56 (NCAM – rare cell marker), and CD117 (KIT – rare cell marker). Please see Supplementary Fig. 9 for gating strategy. C, D Experimental strategy. C Left: Model of differentiating ALI. Right: POU2F3 mRNA expression (∂∂CT, qPCR, y axis) at different time points (x axis) during ALI differentiation. n = 3 technical replicates. Error bars are standard deviation. D Schematic of experimental time course, where starting at ALI D3 (top; the time point at which TIP cells are first present) cultures were treated with IL13 (10 ng/ml) or PBS control for 5 days and then CD45- CD31- EPCAM + NCAM1 + , CD45- CD31- EPCAM + KIT+ and CD45- CD31- EPCAM + KIT + NCAM1+ rare cells were collected, pooled, and profiled using scRNA-seq. E–H TIP cells give rise to ionocytes via defined transition states in control LAE ALI cultures. UMAP embedding of scRNA-seq profiles (dots) from PBS-treated (control) LAE ALI cultures colored by cell type annotation (E), overlaid RNA velocity vectors (F), cell cycle phase classification (G, left), G1/S (G, middle), and G2/M (G, right) gene signature scores. H Mean expression (dot color) and fraction of cells (dot size) expressing different lineage markers (columns) in each cell subset along the default lineage transition of TIP cells towards ionocytes (rows). I–L TIP cells are diverted towards mature tuft cell fate following IL-13 treatment. UMAP embedding of scRNA-seq profiles (dots) from IL-13-treated LAE ALI cultures colored by cell subsetannotation (I), overlaid RNA velocity vectors (J), cell cycle phase classification (K, left), G1/S (K, middle), and G2/M (K, right) gene signature scores. L Mean expression (dot color) and fraction of cells(dot size) expressing different lineage markers columns, same genes as in H) in each cell subset (rows) along the IL13-induced lineage transition of TIP cells towards mature tuft cells. M Left: Experimental setup schematic of differentiating ALI treated continuously with IL-13 for 25 days. Right: Number of BSND+ cells (ionocytes, y axis, n = 3 ALIs (Hu19, Hu60, Hu67)), error bars are standard deviation, and GNAT3+ cells (tuft cells, y axis, n = 2 ALIs (Hu60, Hu67)) in PBS and IL-13 conditions (x axis). N RNA velocity analysis of the pooled PBS and IL13-treated ALIs (clustering shown in Supplementary Fig. 10C, D) demonstrates that IL13 redirects TIP cell differentiation towards mature tuft cells and away from the default pathway of ionocyte differentiation. O Schematic depicting the observed expression of lineage-specifying TFs in TIP cell descendants that are differentiating towards either ionocyte or mature tuft cell fate. Orange arrows indicate default differentiation (PBS) and blue arrows indicate IL13-induced differentiation. P Proposed model of cytokine-mediated TIP cell lineage switching. Illustrations 4 C, M, O, P were created with BioRender: https://BioRender.com/dbkmcyx.
Fig. 5
Fig. 5. IL17A promotes tuft cell differentiation and asthmatic airway epithelium contains mature tuft cells.
A–D Tuft cell abundance increases following IL17A treatment in LAE ALI. A, C Overview schematic of IL17A treatment experiments in mature LAE ALI treated with PBS (control) or IL17A (50 ng/ml; from D39 to D44) (A) and differentiating ALI at D3 (the first time point at which TIP cells are present) treated cells with IL17A (50 ng/ml) or PBS from D3 to D24 (C). B Number of GNAT3+ mature tuft cells (quantified by immunohistochemistry, y axis, n = 2 ALIs (Hu19, Hu67)), when mature LAE ALIs are treated with PBS or IL17A (50 ng/ul; from D39 to D44) (x axis) D Number of GNAT3+ mature tuft cells (quantified by immunohistochemistry, y axis, n = 2 ALIs, (Hu19, Hu67)), in LAE ALIs when treated with PBS or IL17A from D3 to D24. E, F Tuft cells are increased in ALIs and airways from asthmatic patients. E Number of GNAT3+ mature tuft cells (y axis) in LAE ALIs derived from two asthmatic individuals (Hu70 and Hu78) and in patients with no history of lung diseases (Hu66, Hu67) (x axis), n = 1 ALI per donor. F Whole mount staining of dissected airways from a patient with asthma exacerbation. Staining in the top panel with GNAT3 (green) shows a mature tuft cell, surrounded by ciliated cells (Atub, white). Staining with additional mature tuft cell marker ALOX5AP (magenta) reveals the characteristic bipolar morphology (arrows) associated with mature tuft cells (bottom panels). Due to the availability of tissue, immunostaining was performed on only 1 donor. Illustrations 4B and D were created with BioRender: https://BioRender.com/g37wh81.

References

    1. Goldfarbmuren, K. C. et al. Dissecting the cellular specificity of smoking effects and reconstructing lineages in the human airway epithelium. Nat. Commun.11, 2485 (2020). - PMC - PubMed
    1. Adams, T. S. et al. Single-cell RNA-seq reveals ectopic and aberrant lung-resident cell populations in idiopathic pulmonary fibrosis. Sci. Adv.6 eaba1983 (2020). - PMC - PubMed
    1. Braga, F. A. V. et al. A cellular census of human lungs identifies novel cell states in health and in asthma. Nat. Med. 10.1038/s41591-019-0468-5 (2019). - PubMed
    1. Travaglini, K. J. et al. A molecular cell atlas of the human lung from single-cell RNA sequencing. Nature587, 619–625 (2020). - PMC - PubMed
    1. Deprez, M. et al. A Single-Cell Atlas of the Human Healthy Airways. Am. J. Respir. Crit. Care Med.202, 1636–1645 (2020). - PubMed

Substances

LinkOut - more resources