. 2025 Jun 4;16(1):5203.
doi: 10.1038/s41467-025-59659-5.

Perinatal serotonin signalling dynamically influences the development of cortical GABAergic circuits with consequences for lifelong sensory encoding

Affiliations

Perinatal serotonin signalling dynamically influences the development of cortical GABAergic circuits with consequences for lifelong sensory encoding

Gabriel Ocana-Santero et al. Nat Commun. .

Abstract

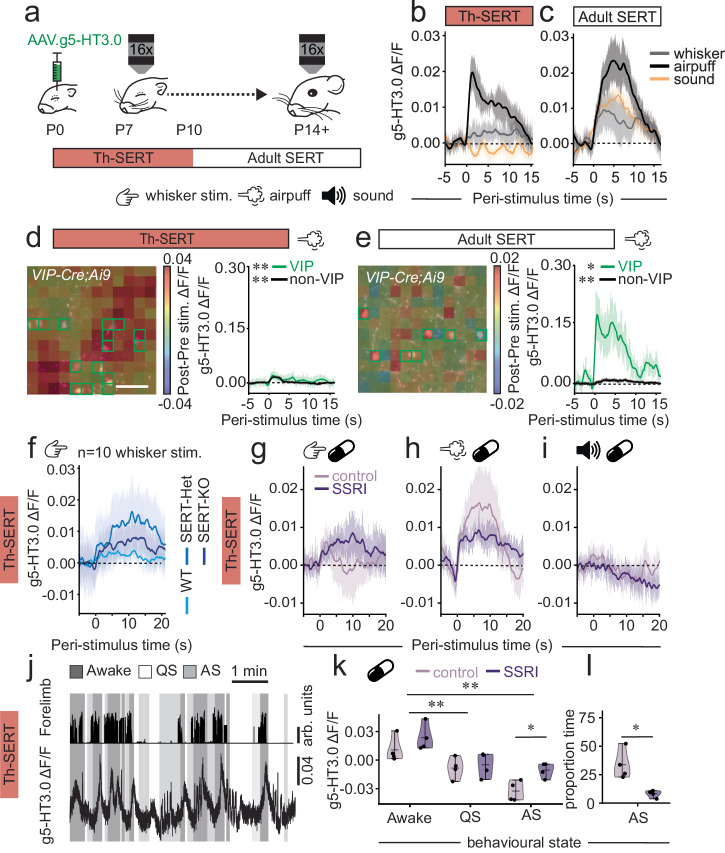
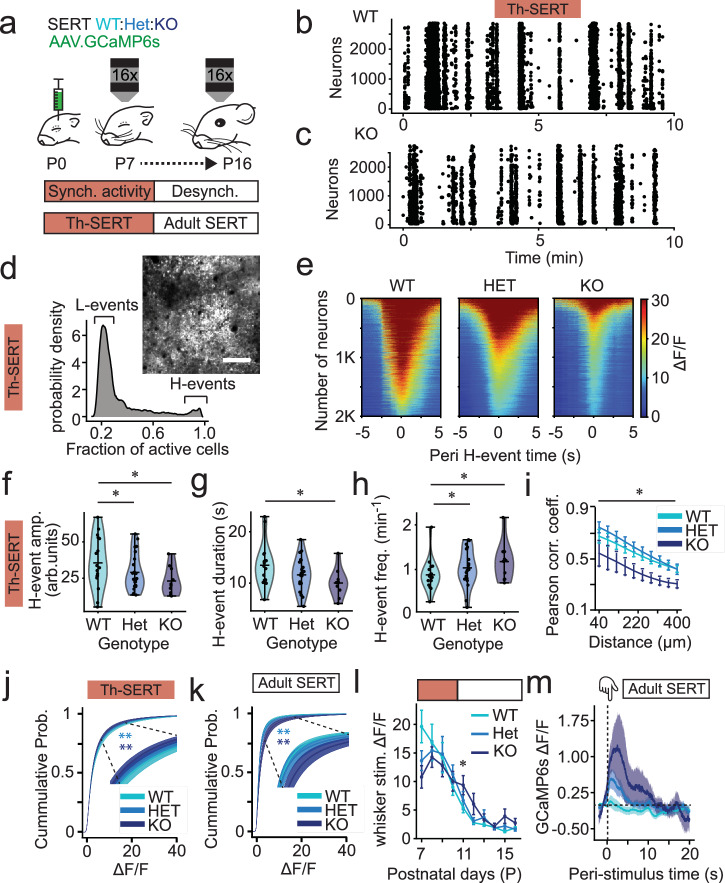
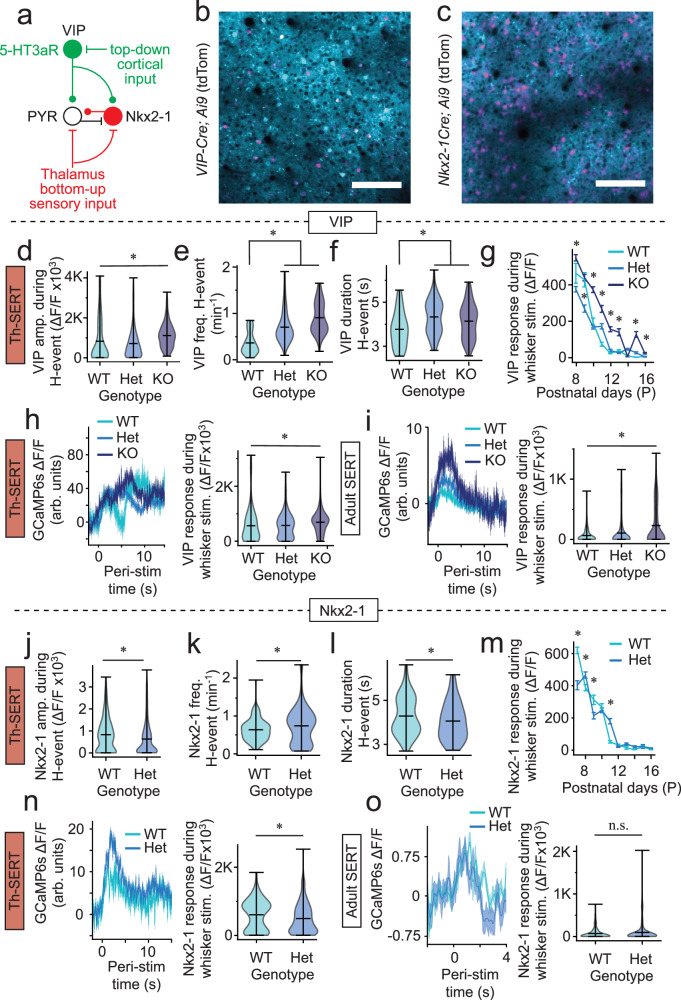
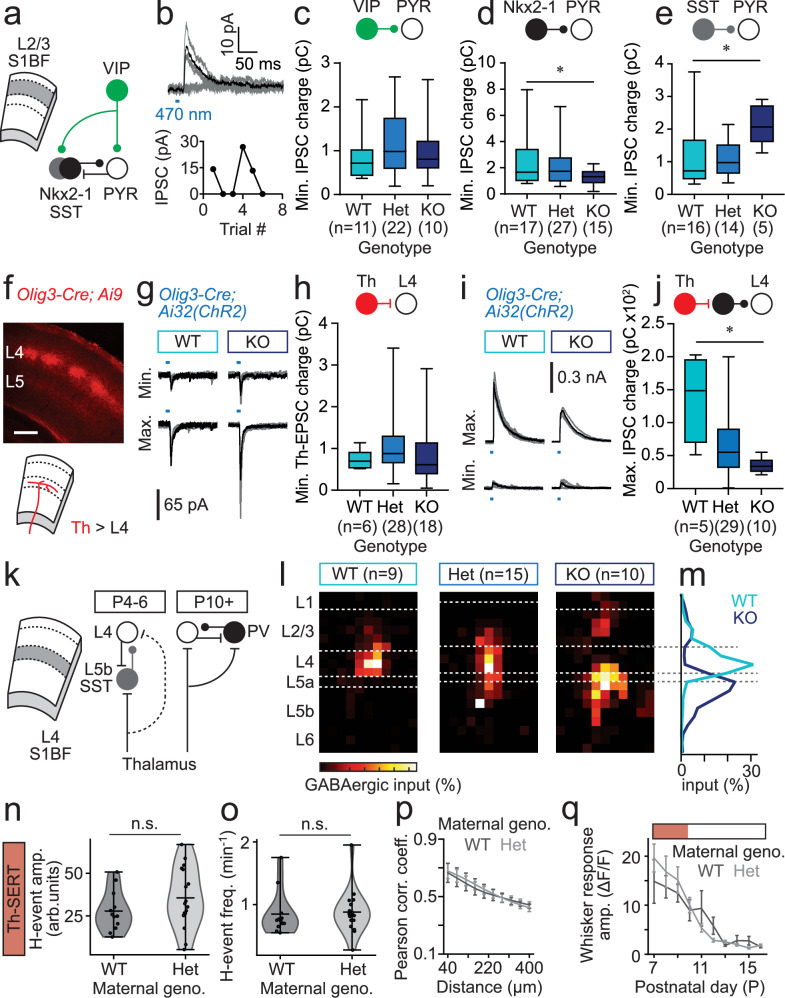
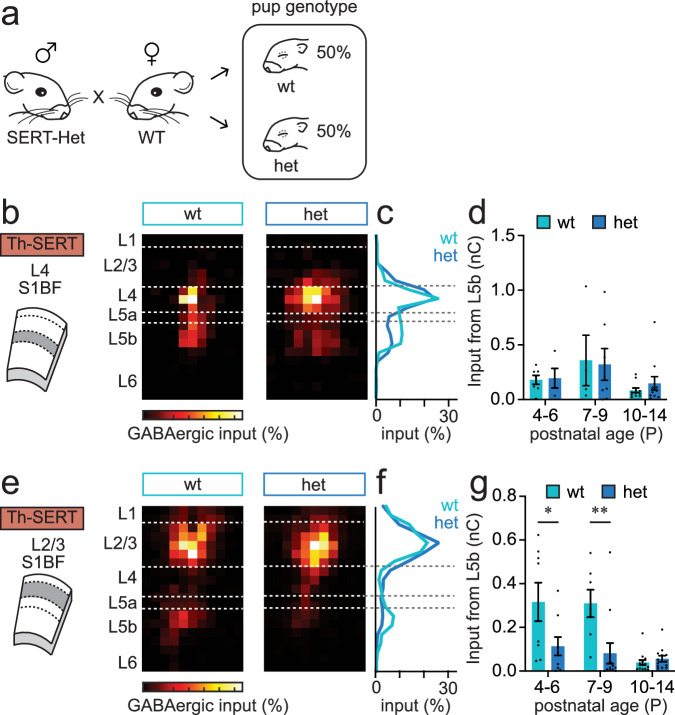
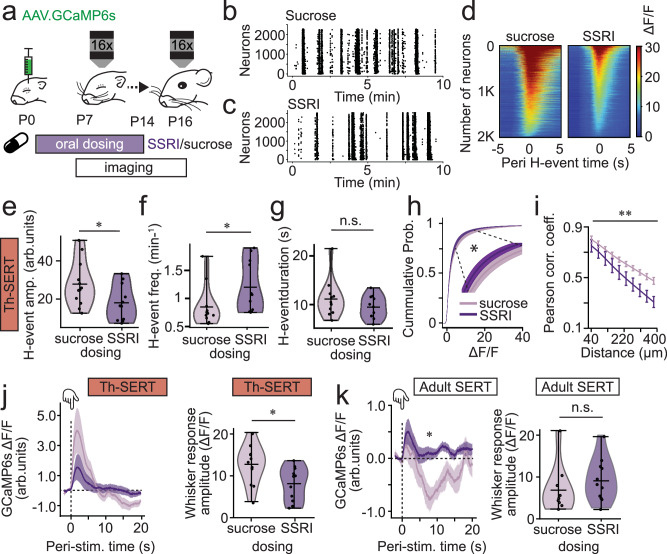
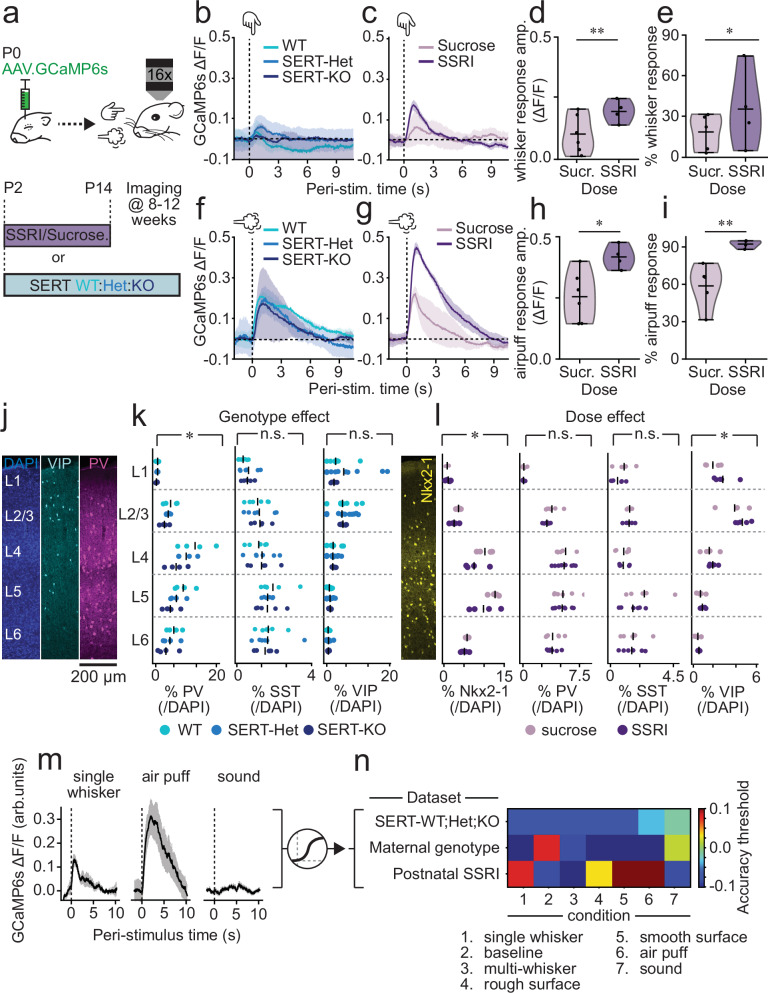
Serotonin plays a prominent role in neurodevelopment, regulating processes from cell division to synaptic connectivity. Clinical studies suggest that alterations in serotonin signalling such as genetic polymorphisms or antidepressant exposure during pregnancy are risk factors for neurodevelopmental disorders. However, an understanding of how dysfunctional neuromodulation alters systems level activity over neocortical development is lacking. Here, we use a longitudinal imaging approach to investigate how genetics, pharmacology, and aversive experience disrupt state-dependent serotonin signalling with pathological consequences for sensory processing. We find that all three factors lead to increased neocortical serotonin levels during the initial postnatal period. Genetic deletion of the serotonin transporter or antidepressant dosing results in a switch from hypo- to hyper-cortical activity that arises as a consequence of altered cortical GABAergic microcircuitry. However, the trajectories of these manipulations differ with postnatal exposure to antidepressants having effects on adult sensory encoding. The latter is not seen in the genetic model despite a similar early phenotype, and a distinct influence of maternal genotype on the development of supragranular layers. These results reveal the dynamics and critical nature of serotonin signalling during perinatal life; pharmacological targeting of which can have profound life-long consequences for cognitive development of the offspring.


Conflict of interest statement

Competing interests: The authors declare no competing interests or other interests that might be perceived to influence the interpretation of the article.

Figures

Fig. 1
Fig. 1. Postnatal serotonin signalling fluctuates with behavioural state and adverse experience, but sensory-evoked responses are clamped by SERT expression.
a Schematic of experimental timeline. b g5-HT3.0 signal following whisker (p = 0.189), auditory (p = 0.976), or airpuff (p = 0.031) stimuli during the Th-SERT period (n = 6 mice). c Corresponding data for the period of Adult SERT expression (P11-13): whisker (p = 0.046), auditory (p = 0.010), air puff (p = 0.003) stimuli (n = 6 mice). d (Left) change in g5-HT3.0 signal following air puffs during Th-SERT. Right, responses in subregions (green squares) containing (p = 0.007) or lacking (p < 0.001) VIP interneurons (n = 38 VIP cells; 4 mice). e Corresponding data for an animal recorded during Adult SERT. Right, response in subregions containing VIP interneurons (p = 0.043) or without (p < 0.001) (n = 74 cells; 4 mice). f Peri-stimulus triggered g5-HT3.0 signal in WT (p > 0.05, n = 6 mice), SERT-Het (p < 0.05 for 14 s post-stimulus, n = 3 mice) and SERT-KO mice (p < 0.05 for 15 s post-stimulus, n = 4 mice). g, h, i g5-HT3.0 signal of sucrose- (n = 4) and SSRI-treated (n = 4) Wt pups following whisker (g, control: p < 0.05 for 1 s; SSRI: p < 0.05 for 3 s), air puff (h, control: p < 0.05 for 4 s; SSRI: p < 0.05 for 20 s) or auditory (i, not significant for control/SSRI) stimuli during Th-SERT. j Forelimb movement and g5-HT3.0 S1BF signal during wakefulness (Awake; dark grey), quiet sleep (QS; white), and active sleep (AS; light grey). k g5-HT3.0 signal during awake, QS and AS for sucrose-control/SSRIs animals (Shapiro–Wilk p = 0.067, Two-way ANOVA: sleep state p < 0.001, treatment condition p = 0.017, interaction state-treatment p = 0.315; n = 4 sucrose, n = 4 SSRI mice). l Time spent in AS for control/SSRI-treated mice (Shapiro–Wilk p = 0.900, t-test p = 0.015, n = 4 sucrose, 4 SSRI mice). *p < 0.05 **p < 0.01, paired t-test or Wilcoxon signed-rank test of average signal 1 s before vs. after stimulus (except for (kl), following Shapiro–Wilk tests for normality. g5-HT3.0 traces are presented as mean (solid line) ± SEM (shaded area). Violin plots are presented as mean values ± max/min value.
Fig. 2
Fig. 2. SERT-KO pups transition from hypo- to hyperactivity with the onset of adult-like desynchronous cortical activity.
a Neonates were injected with GCaMP6s in S1BF and imaged P7-16. Raster plot of neuronal spiking across 10 min baseline from (b) WT and (c) SERT-KO mice recorded at P8 during the Th-SERT period. d, cell co-activation from a single WT animal at P8 demonstrating presence of low (L-) and high (H-) synchronicity calcium events, with inset, a representative H-event; image made from an average of 120 frames (scale bar = 100 µm). e Representative peri (±5 s) H-event GCaMP6s signal heatmaps of 2000 cells in recordings from single WT (left), SERT-Het (centre) and SERT-KO (right) P8 mice; Heat maps represent average signal across all H-events during a 20 min. recording. Mean H-event (f) amplitude, (g) duration, and (h) frequency in WT/SERT-Het/SERT-KO mice during Th-SERT (f, Two-way ANOVA genotype p = 0.003. pairwise comparisons: WT-Het p = 0.033; WT-KO p = 0.011; Het-KO p = 0.604; g, Two-way ANOVA genotype p = 0.007. Pairwise comparisons: WT-Het p = 0.054; WT-KO p = 0.011; Het-KO p = 0.515. h Two-way ANOVA genotype p = 0.001; pairwise comparisons: WT-Het p = 0.018; WT-KO p = 0.007; Het-KO p = 0.642). i Pairwise cell correlations across distance in SERT-WT/Het/KO mice at P8 (p < 0.001). j, k Cumulative probability distribution of ΔF/F values in Th-SERT (j, Kolmogorov–Smirnov test: WT-HET p = 0.0002; WT-KO p = 0.0007) and Adult SERT (Kolmogorov–Smirnov test: WT-HET p < 0.001; WT-KO p < 0.001). l Mean whisker-response amplitude across development in SERT-KO mice showing increases after decorrelation at P11 (Two-way ANOVA genotype p = 0.006, pairwise WT-Het: p = 0.900, WT-KO: p = 0.038, Het-KO: p = 0.0579). m Stimulus-triggered average GCaMP6s signal across all cells and mice showing increased whisker-response amplitude at P11-13 (Two-way ANOVA p = 0.040, pairwise WT-HET p = 0.246, WT-KO p = 0.010). Sample sizes for panels (fm) are 19 (WT), 23 (SERT-Het) and 10 (SERT-KO); all other panels (ce) are data from single representative animals. Traces (m), error bar (i, l) and cumulative probability (j,k) plots are presented as mean ± SEM. Violin plots (fh) are presented as mean values ± max/min value.
Fig. 3
Fig. 3. Altered activity of VIP and Nkx2-1 interneurons on the SERT-KO background.
a Schematic illustrating the contribution of Nkx2-1 and VIP interneuron subtypes to bottom-up, feed-forward and top-down inhibition, respectively. Representative fields of view of mouse S1BF expressing GCaMP6s under the hSyn promoter and tdTomato in (b) VIP (n = 18 mice imaged) or (c) Nkx2-1 (n = 14 mice imaged) interneurons (scale bar 100 µm). Violin plots of average (d) amplitude, (e) frequency, and (f) duration of VIP interneuron calcium responses during H-events in SERT-WT/Het/KO mice at P7-10 (d, Kruskal–Wallis p < 0.001, pairwise WT-HET: p = 0.087, WT-KO: p < 0.001, HET-KO: p < 0.001, e, f, Kruskal–Wallis p < 0.001, pairwise WT-HET: p < 0.001, WT-KO: e, p < 0.001 f, p = 0.037). g Whisker response amplitudes of VIP interneurons in SERT-WT/Het/KO mice from P8 to P16 (*p < 0.05 Tukey HSD test). h, i VIP whisker response trace (left) and amplitude (right) of SERT-WT/Het/KO mice during the Th-SERT (h, Kruskal–Wallis p < 0.001, pairwise WT-HET: p = 0.9612, WT-KO: p = 0.029, HET-KO: p = 0.004) and the Adult SERT period (i, Kruskal–Wallis p < 0.047, pairwise WT-HET: p = 0.1593, WT-KO: p < 0.001, HET-KO: p < 0.001). Violin plot of average (j) amplitude, (k) frequency, and (l) duration of Nkx2-1 interneuron calcium responses during H-events in SERT-WT/Het mice at P7-10 (Mann–Whitney U-test j, p < 0.001; k, p = 0.019; l p = 0.039). m Whisker response amplitudes of Nkx2-1+ interneurons in SERT-WT/Het mice from P7 to P16 (* p < 0.05 Tukey HSD test). Nkx2-1 whisker response trace (left) and amplitude (right) of SERT-WT/Het/KO mice during the Th-SERT (n, Mann–Whitney U-test p = 0.001) and the Adult SERT period (o, Mann–Whitney U-test p = 0.053). VIP sample sizes are 201 cells from 4 animals (WT), 1361 cells from 9 animals (Het), and 546 cells from 5 animals (KO) (di), while Nkx2-1 are 555 cells from 6 animals (WT) and 1020 cells from 8 animals (Het) (jo). Traces (h, i, n, o) and error bar (g, m) plots are presented as mean ± SEM. Violin plots are presented as mean values ± max/min value.
Fig. 4
Fig. 4. Ex vivo characterisation of the impact of SERT deletion on postnatal GABAergic circuits in S1BF.
a schematic of interneuron-pyramidal cell (PYR) circuit in L2/3 of S1BF. b Representative minimal optogenetic stimulation data showing interneuron synaptic input onto L2/3 PYRs. Minimal interneuron input onto L2/3 PYRs for c, VIP (one-way ANOVA (F(2, 40) = 0.7044; p = 0.5004); d, Nkx2-1 (one-way ANOVA (F(2, 56) = 2.781; p = 0.071. Pairwise comparisons: WT-Het p = 0.666; *WT-KO p = 0.047); e, SST (one-way ANOVA (F(2, 32) = 4.492; genotype p = 0.0191; Pairwise comparisons: WT-Het p = 0.9733; *WT-KO p = 0.019) interneurons. f Conditional tdTomato expression in thalamic afferents innervating S1BF (P7 SERT-Het pup)(n = 29 Olig3-Cre animals used in experiments); scale bar: 250 μm. g Representative minimum (Min.)/maximum (Max.) optogenetically-evoked thalamocortical (Th-)EPSCs recorded in L4 spiny stellate neurons (SSNs) in WT/SERT-KO pups. h Minimum Th-EPSC recorded in SSNs across the three genotypes (one-way ANOVA (F(2, 48) = 0.6741; p = 0.514). i Min./Max. optogenetically-evoked thalamic feed-forward IPSCs recorded at EGlut in SSNs in WT/SERT-KO pups. j Max. feed-forward IPSC recorded in SSNs across the three genotypes (one-way ANOVA (F(2, 41) = 10.81; p < 0.001). k Schematic of the transient SST input onto SSNs present prior to the onset of PV-mediated feed-forward inhibition. l Total GABAergic input onto SSNs across genotypes during the Th-SERT (P4-6) time window. Dashed white lines, average layer boundaries. m Average profile of GABAergic input onto SSNs recorded in WT and SERT-KO pups. n H-event frequency in WT pups from SERT-WT (n = 12 pups)/Het (n = 17 pups) dams at P7-10. (Mann–Whitney U-test p = 0.277). o GCaMP6s signal amplitude of cells during H-events in WT mice from SERT-WT (n = 12 pups) or SERT-Het (n = 17 pups) dams at P7-10 (t-test p = 0.916). p Pairwise cell correlations across distance in the same pups at P8 (two-way ANOVA, genotype p = 0.790, SERT-WT dam: n = 12 pups; SERT-Het dam: n = 17 pups). q GCaMP6s whisker response across development (two-way ANOVA, genotype p = 0.746, SERT-WT dam: n = 12 pups; SERT-Het dam: n = 17 pups). Box plot whiskers represent minimum to maximum, boxes extend 25th to 75th percentile, centre line is median. Errorbar (p, q) plots are presented as mean ± SEM. Violin plots (n, o) are presented as mean values ± max/min value.
Fig. 5
Fig. 5. Altered serotonin signalling variously impacts transient, translaminar GABAergic circuits in postnatal S1BF.
a Diagram showing the breeding paradigm used to generate wildtype (wt) or SERT-het (het) pups from wildtype dams. b Average LSPS maps for total GABAergic input onto L4 SSNs recorded in pups generated from the breeding paradigm shown in (a) mice during the P4-6 time window (wt pups, n = 7 cells; het pups, n = 5 cells). c Profile of GABAergic input across the depth of cortex from the maps shown in (b). L5b input was present in both WT and het pups born from WT dams. d Total L5b GABAergic input onto L4 SSNs recorded in animals bred from SERT-Het male and WT female pairs across postnatal development, broken down according to the genotype of the pup (wt/het)(mean ± SEM); wt: P4-6, n = 7 cells; P7-9, n = 4; P10-14, n = 11; het: P4-6, n = 4; P7-9, n = 7; P10-14, n = 11. e GABAergic input maps for L2/3 PYRs during the P7-9 time window (wt pups, n = 7 cells; het pups, n = 12 cells). f Profile of GABAergic input across the depth of cortex from the maps shown in (e). g timeline of L5b GABAergic innervation of L2/3 PYRs (mean ± SEM); (Two tailed t-test: P4-6, p = 0.048; P7-9, p = 0.009, P10-14, p = 0.344); wt: P4-6, n = 8 cells; P7-9, n = 7; P10-14, n = 14; het: P4-6, n = 9; P7-9, n = 12; P10-14, n = 13.
Fig. 6
Fig. 6. Postnatal fluoxetine treatment recreates the SERT-KO transition from cortical hypoactivity to hyperexcitability.
a Animals were dosed orally with either 10% sucrose (control vehicle) or 10 mg/kg of fluoxetine (SSRI) daily from P2 to P14, injected neonatally with GCaMP6s, implanted with a cranial window and head-fixing plate at P6 and imaged from p7 to P16. Raster plot of neuronal spiking across 10 min baseline from sucrose (b) and SSRI (c) postnatally-treated representative mice during Th-SERT (P8), illustrating the presence of H- and L-events. d Representative peri (±5 s) H-event GCCaMP6s signal heatmaps of 2000 cells in recordings from a single sucrose- (left) and SSRI- (right) treated P8 mouse. Heat map constructed from averaging the signal across all H-events detected on each mouse during a 20 min baseline recording. Violin plot of mean H-event (e) amplitude, (f) frequency and (g) duration in SSRI- versus sucrose-treated mice during Th-SERT (e, t-test p = 0.040, f, Mann–Whitney U-test: p = 0.016, g, Mann–Whitney U-test: p = 0.310). h Cumulative probability of ΔF/F 20 min baseline values of all Sucrose/SSRI treated animals at P7-10 (a, Kolmogorov–Smirnov test: p = 0.022) i, Baseline pairwise cell correlations across distance in SSRI-treated mice compared to sucrose-treated littermate controls at P9 (Two-way ANOVA, treatment p < 0.001). Stimulus-triggered average trace (left) and response amplitude (right) of GCaMP6s signal across all cells and mice during Th-SERT (j t-test p = 0.018) and Adult SERT (k, Mann–Whitney U-test, p = 0.254), in SSRI- or Sucrose-treated mice. Sample sizes are 12 (Control) and 12 (SSRI). Traces, errorbar and cumulative probability plots are presented as mean ± SEM. Violin plots are presented as mean values ± max/min value.
Fig. 7
Fig. 7. Postnatal SSRI exposure in wildtype pups and maternal SERT disruption lead to life-long changes in cortical encoding.
a Sensory stimulation in adult mice, either SERT-WT/Het/KO or wild-types postnatally treated with sucrose/SSRI. b,c, GCaMP6s response to single-whisker stimulus in (b) SERT-WT/Het/KO or (c) sucrose/SSRI-treated mice. d,e, Violin plots of single-whisker stimulus response amplitude (d, Mann–Whitney U-test p = 0.004) and cell recruitment (e, t-test p = 0.032) in sucrose/SSRI-treated mice. GCaMP6s response to airpuff in (f) SERT-WT/Het/KO or (g) sucrose/SSRI-postnatally treated mice. Violin plots of airpuff response amplitude (h, t-test p = 0.046) and cell recruitment (i, t-test p = 0.007) in sucrose/SSRI-treated mice. j Confocal image of a S1BF cortical column (200 µm wide) on an adult WT cortex, illustrating DAPI (blue, left), VIP (cyan, centre left) and PV (magenta, centre right) distribution. k Distribution of PV (Two-way ANOVA: genotype p = 0.004, layer p < 0.001, genotype-layer interaction = 0.625), SST (Two-way ANOVA: genotype p = 0.934, layer p < 0.001, genotype-layer interaction = 0.971) and VIP (Two-way ANOVA: genotype p = 0.766, layer p < 0.001, genotype-layer interaction = 0.946) interneurons across layers for SERT-WT/Het/KO mice. l Distribution of Nkx2-1 (Two-way ANOVA: treatment p = 0.032, layer p < 0.001, treatment-layer interaction = 0.789), PV (Two-way ANOVA: treatment p = 0.322, layer p < 0.001, treatment-layer interaction = 0.903), SST (Two-way ANOVA: treatment p = 0.138, layer p = 0.01, treatment-layer interaction = 0.696) and VIP (Two-way ANOVA: treatment p = 0.032, layer p < 0.001, treatment-layer interaction = 0.691) interneurons across layers for sucrose/SSRI-treated mice. m Post-stimulus calcium responses to different stimuli were used for logistic regression analysis. n Heat map with the decoding accuracy of the different logistic regression classifiers; colours indicate accuracy minus threshold for significance of the classification as defined by bootstrapping. Positive values indicate significant classification accuracy. Sample sizes are 10 (WT), 8 (SERT-Het), 5 (SERT-KO), 6 (Sucrose) and 4 (SSRI). Traces are presented as mean ± SEM. Histology scatter plots are shown as individual animals (dots) plus the mean (line). Violin plots are presented as mean values ± max/min values.

Similar articles

References

    1. Martini, F. J., Guillamón-Vivancos, T., Moreno-Juan, V., Valdeolmillos, M. & López-Bendito, G. Spontaneous activity in developing thalamic and cortical sensory networks. Neuron109, 2519–2534 (2021). - PMC - PubMed
    1. Che, A. et al. Layer I interneurons sharpen sensory maps during neonatal development. Neuron99, 98–116.e7 (2018). - PMC - PubMed
    1. Wong, F. K. et al. Pyramidal cell regulation of interneuron survival sculpts cortical networks. Nature557, 668–673 (2018). - PMC - PubMed
    1. Duan, Z. R. S. et al. “GABAergic restriction of network dynamics regulates interneuron survival in the developing cortex”. Neuron105, 75–92.e5 (2020). - PMC - PubMed
    1. Leighton, A. H. et al. Somatostatin interneurons restrict cell recruitment to retinally driven spontaneous activity in the developing cortex. Cell Rep.36, 109316 (2021). - PubMed

Substances

LinkOut - more resources