. 2025 Jun 4;16(1):5206.
doi: 10.1038/s41467-025-60474-1.

Brown adipose tissue secretes OLFM4 to coordinate sensory and sympathetic innervation via Schwann cells

Affiliations

Brown adipose tissue secretes OLFM4 to coordinate sensory and sympathetic innervation via Schwann cells

Mingqiang Lai et al. Nat Commun. .

Abstract

Non-shivering thermogenesis of brown adipose tissue (BAT) is tightly controlled by neural innervation. However, the underlying mechanism remains unclear. Here, we reveal that BAT regulates its own thermoadaptive innervation by crosstalk with Schwann cells (SCs). Loss of Olfm4 (encoding Olfactomedin-4), a risk gene in human obesity, causes BAT dysfunction and reduces whole-body thermogenesis, predisposing to obesity in mice. Mechanistically, BAT-derived OLFM4 traps Noggin, an endogenous inhibitor of BMPs, liberating BMP7-BMPR1B signaling to promote SC differentiation. Conversely, Olfm4 loss reduced BMP7 signaling in mature SCs, leading to MEK/ERK-dependent dedifferentiation and dysfunction, ultimately impairing both sensory and sympathetic innervation. Thermoneutrality exposure reduces Olfm4 expression in BAT, resulting in a similar phenotype. MEK/ERK inhibition, ERK1 depletion, or cold exposure reverses this SC dedifferentiation, enhancing resistance to obesity. These findings suggest that this neurotrophic BAT-SC crosstalk controls thermoadaptive BAT innervation. Reactivating OLFM4 signaling may be a promising therapeutic strategy for obesity and related metabolic diseases.


Conflict of interest statement

Competing interests: The authors declare no competing interests.

Figures

Fig. 1
Fig. 1. Olfm4 ablation impairs BAT thermogenesis.
Olfm4 flox/flox mice with Ucp1-Cre mice were crossed to construct brown adipocyte-specific knockout mice (Ucp1-Cre+; Olfm4 flox/flox, Olfm4CKO) for Olfm4, and littermate Cre-negative mice (Ucp1-Cre-; Olfm4 flox/flox, Ctrl) served as controls. Ctrl and Olfm4CKO mice (8 weeks old) were treated with normal diet (ND), Body weight was recorded (n  =  6 mice per group) (A). General representative image and weight of Ctrl and Olfm4CKO iBAT (B). Hematoxylin-eosin (HE) staining of Ctrl and Olfm4CKO iBAT (n = 6 mice per group) (C) (scale bars, 50 μm and 20 μm). Triglyceride quantification of Ctrl and Olfm4CKO mice (n = 6 mice per group) (D). Indirect calorimetry analysis of Ctrl and Olfm4CKO mice, monitored over a 24 h period (n = 3 mice per group) (E). Daily food intake of Ctrl and Olfm4CKO mice (n = 6 mice per group) (F). Ctrl and Olfm4CKO mice were cold challenged at 4 °C. Rectal temperatures are shown (n = 6 mice per group) (G). Ctrl and Olfm4CKO mice (8 weeks old) were treated with an high-fat diet (HFD) for 10 weeks. Body weight was recorded each week (n = 6 mice per group) (H). Tissues were collected and weighed. Fat mass of Ctrl and Olfm4CKO mice (n = 6 mice per group) (I). Lean mass of Ctrl and Olfm4CKO mice (n = 6 mice per group) (J). Intraperitoneal glucose tolerance test (GTT) (n = 6 mice per group) (K). Histology of iBAT (L) and liver (M) of Ctrl and Olfm4CKO mice on an HFD (scale bars, 50 μm and 20 μm). All Data are mean ± s.e.m. of biologically independent samples. Statistical analysis was performed using two-tailed unpaired Student’s t-test (AJ) and two-tailed unpaired Welch’s t-test (GK). All experiments were independently repeated at least three times with similar results. Source data are provided as a Source Data file.
Fig. 2
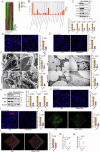
Fig. 2. Aberrant SC dysfunction decreases BAT innervation.
Heat maps of differentially enriched genes for iBAT RNA sequencing in Ctrl and Olfm4CKO mice. Expression of proteins increased are shown in yellow, while those decreased are shown in blue (n = 3 mice per group) (A). Gene Ontology (GO) enrichment bar chart for iBAT RNA sequencing in Ctrl and Olfm4CKO mice (n = 3 mice per group) (B). Immunoblot (Top) and statistical analysis (Bottom) of P0, Periaxin, MBP,CD44 and GFAP in iBAT (n = 6 mice per group) (C). Fluorescence localization (Left) and statistical analysis (Right) of P0 (D) and CD44 (E) in iBATs (scale bar, 10 μm) (n = 6 mice per group). (Left) Ultrastructure of myelinated nerve endings (F) and unmyelinated nerve endings (G) in iBAT, analyzed by TEM (scale bars, 2 µm and 500 nm). Myelinated nerve endings and unmyelinated nerve endings are indicated by blue arrows (right), and their width and number are quantified (n = 6 mice per group). Immunoblot (Left) and statistical analysis (Right) of CGRP, SP, and TH in iBAT (n = 6 mice per group) (H). Fluorescence localization (Left) and statistical analysis (Right) of CGRP (I) and TH (J) in iBATs (scale bars, 10 μm) (n = 6 mice per group). 3D fluorescence confocal microscopy (Left) and statistical analysis (Right) of TH (K) and CGRP (L) in iBATs (scale bars, 30 µm). The 3D reconstruction was performed in Imaris 8.1 by capturing 100 planes, each with a 1 µm interval (n = 3 mice per group). NE in iBAT was extracted and analyzed by ELISA (n = 3 mice per group) (M). cAMP in iBAT was extracted and analyzed by ELISA (n = 6 mice per group) (N). All Data are mean ± s.e.m. of biologically independent samples. Statistical analysis was performed using a one-sided hypergeometric distribution test with Benjamini–Hochberg false discovery rate (FDR) correction for multiple comparisons (A, B) and two-tailed unpaired Student’s t-test (C–N). All experiments were independently repeated at least three times. Source data are provided as a Source Data file.
Fig. 3
Fig. 3. OLFM4 loss leads to abnormal SC dedifferentiation and proliferation by activating MEK/ERK.
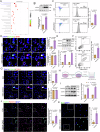
Bubble chart of KEGG database enrichment analysis for iBAT RNA sequencing in Ctrl and Olfm4CKO mice (n = 3 mice per group). Statistical analysis was performed using a one-sided hypergeometric distribution test with Benjamini–Hochberg false discovery rate (FDR) correction for multiple comparisons (A). Immunoblot (Top) and statistical analysis (Bottom) of p-ERK in iBAT (n = 6 mice per group) (B). (Left) Representative FACS plots of SOX10+/P-ERK+ cells isolated from BAT. (Right) Percentage of SOX10+/P-ERK+ cells in BAT, analyzed in FlowJo_v10.8.1 (n = 3 mice per group) (C). Fluorescence localization (Left) and statistical analysis (Right) of p-ERK and SOX10 in iBAT (n = 6 mice per group) (D). Immunoblot (Top) and statistical analysis (Bottom) of EGR1 and SOX10 in iBAT (n = 6 mice per group) (E). Fluorescence localization (Left) and statistical analysis (Right) of EGR1 and SOX10 in iBAT (scale bar, 20 µm). (Left) Representative FACS plots of SOX10+/EGR1+ cells isolated from BAT. (Right) Percentage of SOX10+/EGR1+ cells in BAT, analyzed in FlowJo_v10.8.1 (n = 3 mice per group) (F). Fluorescence localization (Left) and statistical analysis (Right) of EGR1 and SOX10 in iBAT (scale bar, 10 µm) (n = 6 mice per group) (G). Co-culture pattern diagram of primary adipocytes and primary SCs (H). Immunoblot (Left) and statistical analysis (Right) of EGR1 and Cyclin D1 in primary SCs (n = 4 independent biological replicates) (I). Fluorescence localization (Left) and statistical analysis (Right) of EGR1 and SOX10 in primary SCs (scale bar, 40 µm) (n = 6 independent biological replicates) (J). (Left) Analysis of proliferation in primary SCs and labelled with EdU (scale bar, 40 µm and 20 µm). (Right) The quantity of Edu positive cells in per field, analyzed in ImageJ software (n = 6 independent biological replicates) (K). All Data are mean ± s.e.m. of biologically independent samples. Statistical analysis was performed using two-tailed unpaired Student’s t-test (BG, IK). All experiments were independently repeated at least three times with similar results. Source data are provided as a Source Data file.
Fig. 4
Fig. 4. MEK/ERK inhibition restores BAT innervation and thermogenesis impaired by SC dedifferentiation.
Olfm4CKO mice (Olfm4CKO+PD) were treated with PD0325901. The same dose of placebo was given to Ctrl mice (Ctrl+PL) and other Olfm4CKO mice (Olfm4CKO+PL) as controls. Fluorescence localization (Left) and statistical analysis (Right) of p-ERK and SOX10 in iBAT (scale bar, 10 µm) (n = 6 mice per group) (A). Immunoblot (Top) and statistical analysis (Bottom) of EGR1 and SOX10 in iBAT (n = 6 mice per group) (B). Fluorescence localization (Left) and statistical analysis (Right) of EGR1 and SOX10 in iBAT (scale bar, 10 µm) (n = 6 mice per group) (C). Immunoblot (Left) and statistical analysis (Right) of P0, Periaxin, MBP, CD44 and GFAP in iBAT (n = 6 mice per group) (D). Fluorescence localization (Left) and statistical analysis (Right) of P0 (E) and CD44 (F) in iBAT (scale bar, 10 μm) (n = 6 mice per group). TEM (Left) of Ultrastructure of myelinated nerve endings (G) and unmyelinated nerve endings (H) in iBAT. Myelinated nerve endings and unmyelinated nerve endings are indicated by orange arrows (right), and their width and number were quantified (n = 6 mice per group) (scale bars, 2 µm and 0.5 µm). Immunoblot (Left) and statistical analysis (Right) of CGRP, SP, and TH (n = 6 mice per group) (I). Fluorescence localization (Left) and statistical analysis (Right) of CGRP (J) and TH (K) in iBAT (scale bars, 10 μm) (n = 6 mice per group). cAMP in iBAT was extracted and analyzed by ELISA (n = 6 mice per group) (L). Immunoblot (Left) and statistical analysis (Right) of ERK, p-ERK, and EGR1 in SCs (n = 3 independent biological replicates) (M). (Left) FACS plots of SOX10+/EGR1+ cells isolated from primary SCs. (Right) Percentage of SOX10+/EGR1+ cells analyzed in FlowJo_v10.8.1 (n = 3 independent biological replicates) (N). All Data are mean ± s.e.m. of biologically independent samples. Statistical analysis was performed using one-way ANOVA (two-sided) with Tukey post hoc test for pairwise comparisons (AL) and two-way ANOVA with Tukey post hoc test for pairwise comparisons (M, N). All experiments were independently repeated at least three times. Source data is provided as a Source Data file.
Fig. 5
Fig. 5. OLFM4 regulates SCs function by modulating Noggin-BMP7-BMPR1B signaling.
Slate is OLFM4, yellow is Noggin, green is BMP7. Dark blue is N atoms, red is O atoms, and green dashed line is the hydrogen bond/salt bridge formed. Schematic of localized binding of OLFM4 to Noggin (A). Co-IP assay (Left) and statistical analysis (Right) of OLFM4 in iBAT, P = 0.0014, [95% CI 0.76-0.98], (n = 3 independent biological replicates) (B). Co-IP (Left) and statistical analysis (Right) for Noggin in iBAT, P = 0.043, [95% CI −1.66 - −0.04] (n = 3 independent biological replicates) (C). Co-IP (Left) for BMP7 in iBAT. P = 0.0004, [95% CI 2.04 − 3.39] (n = 3 independent biological replicates) (D). Schematic of localized binding of Noggin to BMP7 (E). Schematic of localized binding of the OLFM4-Noggin complex to BMP7 (F). Co-IP for Noggin in iBAT form Ctrl group and Olfm4CKO group (G). Fluorescence localization (Left) and statistical analysis (Right) of Noggin and BMP7 in iBAT (scale bar, 5 µm), (n = 6 mice per group) (H). Fluorescence localization (Left) and statistical analysis (Right) of BMP7 and SOX10 in iBAT, (scale bar, 10 µm), (n = 6 mice per group) (I). Co-IP assay for Noggin in iBAT form Ctrl+PBS, Olfm4CKO+PBS and Olfm4CKO + ReOLFM4 group (J). Immunoblot (Left) and statistical analysis (Right) of Cyclin D1 in iBAT (n = 6 mice per group) (K). Fluorescence localization (Left) and statistical analysis (Right) of p-ERK in iBAT (scale bar, 10 µm) (n = 6 mice per group) (L). Immunoblot (Left) and statistical analysis (Right) of BMPR1B, p-ERK and EGR1 in primary SCs (n = 3 independent biological replicates) (M). FACS plots (Left) and statistical analysis (Right) of SOX10+/EGR1+ cells isolated from primary SCs (n = 3 independent biological replicates) (N). All Data are mean ± s.e.m. of biologically independent samples. Statistical analysis was performed using two-tailed unpaired Student’s t-test (CI), one-way ANOVA (two-sided) with Tukey post hoc test for pairwise comparisons (BK) and two-way ANOVA with Tukey post hoc test for pairwise comparisons (M, N). All experiments were independently repeated at least three times. Source data are provided as a Source Data file.
Fig. 6
Fig. 6. The MEK/ERK signaling pathway mediates temperature-induced SC remodeling.
Mice were randomly assigned to thermoneutral (TN) housing, standard environment (SE) or restoration of standard environment (RSE). The SE group as a control (A). Immunoblot (Left) and statistical analysis (Right) of P0, Periaxin, MBP, and CD44 in iBAT (n = 3 mice per group) (B). Immunoblot (Top) and statistical analysis (Bottom) of TH and CGRP in iBAT (n = 3 mice per group) (C). Immunoblot (Top) and statistical analysis (Bottom) of EGR1 and SOX10 in iBAT (n = 6 mice per group) (D). Fluorescence localization (Left) and relative immunofluorescence intensity of SOX10-positive or SOX10-negative cells (against DAPI) statistical analysis (Right) of EGR1 in iBAT (scale bar, 20 µm) (n = 6 mice per group) (E). Fluorescence localization (Left) and relative immunofluorescence intensity statistical analysis (Right) of P0 (F) and CD44 (G) (against DAPI) in iBAT (scale bar, 10 μm) (n = 6 mice per group). Immunoblot (Top) and statistical analysis (Bottom) of p-ERK in iBAT (H). Fluorescence localization (Left) and relative immunofluorescence intensity of SOX10-positive or SOX10-negative cells (against DAPI) statistical analysis (Right) of p-ERK in iBAT (scale bar, 10 µm) (n = 6 mice per group) (I). Immunoblot (Left) and statistical analysis (Right) of P0, Periaxin, MBP, and CD44 in iBAT (n = 3 mice per group) ( J). Immunoblot (Left) and statistical analysis (Right) of EGR1 and SOX10 in iBAT (n = 6 mice per group) (K). Immunoblot (Left) and statistical analysis (Right) of TH and CGRP in iBAT (n = 3) (L). All Data are mean ± s.e.m. of biologically independent samples. Statistical analysis was performed using two-tailed unpaired Student’s t-test (B, C) and one-way ANOVA (two-sided) with Tukey post hoc test for pairwise comparisons (DL). All experiments were independently repeated at least three times with similar results. Source data are provided as a Source Data file.
Fig. 7
Fig. 7. Temperature-induced remodeling of SCs regulates BAT neural network remodeling.
TEM (Left) of The ultrastructure of myelinated nerve endings (A) and unmyelinated nerve endings (B) in iBAT. Myelinated nerve endings and unmyelinated nerve endings are indicated by orange arrows (right), and their width and number were quantified (n = 6 mice per group) (scale bars, 2 µm and 500 nm). (Top) The neuropeptides CGRP, SP, and TH were extracted from iBAT and analyzed by WB. (Bottom) Relative expression level of the target protein to GAPDH, analyzed in ImageJ software (n = 6 mice per group) (C). (Left) The neuropeptides CGRP (D) and TH (E) in iBAT, analyzed by fluorescence confocal microscopy (scale bars, 10 μm). (Right) Relative intensity of the immunofluorescence signals (against DAPI), analyzed in ImageJ software (n = 6 mice per group). All Data are mean ± s.e.m. of biologically independent samples. Statistical analysis was performed using one-way ANOVA (two-sided) with Tukey post hoc test for pairwise comparisons (AE). All experiments were independently repeated at least three times with similar results. Source data are provided as a Source Data file.
Fig. 8
Fig. 8. Inhibition of SC dedifferentiation prevents BAT dysfunction induced by thermoneutrality.
The MEK/ERK inhibitor PD0325901 was administered to thermoneutrally treated mice (TN-PD). The same amount of placebo was given daily to another group of thermoneutrality treated mice (TN-PL) and standard environment mice (SE-PL) as controls (A). (Left) Myelinating SC markers P0, Periaxin, and MBP, and non-myelinating SC markers CD44 and GFAP in iBAT were extracted and analyzed by WB. (Right) Relative expression level of the target protein to tubulin, analyzed in ImageJ software (n = 6 mice per group) (B). (Left) Myelin protein P0 (C) and the non-myelinating SC marker CD44 (D) in iBAT, analyzed by fluorescence confocal microscopy (scale bar, 10 μm). (Right) Relative intensity of the immunofluorescence signals (against DAPI), analyzed in ImageJ software (n = 6 mice per group). (Left) Ultrastructure of myelinated nerve endings (E) and unmyelinated nerve endings (F) in iBAT, analyzed by TEM. Myelinated nerve endings and unmyelinated nerve endings are indicated by red arrows (right), and their width and number were quantified (n = 6 mice per group) (scale bars, 2 µm and 0.5 µm). (Top) The neuropeptides CGRP, SP, and TH were extracted from iBAT, and analyzed by WB. (Bottom) Relative expression level of the target protein to GAPDH, analyzed in ImageJ software (n = 6 mice per group) (G). (Left) The neuropeptides CGRP (H) and TH (I) in iBAT, analyzed by fluorescence confocal microscopy (scale bars, 20 μm). (Right) Relative intensity of the immunofluorescence signals (against DAPI), analyzed in ImageJ software (n = 6 mice per group). All Data are mean ± s.e.m. of biologically independent samples. Statistical analysis was performed using one-way ANOVA (two-sided) with Tukey post hoc test for pairwise comparisons (B-I). All experiments were independently repeated at least three times with similar results. Source data are provided as a Source Data file.

Similar articles

References

    1. Liu, J., Wang, Y. & Lin, L. Small molecules for fat combustion: targeting obesity. Acta Pharm. Sin. B9, 220–236 (2019). - PMC - PubMed
    1. Sun, W. F. et al. snRNA-seq reveals a subpopulation of adipocytes that regulates thermogenesis. Nature587, 98 (2020). - PubMed
    1. Yoneshiro, T. et al. Recruited brown adipose tissue as an antiobesity agent in humans. J. Clin. Investig.123, 3404–3408 (2013). - PMC - PubMed
    1. Kajimura, S., Spiegelman, B. M. & Seale, P. Brown and beige fat: physiological roles beyond heat generation. Cell Metab.22, 546–559 (2015). - PMC - PubMed
    1. Chouchani, E. T., Kazak, L. & Spiegelman, B. M. New advances in adaptive thermogenesis: UCP1 and beyond. Cell Metab.29, 27–37 (2019). - PubMed

LinkOut - more resources