. 2025 Jun 4;16(1):5204.
doi: 10.1038/s41467-025-60545-3.

Reduction of SEM charging artefacts in native cryogenic biological samples

Affiliations

Reduction of SEM charging artefacts in native cryogenic biological samples

Abner Velazco et al. Nat Commun. .

Abstract

Scanning electron microscopy (SEM) of frozen-hydrated biological samples allows imaging of subcellular structures at the mesoscale in a representation of their native state. Combined with focused ion beam milling (FIB), serial FIB/SEM can be used to build a 3-dimensional model of cells and tissues. The correlation of specific regions of interest with cryo-electron microscopy (cryoEM) can additionally enable subsequent high-resolution analysis. However, the use of serial FIB/SEM imaging-based methods is often limited due to charging artefacts arising from insulating areas of cryogenically preserved samples. Here, we demonstrate the use of interleaved scanning to attenuate these artefacts, allowing the observation of biological features that otherwise would be masked or distorted. We apply our method to samples where inherent features were not visible using conventional scanning. These examples include membrane contact sites within mammalian cells, visualisation of the degradation compartment in the algae E. gracilis and observation of a network of membranes within different types of axons in an adult mouse cortex. The proposed alternative scanning method could also be applied to imaging other non-conductive specimens in SEM.


Conflict of interest statement

Competing interests: The authors declare no competing interests.

Figures
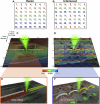
Fig. 1
Fig. 1. Schematic of different scanning patterns.
A, B Field of view (black rectangle) imaged using a 7 × 7 array where the rainbow colour corresponds to the temporal distribution of the fluence (red at the start, blue at the end of the time sequence). A Raster scanning. B Interleaved scanning which skips 2 positions in x and 2 positions in y. CF Overlay of vitrified RPE-1 with a schematic representation of pixel positions (black squares) in a 16 × 16 array. The green cone represents the electron beam. The straight arrows represent raster scanning while the curved arrows indicate pixel skipping during interleaved scanning. The colour of the arrow represents the pixel acquired (white) or yet to be acquired (yellow). E, F Spatial distribution of the electron fluence and isotropic charge dissipation (red). Yellow arrows indicate pixels have been imaged; green arrows indicate pixels yet to be imaged. Red circles illustrate charge dissipation radiating outwards at each position.
Fig. 2
Fig. 2. Effect of electron fluence distribution on charging artefacts (SEM imaging at 52o angle to the FIB milled sample plane).
A–C Representative images of brain tissue for different pixel fluence distribution strategies using raster or interleaved scan patterns. D Enlarged area highlighted in (C) by a green dashed rectangle that shows detail visible within the membranous layers of myelination in the brain. Green arrows indicate the myelin sheath while pink arrows indicate the oligodendrocyte inner tongue. C, D Interleaved frame integration at 100 ns dwell time ×100 repetitions shows the greatest improvement in reducing charging artefacts. Scale bar: 2 µm. E Mean of image intensity histograms of different images (population n > 5, where n represents the number of acquisitions at the same scan condition over different samples. The exact size of the population can be found as each circle is a n.) from vitrified RPE-1 cells, E. gracilis and mouse brain images for raster line integration (yellow), raster frame integration (orange) and interleaved frame integration (blue). Population median (middle line), population mean (cross), median of the bottom half (bottom box), median of the top half (top box). Vertical lines extend to minimum and maximum intensity values. Full statistical analysis is given in Supplementary Table 1. Images acquired using interleaved scanning with frame integration using a short dwell time and high integration (100 ns dwell time ×100 repetitions) form a dataset for which the mean intensity is 122, closest to 127, which is the mid-range histogram intensity value of the 8-bit image data. Deviation in intensity from this value indicates charging as described in the text.
Fig. 3
Fig. 3. Charging artefact reduction in RPE-1 cells allows the observation of lipid droplet (LD) surrounding environments.
Vitrified cells imaged at 52° with respect to the FIB milled sample plane using a 100 ns dwell time x100 repetitions. AC Overview of a slice from RPE-1 imaged using raster line integration, raster frame integration and interleaved frame integration, respectively. Scale bar: 2 µm. DF enlargement of the pink boxes in (AC). White arrow: membrane in the vicinity of a LD. Black arrow: content of a degradative compartment. m: mitochondria. Scale bar 0.5 µm. GI Enlargement of the green boxes in (AC); brightness and contrast were modified to improve visualisation. White arrow: wrapping of endoplasmic reticulum (ER) around LD. Scale bar 1 µm.
Fig. 4
Fig. 4. SEM volume imaging of E. gracilis.
E. gracilis imaged at 52° with respect to the FIB milled sample plane using 100 ns dwell time ×100 repetitions. A 1600 µm³ volume in focus aligned and subject to manual segmentation of the region of interest. A, CG Images after background removal (see “Methods”) to assist segmentation. For A, CG, the number in the upper corner is the z-location within the volume. A Membranes of the degradation compartment segmented (red line) and content (blue line). Scale bar: 2 µm. B Density (ratio of the content volume within the degradative compartment) as a function of the volume of the degradative compartment showing the presence of four unrelated populations (quadrant count ratio = 0.037). CE Enlarged panels from the coloured boxes in (A), highlighting the membrane deformation of organelles in close proximity to the degradation compartment (DC) or empty vesicles and other organelles including mitochondria (m) and chloroplast (C) or an absence of contact with, for example, the Golgi apparatus (GA). The limits of these contacts are indicated by a black arrow. Scale bars: 500 nm (C), 250 nm (DE). F, G Enlarged panels of the eyespot and 3D segmentation, proximal to the reservoir (R). Compartments in proximity (V: vesicle, C: chloroplast). Scale bar: 250 nm.
Fig. 5
Fig. 5. SEM volume imaging of mouse brain.
A 118-day old mouse brain imaged at 90° with respect to the FIB milled sample plane using 100 ns dwell time ×100 repetitions. A 1334 µm³ volume in focus was aligned and manually segmented for the region of interest. A Segmented volumes. B, C Slices from the volume with overlayed segmentation. Scale bar 2 µm. Boxes in A are superimposed on B and C and enlarged in boxes (DG) with the respective coloured box containing representative slices in the volume. Numbers indicate the z-location within the volume. D thin myelin axon with internal cytoplasmic channels (CC). Scale bar: 250 nm. E intermediate axon with extended CC, mitochondria (m). Scale bar: 250 nm. F Thick myelin, large axon and the interaction with 2 oligodendrocytes showing the inner tongues (IT) and the outer tongues (OT). Scale bar: 500 nm. Mitochondria are also visible in the axon and one of the outer tongues. G Microglia cells and their proximity to different axons showing a stretch of colocalization, as well as internal organelles including mitochondria (m), vesicles (v) and inner tongues (IT). Scale bar 500 nm.

Similar articles

References

    1. Angert, I., Burmester, C., Dinges, C., Rose, H. & Schröder, R. R. Elastic and inelastic scattering cross-sections of amorphous layers of carbon and vitrified ice. Ultramicroscopy63, 181–192 (1996).
    1. Wu, S., Armache, J.-P. & Cheng, Y. Single-particle cryo-EM data acquisition by using direct electron detection camera. Microscopy65, 35–41 (2016). - PMC - PubMed
    1. Collinson, L. M. et al. Volume EM: a quiet revolution takes shape. Nat. Methods20, 777–782 (2023). - PMC - PubMed
    1. Wong, W. K., Thong, J. T. L. & Phang, J. C. H. Charging identification and compensation in the scanning electron microscope. In Proc 1997 6th International Symposium on the Physical and Failure Analysis of Integrated Circuits 97–102 (IEEE). 10.1109/IPFA.1997.638151.
    1. Krakow, W. & Nixon, W. C. The behavior of charged particles in the scanning electron microscope. IEEE Trans. Ind. Appl.IA-13, 355–366 (1977).

LinkOut - more resources