. 2025 Jun 4;16(1):5197.
doi: 10.1038/s41467-025-60498-7.

A multisensor high-temperature signaling framework for triggering daytime thermomorphogenesis in Arabidopsis

Affiliations

A multisensor high-temperature signaling framework for triggering daytime thermomorphogenesis in Arabidopsis

De Fan et al. Nat Commun. .

Abstract

The phytochrome B (phyB) photoreceptor and EARLY FLOWERING 3 (ELF3) are two major plant thermosensors that monitor high temperatures primarily at night. However, high temperatures naturally occur during the daytime; the mechanism of daytime thermosensing and whether these thermosensors can also operate under intense sunlight remain ambiguous. Here, we show that phyB plays a substantial role in daytime thermosensing in Arabidopsis, and its thermosensing function becomes negligible only when the red light intensity reaches 50 μmol m-2 s-1. Leveraging this restrictive condition for phyB thermosensing, we reveal that triggering daytime thermomorphogenesis requires two additional thermosensory pathways. High temperatures induce starch breakdown in chloroplasts and the production of sucrose, which stabilizes the central thermal regulator PHYTOCHROME-INTERACTING FACTOR 4 (PIF4) by antagonizing phyB-dependent PIF4 degradation. In parallel, high temperatures release the inhibition of PIF4 transcription and PIF4 activity by ELF3. Thus, our study elucidates a multisensor high-temperature signaling framework for understanding diverse thermo-inducible plant behaviors in daylight.


Conflict of interest statement

Competing interests: The authors declare no competing interests.

Figures

Fig. 1
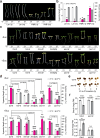
Fig. 1. Dissecting phyB-dependent and phyB-independent thermosensing in the light.
a Temperature-response curves of hypocotyl elongation under various intensities of R light reveal distinct thermosensing mechanisms in the light: a mechanism depending solely on phyB thermal reversion (phyB dependent) at low temperatures and a mechanism also requiring thermosensing independently of phyB thermal reversion (multisensor dependent) at high temperatures. Hypocotyl lengths were measured in 4-d-old Col-0 seedlings grown at 12 °C, 16 °C, 21 °C, and 27°C under a range of continuous R light intensities from 0.1 to 50 μmol m−2 s−1. The blue and pink shades highlight the temperature responses at the low-temperature range between 12 and 21 °C (solid lines) and the high-temperature range between 21 and 27 °C (dashed lines), respectively. b Distinct effects of light intensity on the low- and high-temperature responses. The phyB-dependent low-temperature (12–21 °C) and multisensor-dependent high-temperature (21–27 °C) responses were quantified as the percent increase in hypocotyl length in the respective temperature ranges and plotted against light intensity. c YHBg seedlings lack the phyB-dependent low-temperature response. The left panel shows the temperature-response curve of 4-d-old Ler and YHBg seedlings grown under 2.5 μmol m−2 s−1 R light. The blue shade highlights the phyB-dependent response between 12 and 21 °C. The right panel shows the hypocotyl lengths of Ler and YHBg seedlings at 12 and 21 °C. The blue bars show the relative response, which is defined as the hypocotyl response at 21 °C in YHBg relative to that in Ler (set at 100%). d Images of 4-d-old Ler and YHBg seedlings grown under 50 μmol m−2 s−1 R light at either 21 or 27 °C. e YHBg seedlings retained the multisensor-dependent high-temperature response. The left panel shows the temperature-response curve of 4-d-old Ler and YHBg seedlings grown under 50 μmol m−2 s−1 R light. The pink shade highlights the multisensor-dependent response between 21 and 27 °C. The right panel shows the hypocotyl lengths of Ler and YHBg seedlings at 21 and 27 °C. The magenta bars show the relative response, which is defined as the hypocotyl response at 27 °C in YHBg relative to that in Ler (set at 100%). For (ac and e), the error bars represent the s.e. (n = three biological replicates), and the centers of the error bars indicate the mean. For (c and e), a significant difference in the relative response between Ler and YHBg was defined as a greater than twofold and statistically significant change (p < 0.05) in the temperature response based on a two-tailed Student’s t-test (**** indicates p < 0.0001) and otherwise was defined as no significant difference (n.s). The underlying source data for the hypocotyl measurements in (ac and e) are provided in the Source Data file.
Fig. 2
Fig. 2. Thermo-inducible starch breakdown in chloroplasts is required for thermomorphogenesis in the light.
a Images of 4-d-old Ler and YHBg seedlings grown in the dark at either 21 or 27 °C without (-s) or with (+s) sucrose. b Hypocotyl length measurements showing the thermoresponsive hypocotyl growth of the Ler and YHBg seedlings in (a). The magenta bars show the percent increase in hypocotyl length at 27 °C compared to 21 °C. Different letters denote statistically significant differences in the change in hypocotyl length (one-way ANOVA, Tukey’s HSD, p < 0.05, n = 3 biological replicates). c Images of 4-d-old Col-0, hmr-5, hmr-22, hmr-5pifq, sex1-8, Ler, and tps1-12 seedlings grown under 50 μmol m−2 s−1 R light at either 21 or 27 °C without or with sucrose. d Hypocotyl length measurements of the genotypes described in (c). The magenta bars show the relative response, which is defined as the hypocotyl response of a mutant at 27 °C relative to that of the corresponding wild-type (set at 100%). A significant difference in the relative response between the indicated mutants and the wild-type was defined as a greater than twofold and statistically significant change based on a two-tailed Student’s t-test (** p  <  0.01, *** p <  0.001, **** p < 0.0001), and otherwise was defined as no significant difference (n.s.). e Iodine staining showing the starch contents of 4-d-old Col-0 and sex1-8 seedlings grown under 50 μmol m−2 s−1 R light at the indicated time points during the 21-27 °C transition. f Quantification of the starch (left panel) and sucrose (right panel) levels in Col-0 and sex1-8 seedlings at the 0 and 8 h time points during the 21–27 °C transition shown in (e). A significant difference between the 0 and 8 h samples was calculated using a two-tailed Student’s t-test (** p  <  0.01,*** p <  0.001, **** p < 0.0001). For (b, d, and f), all error bars represent the s.e. (n = three biological replicates), and the centers of the error bars indicate the mean. The underlying source data for the hypocotyl measurements in (b and d) and for the starch and sucrose quantifications in (f) are provided in the Source Data file.
Fig. 3
Fig. 3. Sucrose promotes PIF4 accumulation.
a Immunoblots showing the PIF4 levels in 4-d-old Col-0, hmr-5, and phyB-9 seedlings grown under 50 μmol m−2 s−1 R light at either 21 or 27 °C without (-s) or with (+s) sucrose. b Immunoblots showing the PIF4 levels in 4-d-old Col-0 and hmr-22 seedlings under 50 μmol m−2 s−1 R light without or with sucrose treatment during the 21–27 °C transition. c Immunoblots showing the PIF4 levels in 4-d-old Col-0 and sex1-8 seedlings grown under 50 μmol m−2 s−1 R light at either 21 or 27 °C. d Immunoblots showing the PIF4 levels in 4-d-old Col-0 and sex1-8 seedlings grown under 50 μmol m−2 s−1 R light during the 21–27 °C transition. e Quantitative real-time PCR results showing the transcript levels of YUC8, IAA19, and PIF4 in Col-0 and sex1-8 seedlings during the 21–27 °C transition as described in (d). f Immunoblots showing the PIF4 levels in 4-d-old Ler and tps1-12 seedlings grown under 50 μmol m−2 s−1 R light at either 21 or 27 °C. g Immunoblots showing the PIF4 levels in 4-d-old Ler and tps1-12 seedlings grown under 50 μmol m−2 s−1 R light during the 21–27 °C transition. h Quantitative real-time PCR (qRT-PCR) results showing the transcript levels of YUC8, IAA19, and PIF4 in Ler and tps1-12 seedlings during the 21–27 °C transition as described in (g). For (a–d, f, and g), actin was used as the loading control. The relative PIF4 levels normalized to actin are shown. The immunoblot experiments were independently repeated three times with similar results. Error bars for the protein quantifications in (c, d, f, and g) represent the s.d. (n = three biological replicates), and the centers of the error bars indicate the mean. Significant differences between the PIF4 protein levels in Col-0 and the mutants were calculated using two-tailed Student’s t-tests (** p  <  0.01, *** p <  0.001); n.s. stands for no significant difference. For (e and h), the transcript levels of the indicated genes were calculated relative to those of PP2A. Error bars represent the s.e. (n = three biological replicates), and the centers of the error bars indicate the mean. Significant differences in the transcript levels of the indicated genes between Col-0 and the mutants were calculated using two-tailed Student’s t-tests (* p  <  0.05, ** p  <  0.01, *** p <  0.001); n.s. stands for no significant difference. The underlying source data for the immunoblots in (ad, f, and g) and the qRT-PCR results in (e and h) are provided in the Source Data file.
Fig. 4
Fig. 4. Concerted actions of dual thermosensory pathways trigger PIF4 activity.
a Venn diagram depicting the 173 PIF-dependent genes whose induction requires both the chloroplast-sucrose-mediated and Sensor 2-dependent thermosensory pathways. Sucrose-induced genes: induced genes comparing hmr-5_27S with hmr-5_27; Sensor2-induced genes: induced genes comparing hmr-5_27S with hmr-5_21S; Sensor2-induced PIF-independent genes: induced genes comparing hmr-5pifq_27S with hmr-5pifq_21S. b Heatmap showing the relative expression levels of the 173 dual-sensor-induced and PIF-dependent genes in hmr-5 at 21 and 27 °C with or without sucrose. c GO enrichment analysis of the 173 dual-sensor-induced and PIF-dependent genes. d Heatmap showing the relative expression levels of four auxin biosynthesis genes, YUC2, YUC5, YUC8, and YUC9, in hmr-5 at 21 and 27 °C with or without sucrose treatment. e Images of 4-day-old Col-0, hmr-5, and hmr-5pifq seedlings grown under 50 μmol m−2 s−1 R light at 21 °C on regular growth media or media with sucrose (S), picloram (P), or both sucrose and picloram (S + P). f Hypocotyl length measurements of the Col-0, hmr-5, and hmr-5pifq seedlings described in (e). Error bars represent the s.e. (n = three biological replicates), and the centers of the error bars indicate the mean. Different lowercase letters denote statistically significant differences in hypocotyl length (one-way ANOVA, Tukey’s HSD, p  <  0.05, n  =  3 biological replicates). The underlying source data for the hypocotyl measurements in (f) are provided in the Source Data file.
Fig. 5
Fig. 5. ELF3-dependent thermal regulation of PIF4 activity.
a Iodine staining showing the starch contents of 4-d-old Col-0 and elf3-1 seedlings grown under 50 μmol m−2 s−1 R light during the 21–27 °C transition. b Images of 4-d-old Col-0 and elf3-1 seedlings grown at either 21 or 27 °C without (-s) or with (+s) sucrose. c Hypocotyl length measurements of the Col-0 and elf3-1 seedlings described in (b). Error bars for the hypocotyl measurements represent the s.e. (n = three biological replicates), and the centers of the error bars indicate the mean. The magenta bars show the relative response, which is defined as the hypocotyl response of a mutant at 27 °C relative to that of Col-0 (set at 100%). The relative thermal responses for elf3-1 without or with sucrose are shown. Different letters denote statistically significant differences in the relative response (one-way ANOVA, Tukey’s HSD, p < 0.05, n = 3 biological replicates). elf3-1 seedlings treated with sucrose grown at 21 °C were slightly taller than Col-0 grown at 27 °C, but the difference was within twofold and therefore considered not significant (n.s, two-tailed Student t-test). d Immunoblot analysis of the PIF4 levels in 4-d-old Col-0 and elf3-1 seedlings grown under 50 μmol m−2 s−1 R light without or with sucrose during the 21–27 °C transition. Actin was used as a loading control. The relative PIF4 levels normalized to the corresponding levels of actin are shown. e Quantification of the PIF4 levels shown in (d). Error bars represent the s.d. (n = four biological replicates), and the centers of the error bars indicate the mean. f qRT-PCR analysis of the PIF4 transcript levels in 4-d-old Col-0 and elf3-1 seedlings grown under 50 μmol m−2 s−1 R light without or with sucrose during the 21–27 °C transition. Error bars represent the s.e. (n = three biological replicates), and the centers of the error bars indicate the mean. For (e and f), different letters denote statistically significant differences among the values in the same genotype (one-way ANOVA, Tukey’s HSD, p  <  0.05, n  =  3 biological replicates). g qRT-PCR analysis of the transcript levels of YUC9 and IAA19 in 4-d-old Col-0 and elf3-1 seedlings grown under 50 μmol m−2 s−1 R light without or with sucrose at either 21 or 27 °C. Asterisks indicate a statistically significant difference based on a two-tailed Student’s t-test (* p  <  0.05, ** p  <  0.01, *** p  <  0.001); n.s. stands for no significant difference. For (f and g), the transcript levels were quantified relative to those of PP2A. Error bars represent the s.e. (n = three biological replicates), and the centers of the error bars indicate the mean. The underlying source data for the hypocotyl measurements in (c), the immunoblots in (d and e), and the qRT-PCR analysis of transcript levels in (f and g) are provided in the Source Data file.
Fig. 6
Fig. 6. A multisensor high-temperature signaling framework for triggering daytime thermomorphogenesis.
Three thermosensory mechanisms – phyB thermal-reversion-dependent, chloroplast-sucrose-mediated, and ELF3-dependent—work collaboratively and converge on the central thermal regulator PIF4 to trigger thermomorphogenesis in the light. a At 21 °C, phyB represses PIF4 accumulation by promoting its degradation, and ELF3 inhibits both PIF4 transcription and PIF4 activity; consequently, PIF4 is repressed at the transcript, protein, and activity levels. In contrast, at 27 °C, thermo-induced starch degradation in the chloroplasts and sucrose production promote PIF4 accumulation by inhibiting phyB-mediated PIF4 degradation. In parallel, the ELF3-dependent inhibition of PIF4 transcription and PIF4 activity is released. The combined induction of PIF4 accumulation and activity triggers the transcriptional activation of growth-relevant PIF4 target genes, including those associated with auxin biosynthesis and signaling, thereby triggering thermomorphogenesis responses such as hypocotyl growth. The accelerated thermal reversion of phyB at high temperatures can also enhance PIF4 stabilization in relatively low light intensities. However, under strong light conditions where the intensity of R light reaches 50 μmol m−2 s−1 or above, because the rate of phyB photoactivation (k1) is significantly higher than that of phyB thermal reversion (kr), the effect of phyB thermal-reversion-dependent thermosensing becomes negligible, leaving only the chloroplast-sucrose-mediated and ELF3-dependent thermosensing mechanisms operational, as shown in the model. b In hmr-5, under intense light conditions, both the phyB-dependent and chloroplast-sucrose-mediated thermosensory mechanisms are eliminated, and thermomorphogenesis is regulated by the ELF3-dependent thermosensing mechanism only. In this scenario, although the level of PIF4 transcripts can still be enhanced by high temperatures, PIF4-mediated thermomorphogenesis is blocked because PIF4 accumulation is repressed by phyB at both temperatures. c In hmr-5 supplemented with sucrose, exogenous sucrose promotes PIF4 accumulation by antagonizing phyB-mediated PIF4 degradation, thereby bypassing the defect in the chloroplast-sucrose-mediated thermosensory mechanism. However, although the levels of PIF4 can be enhanced at both temperatures, sucrose alone cannot trigger thermomorphogenesis at 21 °C because PIF4 activity is still repressed by ELF3. Therefore, in this scenario, thermomorphogenesis is regulated solely by the ELF3-dependent thermosensory mechanism. d In elf3-1, under intense light conditions, only the chloroplast-sucrose-mediated thermosensory mechanism remains operational. As a result, exogenous sucrose can fully turn on thermomorphogenesis at 21 °C. The image elements of chloroplasts, thermometers, and double-stranded DNA were created in BioRender. Chen, M. (2025) https://BioRender.com/9wqzqu2.

References

    1. Delker, C., Quint, M. & Wigge, P. A. Recent advances in understanding thermomorphogenesis signaling. Curr. Opin. Plant Biol.68, 102231 (2022). - PubMed
    1. Casal, J. J. & Balasubramanian, S. Thermomorphogenesis. Annu. Rev. Plant Biol.70, 321–346 (2019). - PubMed
    1. Casal, J. J., Murcia, G. & Bianchimano, L. Plant thermosensors. Annu. Rev. Genet.58, 135–158 (2024). - PubMed
    1. Kerbler, S. M. & Wigge, P. A. Temperature sensing in plants. Annu. Rev. Plant Biol.74, 341–366 (2023). - PubMed
    1. Krahmer, J. & Fankhauser, C. Environmental control of hypocotyl elongation. Annu. Rev. Plant Biol.75, 489–519 (2024). - PubMed

MeSH terms