. 2025 Jun 4;16(1):5172.
doi: 10.1038/s41467-025-60193-7.

Androgens inhibit protective CD8+ T cell responses against pre-erythrocytic malaria parasites in mice

Affiliations

Androgens inhibit protective CD8+ T cell responses against pre-erythrocytic malaria parasites in mice

Caroline J Duncombe et al. Nat Commun. .

Abstract

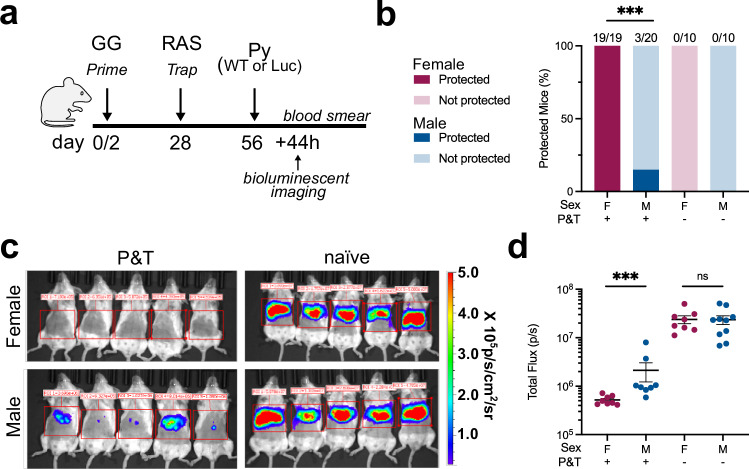
Attenuated whole organism vaccines targeting the malaria liver stage reliably confer sterile immunity. These vaccines completely protect female mice from infection, but protection in male mice remains unproven. We discover that male mice vaccinated with prime-and-trap, a whole organism-based vaccine strategy, exhibit poorer protection against Plasmodium sporozoite challenge than females. We investigate this sex difference, and identify vaccinated males have fewer hepatic memory CD8+ T cells than females when scaling for liver biomass, and reduced inflammatory responses post-vaccination. Surgical hormone manipulation clarifies that the presence of testicular hormones hinders protection in male mice. The presence of androgens does not affect memory CD8+ T cell quantity nor quality, but reduces recruitment of CD8+ T cells in male liver tissues via a restricted inflammatory response. Here, we show both males and females form functional memory responses following prime-and-trap vaccination, but the presence of androgens during sporozoite challenge impair protection in male mice.


Conflict of interest statement

Competing interests: C.J.D., N.S., F.N.W., A.S.P., E.D.L., K.B., E.N.C, A.C.K., A.M.S, C.S. and M.J.S. declare no competing interests. S.C.M. filed a patent application on selected aspects of the prime-and-trap concept through the University of Washington. S.C.M. has equity in a startup company (Sound Vaccines, Inc.) that is negotiating with the University of Washington for rights to this intellectual property. The relationship between the authors and Sound Vaccines, Inc., has been reviewed by the University of Washington and complies with all University and State of Washington policies on such activities. K.A.D. is a paid contractor for Seattle Biosoftware, which had no input or association with this study.

Figures

Fig. 1
Fig. 1. Prime-and-trap malaria vaccination induces sex-specific protection against sporozoite challenge.
a Scheme of male (M) and female (F) BALB/cJ mice prime-and-trap (P&T) vaccination experiments. b Percentages of mice protected or not protected against challenge with 0.5 − 1.0 × 103 Py-WT sporozoites, as measured by blood parasitemia up to day 14 post-challenge. Numbers above bars indicate numbers of protected mice out of the total mice challenged, derived from 4 independent experiments. c Representative rainbow images of luminescence in livers 44 h post infection (hpi) with 1 × 104 Py-Luc sporozoites. Rainbow scales are expressed in radiance (p/s/cm2/sr). d Quantification of bioluminescent signal in log-transformed total flux (p/s) from mice at 44 hpi (2 independent replicates, n = 8–10/group). Groups in b were compared using a two-sided Fisher’s exact test, and groups in d were compared by a two-sided Wilcoxon test; only relevant comparisons are depicted. Error bars represent mean ± s.e.m; ns = p > 0.05, ***p < 0.001. Source data are provided as a Source Data file.
Fig. 2
Fig. 2. Higher density of hepatic memory CD8+ T cells in female mice.
a Male (M) and female (F) BALB/cJ mice were vaccinated with the prime-and-trap (P&T) regimen. 28 days later, liver cells were analyzed by flow cytometry. b Representative flow plots of CD4 and CD8 surface markers on CD3+ cells isolated from the liver of mice. c Ratio of CD4-to-CD8 T cells in the liver of P&T vaccinated (+) and unvaccinated mice (-) female (F) and male (M) BALB/cJ mice. d Representative flow plots of IFN-γ (top), CD107a (middle), and TNF (bottom) on CD8+ T cells isolated from the liver and ex vivo stimulated with PyCSP280-288 peptide. e Liver weights of unvaccinated (open circle) or P&T vaccinated (closed circle) mice. f, g Quantification of CD8+ T cells responding to PyCSP280-288 (SYVPSAEQI) peptide defined by total number of IFN-γ+ and/or TNF+ and/or CD107a+ producing CD8+ T cells per gram of liver (f) and as proportion of CD3+ T cells (g). h, i Quantification of proportion of IFN-γ+ (left), TNF+ (middle), CD107a+ (right) (h), and IFN-γ+ TNF+ CD107a+ (i) producing CD8+ T cells in the liver. Detailed gating information is included in Supplementary Fig. S3. Data for c–i are shown from 3 independent experiments (n = 14 P&T groups, n = 5–7 unvaccinated group per sex). j Representative flow cytometry plot depicting CSP-tetramer+CD44hi CD8+ T cells Trm, Tem, and Trm phenotypes by markers CD69 (left) and CXCR3 (right). See supplementary Fig. S4 for the gating tree. k Frequency of CSP-tetramer+CD44hi Tem (CD62L-CD69-), Tcm (CD62L+CD69-), Trm (CD62L-CD69+) subsets of CD8+ T cells in the liver. Individual p-values for significant differences are shown, colored to correspond to memory T cell subsets where relevant. l. Frequency of CSP-tetramer+CXCR3+CD62L-CD69+CD44hi cells of CD8+ T cells in the liver. Data for j–l are shown from 2 independent experiments (n = 8–9). Statistical significance for data in c, f–i, k–I, was determined by Kruskal-Wallis test with Dunn’s multiple comparison and data in e was evaluated with a two-sided Wilcoxon Test; error bars represent mean ± s.e.m; ***p < 0.001, **p < 0.01, *p < 0.05, ns p > 0.05. Source data are provided as a Source Data file.
Fig. 3
Fig. 3. Male mice experience a restricted inflammatory response compared to females after Radiation Attenuated Sporozoite (RAS) immunization.
a Experimental schematic. Livers from mock vaccinated, prime-and-trap vaccinated (P&T), or RAS-only (RAS) vaccinated male (M) and female (F) BALB/cJ mice were collected 44 h or 6 days after the indicated vaccine for RNAseq (n = 4 per group). b Principal Component (PC) analysis of male and female transcriptomes following vaccination (containing all vaccinated and mock-vaccinated mice). c Hierarchical clustering on differentially expressed genes (FDR < 0.05 and |LogFC | > 1.5, Benjamini-Hochberg adjusted) and unique to response to vaccination (not shared with baseline differences between the mock-vaccinated male and female mice) with column annotations for sex, vaccine status, and timepoint. Euclidean distance metric was used for sample clustering. d GSEA of selected Hallmark (top) and Gene Ontology Biological Processes pathways (bottom) with genes ranked by fold-change values relative to mock injected mice by sex. NES = normalized enrichment score. Column annotations depict sex and vaccine status as designated in panel (c). e Heatmap and hierarchal clustering of genes that contain at least one differentially expressed gene in either timepoint (44 h or 6 days) (FDR < 0.01, |LogFC | > 2, Benjamini-Hochberg adjusted) and appear in the Gene Ontology Biological Processes pathway ‘T cell activation’. Column annotations depict sex, timepoint, and vaccine status. f Calculated pathway score of aggregate samples by T cell activation pathways for the 44 h and 6-day timepoint (n = 8/group) relative to mock samples (n = 4). Detailed explanation of calculation in Methods section. g Heatmap and hierarchal clustering of genes that contain at least one differentially expressed gene at the 6 days timepoint (FDR < 0.05, |LogFC | > 1, Benjamini-Hochberg adjusted) and appear in the Hallmark ‘Interferon alpha response’, or Gene Ontology Biological Processes pathways ‘Phagocytosis’ and ‘Response to chemokine’. Column annotations depict sex and vaccine status (c). h Calculated pathway score of aggregate samples by ‘Interferon alpha response’, ‘Phagocytosis’, and ‘Response to chemokine’ pathways at day 6 post-immunization (n = 8/group) relative to mock samples (n = 4). Data produced from one independent replicate. The figure f and h represent the mean value with 95% confidence intervals; **p < 0.01, *p < 0.05, ns p > 0.05.
Fig. 4
Fig. 4. Androgens decrease protection from challenge, but do not alter markers of memory CD8+ T cell fate and function.
a Experimental regimen with orchiectomy (ORX) in males (M), ovariectomy (OVX) in females (F), or sham (SHAM) surgery followed by prime-and-trap (P&T) vaccination. 28 days later, mice were either challenged or lymphocytes were analyzed by flow cytometry. b, c Protection following 1 × 103 Py-WT sporozoite challenge defined as no detectable pan-Plasmodium 18S rRNA copies 44 h post-challenge. Data are shown from 2 independent experiments (n = 8–10/group). Only relevant comparisons are shown. d Liver weight of ORX and SHAM operated male BALB/cJ mice vaccinated with P&T regimen and harvest 28 days later. e Quantification of total responsive CD8+ T cells to PyCSP280-288 peptide defined by total number of IFN-γ+, TNF+, and/or CD107a+ producing CD8+ T cells corrected by weight of liver. f Ratio of CD4-to-CD8 T cells in the liver. g Total number of IFN-γ+, TNF+, and/or CD107a+ producing CD8+ T cells as proportion of CD3+ T cells in the liver. h, i Quantification of proportion of IFN-γ+ TNF+ CD107a+ (h) and IFN-γ+ (left), TNF+ (middle), and CD107a+ (right) producing CD8+ T cells in the liver. Data for d–i are shown from 2 independent experiments (n = 7–9/group). j Frequency of CSP-tetramer+CD44hi Tem (CD62L-CD69-), Tcm (CD62L+CD69-), Trm (CD62L-CD69+) subsets of total CD8+ T cell. k Quantitative evaluation of TCF1 MFI on CSP-tetramer+ Trm cells in the liver (CSP-tetramer+CD62L-CD69+CD44hiCD8+ T cells). l, m Proportion of PD-1+ (l) and LAG-3+ (m) on liver Trm cells. Data for j–m are shown from 2 independent experiments (n = 7–9/group). Statistical significance for data in b and c was determine by two-sided Fisher exact test; data in e–j was determined by Kruskal–Wallis test with Dunn’s multiple comparison and data in d and k–m was evaluated with the two-sided Wilcoxon Test. In j, individual adjusted p-values for significant differences are shown, colored to correspond to memory T cell subsets where relevant. Error bars represent mean ± s.e.m; box plot depicts median, interquartile range, and whiskers extending to maximum and minimum values within 1.5x of the interquartile range; ***p < 0.001, **p < 0.01, *p < 0.05, ns p > 0.05. Source data are provided as a Source Data file.
Fig. 5
Fig. 5. Protection of male mice depends on hormone environment at time of challenge.
a Schedule of orchiectomy (ORX) in male (M) mice before or after prime-and-trap (P&T) vaccination as shown. After the completion of surgery at day 56, mice were rested 21 days to establish a new hormone equilibrium and then challenged with 1 × 103 Py-WT sporozoites. b Protection after Py-WT sporozoite challenge by pan-Plasmodium 18S rRNA RT-PCR from livers collected 44 h post-challenge. Data are shown from 2 independent experiments (n = 8–10/group). c Schedule of administration of acyline (Acy) in male mice at day 5 and 4 prior to either P&T vaccination (prior to gene gun and RAS) or prior to challenge, or both. Testosterone (T) add-back group received 3 injections of testosterone on day 3 and 1 prior to challenge and 1 day following challenge. Mice were challenged 28 - 42 days post P&T vaccination. d Protection after Py-WT sporozoite challenge by pan-Plasmodium 18S rRNA RT-PCR from livers collected 44 h post-challenge. Data are shown from 2 - 3 independent experiments (n = 10–14/group). Statistical significance for data in b and d was determined by a two-sided Fisher exact test. Only relevant comparisons are shown. Error bars represent mean ± s.e.m; ***p < 0.001, **p < 0.01, *p < 0.05, ns p > 0.05. Source data are provided as a Source Data file.
Fig. 6
Fig. 6. Androgens inhibit protective CD8+ T cell activity via inhibition of IFN-γ and Granzyme B production during recall response.
a Female (F), male (M), and orchiectomized male (ORX) BALB/cJ mice were vaccinated with the prime-and-trap (P&T) regimen. 35 days later, liver cells were analyzed by flow cytometry. b Representative flow plots of IFN-γ (top), TNF (middle top), CD107a (middle bottom), and Granzyme B (bottom) on CD8+ T cells isolated from the liver and ex vivo stimulated with PyCSP280-288 peptide in hormone free condition with dihydrotestosterone added to media ( + DHT) or with ethanol control (- DHT). c, d Quantification of proportion of cytokines IFN-γ (c - left) and TNF (c -right) and cytolytic markers Granzyme B (d - left) and CD107a (d - right) producing CD8+ T cells in the liver. e Quantification of proportion of IFN-γ+TNF+CD107a+ producing CD8+ T cells in the liver. f Quantification of proportion of Granzyme B+IFN-γ+TNF+CD107a+ producing CD8+ T cells in the liver. Data are shown from 2 independent experiments (n = 10-12/group, naïve composed of n = 6 per sex). Statistical significance for data in (c–f) was determined by a paired two-sided Wilcoxon Test. Box plot depicts median, interquartile range, and whiskers extending to maximum and minimum values within 1.5x of the interquartile range; ***p < 0.001, **p < 0.01, *p < 0.05, ns p > 0.05. Source data are provided as a Source Data file.
Fig. 7
Fig. 7. Androgens reduce recruitment of CD8+ cells to inflammatory foci.
a Female (F), male (M), and orchiectomized (ORX) male BALB/cJ mice were vaccinated with the prime-and-trap regimen (P&T) or left unvaccinated (-). 28 days later, mice were challenged with 1×10⁵ Py-WT spz and liver was split for fixation for immunohistochemistry and RT-PCR of host genes between 38 and 44 h. b Representative inflammatory foci as determined with immunohistochemistry (IHC) in liver tissue captured under light microscope in vaccinated (P&T + Py-WT), unvaccinated (Py-WT), and mock-challenge mice where red demarks CD8+ cells and blue marks nuclear stain. One slice of left lateral lobe was analyzed per mouse and all inflammatory foci were counted within each lobe. c Average number of inflammatory foci per mouse corrected to tissue size evaluated (mm2) in vaccinated, unvaccinated, and unvaccinated mock-challenged mice. d, e Average number of inflammatory foci (d) and size of foci (μm2) (e) in female (F), male (M), and orchiectomized male (M ORX) mice that were vaccinated (+) and challenged with spz. f The average number of CD8+ cells within foci per each vaccinated, unvaccinated, and unvaccinated mock-challenged mouse. g, h. Within vaccinated and challenged F, M, and M ORX mice, the number of CD8+ cells in each foci and the density of CD8+ cells scaled to size of respective foci (CD8+ cells per foci size (mm2)). i Gene expression of Cxcl9, Cxcl10, Ifng in vaccinated and challenged female, male, and ORX male mice calculated as log2 fold change relative to pooled mock-challenged mice. Data are shown from 2 independent experiments (n = 5-8/group), except for the male P&T + Py-WT ORX group that was included in one experiment (n = 5 mice). Average values were calculated per mouse (c, d, f). Statistical significance for data was determined with Kruskal-Wallis test with Dunn’s multiple comparison. Error bars represent mean ± s.e.m; box plot depicts median, interquartile range, and whiskers extending to maximum and minimum values within 1.5x of the interquartile range; ***p < 0.001, **p < 0.01, *p < 0.05, ns p > 0.05. Source data are provided as a Source Data file.

References

    1. World Malaria Report 2024. (World Health Organization, Geneva, 2024).
    1. Sinnis, P. & Zavala, F. The skin: where malaria infection and the host immune response begin. Semin Immunopathol.34, 787–792 (2012). - PMC - PubMed
    1. Cowman, A. F., Healer, J., Marapana, D. & Marsh, K. Malaria: biology and disease. Cell167, 610–624 (2016). - PubMed
    1. Schmidt, N. W., Butler, N. S., Badovinac, V. P. & Harty, J. T. Extreme CD8 T cell requirements for anti-malarial liver-stage immunity following immunization with radiation attenuated sporozoites. PLoS Pathog.6, e1000998 (2010). - PMC - PubMed
    1. Scheller, L. F. & Azad, A. F. Maintenance of protective immunity against malaria by persistent hepatic parasites derived from irradiated sporozoites. Proc. Natl Acad. Sci. USA92, 4066–4068 (1995). - PMC - PubMed

MeSH terms

LinkOut - more resources