. 2025 Jun 4;15(1):19601.
doi: 10.1038/s41598-025-02130-8.

Effect of dolutegravir-based antiretroviral therapy on glycemic control in female mice

Affiliations

Effect of dolutegravir-based antiretroviral therapy on glycemic control in female mice

Valeriya Dontsova et al. Sci Rep. .

Abstract

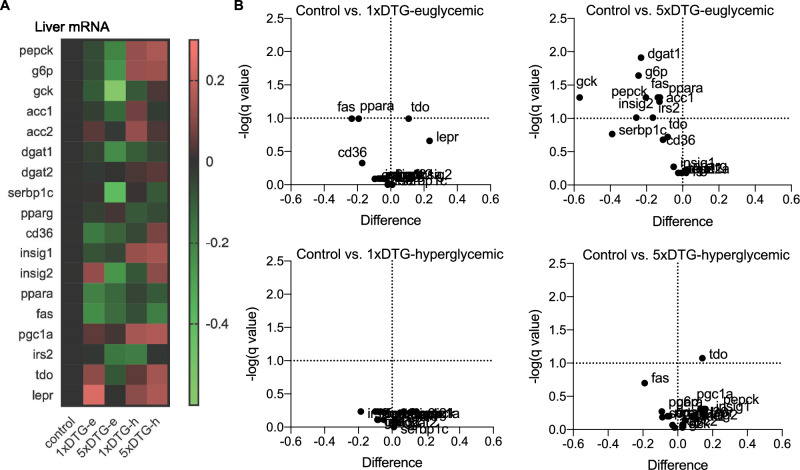
Dolutegravir (DTG), is recommended for all people with HIV, including pregnant women. Weight gain and hyperglycemia have been reported with DTG use, as well as a signal for neural tube defects (NTDs) that has waned over time. Obesity and hyperglycemia are risk factors for NTDs. We explored the impact of DTG-based antiretroviral therapy (ART) on weight gain and glucose homeostasis in female mice. C57BL/6 mice were treated daily for 9 weeks with water (control), 1xDTG (2.5 mg/kg DTG + 33.3/50 mg/kg emtricitabine/tenofovir-yielding therapeutic levels), or 5xDTG (12.5 mg/kg + 33.3/50 mg/kg emtricitabine/tenofovir). Overnight fasted glucose, weight, and oral glucose tolerance test (OGTT) were measured at 2-8 weeks. Tissue was collected for expression analyses of glucose homeostasis pathways. Weight gain was similar between groups. We observed a transient fasted hyperglycemia with DTG treatment, that peaked at week 6 and resolved by week 9. No significant differences were observed in insulin or OGTT response between groups. DTG was associated with a gradual and persistent decrease in plasma leptin and increase in plasma corticosterone levels compared to controls. Downregulation of genes involved in gluconeogenesis and lipogenesis in liver were observed in DTG-treated mice that remained euglycemic. Muscle and liver leptin receptor expression was elevated with DTG treatment. DTG was associated with transient hyperglycemia, lower leptin and higher corticosterone. Induction of compensatory mechanisms may have aided to restore/maintain euglycemia. This transient nature of the glycemic dysregulation may in part explain the loss of the NTD signal that was observed at the initial roll out of DTG but waned over time.

Keywords: Cortisol; Hyperglycemia; INSTI; Leptin; Lipogenesis; Neural tube defects.


Conflict of interest statement

Declarations. Competing interests: The authors declare no competing interests.

Figures

Fig. 1
Fig. 1
DTG-based ART does not affect body weight, food intake, or 4-6 h fasted glucose, but causes a transient increase in overnight fasted glucose. Female C57BL/6J mice were treated with either control (grey circles), 1xDTG (red squares), or 5xDTG (blue triangles) for 9 weeks and their body weight (A), food intake (B), and 4-6 h fasted blood glucose (C) were measured weekly. Overnight (13-15 h) fasted glucose was measured every 2 weeks (E), and at time of sacrifice at week 9 (F). For (A-D) data are shown as means with SEM. Statistical analyses with 2-way ANOVA with Tukey’s post-test. For (EF), data presented as dot plots with median shown. The dotted line represents the mean + 2SD of glucose for the control group (a value of 10.4 mmol/L). Mice with glucose over 10.4 mmol/L were deemed to be hyperglycemic. Statistical analyses by Kruskal–Wallis test with Dunn’s post-test. * p < 0.05. N = 15 for control, N = 13 for 1xDTG, and N = 15 for 5xDTG.
Fig. 2
Fig. 2
DTG treatment does not affect glucose tolerance. Female C57BL/6J mice treated with either control (grey circles), 1xDTG (red squares), or 5xDTG (blue triangles) were fasted overnight (13-15 h) and then administered an oral glucose tolerance test (OGTT; 0.5 g/kg) on weeks 2, 4, 6, and 8 following treatment initiation. Blood glucose response over 120 min is shown in (A). The baseline adjusted area under the curve (AUC) for each treatment arm over time is shown in (B). Data are shown as mean with SEM. N = 15 for control, N = 13 for 1xDTG, and N = 15 for 5xDTG. Statistical comparisons by 2-way ANOVA with Tukey’s post-test. * p < 0.05, ** p < 0.01.
Fig. 3
Fig. 3
Lower leptin and higher corticosterone levels with DTG treatment. Female C57BL/6J mice treated with either control (grey circles), 1xDTG (red squares), or 5xDTG (blue triangles) for a period of 9 weeks and leptin and corticosterone were assessed in overnight fasted plasma. (A) Difference in mean in fasted plasma leptin levels from control (dotted line) with 95% confidence interval (CI) for 1xDTG (red) and 5xDTG (blue) treated mice at week 2, 4, 6, and 8 of treatment. (B) Fasted plasma leptin levels at time of sacrifice at week 9 of treatment. (C) Leptin mRNA levels (log transformed) measured in white adipose tissue collected at time of sacrifice at week 9 of treatment. (D) Correlation between plasma leptin collected at sacrifice and white adipose tissue leptin mRNA. (E) Difference in mean in fasted plasma corticosterone levels from control (dotted line) with 95% CI for 1xDTG (red) and 5xDTG (blue) treated mice at week 2, 4, 6, and 8 of treatment. (F) Fasted plasma corticosterone levels at time of sacrifice at week 9 of treatment. (G) Correlation between white adipose tissue leptin mRNA and week 9 plasma corticosterone levels. For (A) and (E) mean difference with 95%CI calculated using generalized linear models. Not crossing the dotted line indicates significant difference from control. For (B), (C), and (F) box plots show median (line), interquartile range (box), and range (whiskers), with individual data points shown. Statistical comparisons for (B), (C), and (F) by ANOVA with Tukey’s post-test. Pearson r with p-value shown for (D) and (G). N = 14 for control, N = 12 for 1xDTG, N = 14 for 5xDTG. * p < 0.05, ** p < 0.01.
Fig. 4
Fig. 4
DTG treatment is associated with increase in leptin receptor mRNA levels in muscle and liver. Leptin receptor mRNA levels (log-transformed) in muscle (A) and liver (C) of mice treated with either control (grey), 1xDTG (red), or 5xDTG (blue) following 9 weeks of treatment. Box plots show median (line), interquartile range (box), and range (whiskers), with individual data points shown. Statistical comparison by ANOVA with Tukey’s post-test. Correlations between muscle (B) and liver (D) leptin receptor mRNA levels and plasma leptin at week 9, assessed using Pearson r. N = 14 for control, N = 12 for 1xDTG, N = 15 for 5xDTG. ** p < 0.01, *** p < 0.001.
Fig. 5
Fig. 5
Hepatic and muscle gene expression in control, 1xDTG, and 5xDTG mice. Quantification of mRNA expression levels in liver (AD) and muscle (EG) tissue collected at time of sacrifice at 9 weeks of treatment in overnight fasted animals. (A) Fatty acid synthase (Fas), (B) diacylglycerol O-acyltransferase 1 (Dgat1), (C) acetyl-CoA carboxylase (Acc1), (D) insulin receptor substrate 2 (Irs2), (E) Cd36, (F) Irs1, (G) peroxisome proliferator-activated receptor gamma (Ppparγ). Data are log-transformed arbitrary units (AU) and are shown as box plots with the line indicating median, the box interquartile range, and the whiskers range, with individual data points shown. Statistical analyses using ANOVA with Tukey’s post-test. N = 14–15 for control, N = 12–13 for 1xDTG, N = 15 for 5xDTG. * p < 0.05, ** p < 0.01.
Fig. 6
Fig. 6
Downregulation of gluconeogenic and lipogenic genes in the liver of DTG-treated mice that maintained euglycemia. (A) Heat map showing means of log-transformed mRNA expression levels in the liver stratified by treatment arm (control, 1xDTG, 5xDTG) and glycemia state (euglycemic (e) or hyperglycemic (h)). All control mice remained euglycemic. (B) Volcano plots showing mean difference for each group compared to control on the x-axis, and -log(q-value) on the y-axis for all genes. A positive mean difference indicates upregulation compared to control, a negative mean difference indicates downregulation compared to control. Anything above the horizontal dotted lines indicates significant difference. Statistical comparisons using false discovery rate of 10%. N = 6 for 1xDTG-euglycemic, N = 10 for 5xDTG-euglycemic, N = 6 for 1xDTG-hyperglycemic, N = 5 for 5xDTG-hyperglycemic.
Fig. 7
Fig. 7
Gene expression profiles in muscle stratified by treatment and glycemia status. (A) Heat map showing means of log-transformed mRNA expression levels in the muscle stratified by treatment arm (control, 1xDTG, 5xDTG) and glycemia state (euglycemic (e) or hyperglycemic (h)). All control mice remained euglycemic. (B) Volcano plots showing mean difference for each group compared to control on the x-axis, and -log(q-value) on the y-axis for all genes. A positive mean difference indicates upregulation compared to control, a negative mean difference indicates downregulation compared to control. Anything above the horizontal dotted lines indicates significant difference. Statistical comparisons using false discovery rate of 10%. N = 6 for 1xDTG-euglycemic, N = 10 for 5xDTG-euglycemic, N = 6 for 1xDTG-hyperglycemic, N = 5 for 5xDTG-hyperglycemic.

Similar articles

References

    1. Pandey, A. & Galvani, A. P. The global burden of HIV and prospects for control. Lancet HIV.6, e809–e811 (2019). - PubMed
    1. Gandhi, R. T. et al. Antiretroviral drugs for treatment and prevention of hiv infection in adults: 2022 recommendations of the international antiviral society-USA panel. JAMA329, 63–84 (2023). - PubMed
    1. Consolidated guidelines on HIV prevention. testing, treatment, service delivery and monitoring: recommendations for a public health approach (World Health Organization, 2021). - PubMed
    1. Zash, R., Makhema, J. & Shapiro, R. L. Neural-tube defects with dolutegravir treatment from the time of conception. N Engl. J. Med.379, 979–981 (2018). - PMC - PubMed
    1. Zash, R. et al. Neural-tube defects and antiretroviral treatment regimens in Botswana. N Engl. J. Med.381, 827–840 (2019). - PMC - PubMed

LinkOut - more resources