. 2025 Jul;44(14):4150-4180.
doi: 10.1038/s44318-025-00474-5. Epub 2025 Jun 4.

The RNA m6A landscape during human oocyte-to-embryo transition

Affiliations

The RNA m6A landscape during human oocyte-to-embryo transition

Yanjiao Li et al. EMBO J. 2025 Jul.

Abstract

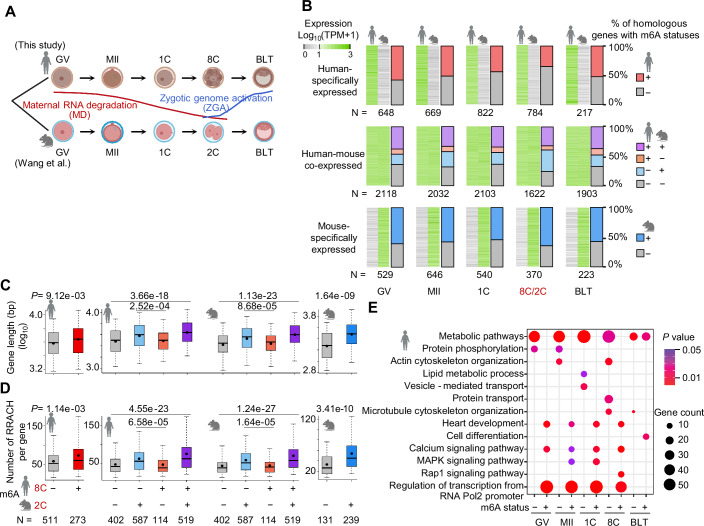
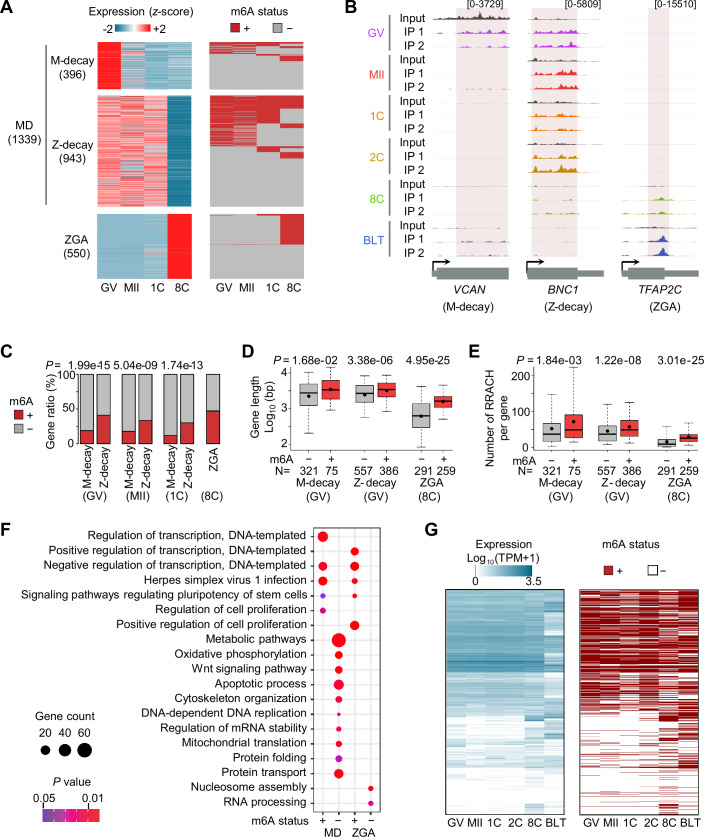
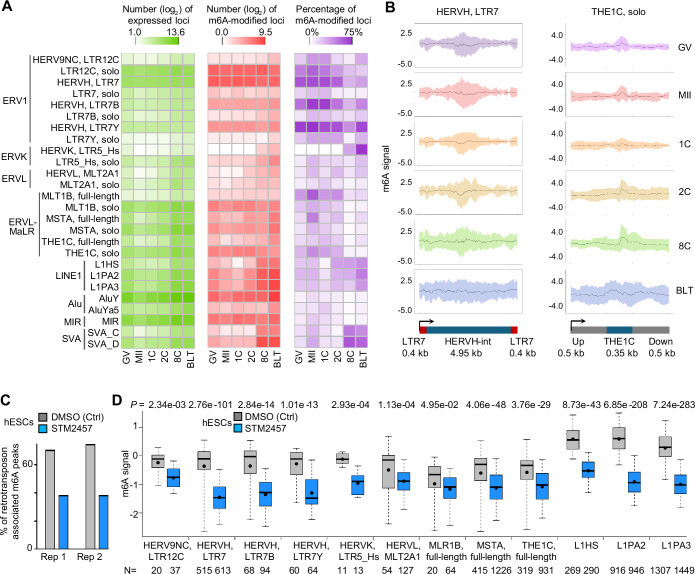
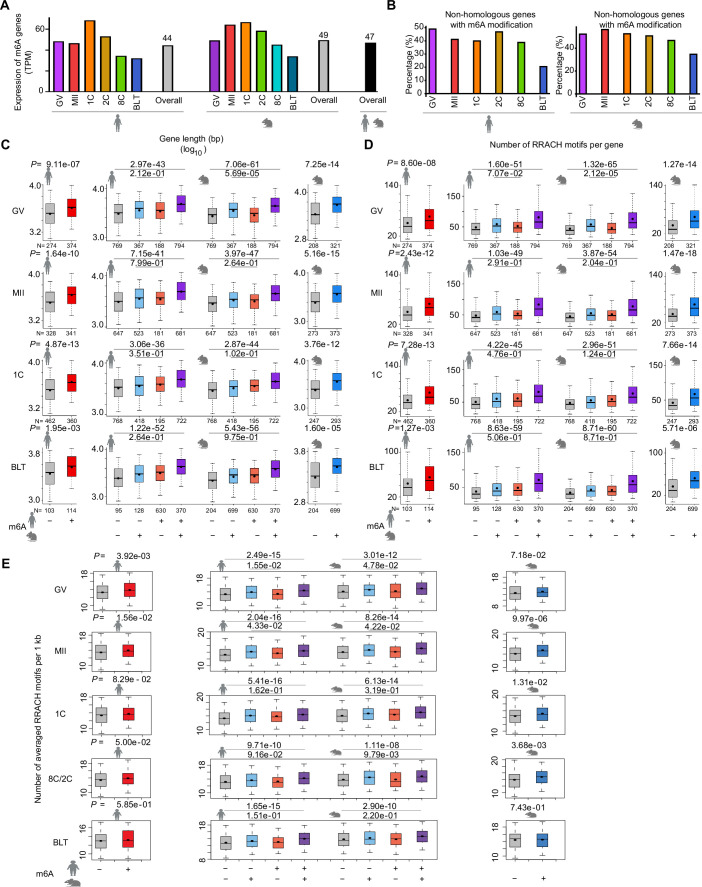
RNA N6-methyladenosine (m6A, m6A) modification is a critical regulator for a range of physiological processes. However, the dynamic m6A profiles within human preimplantation embryos remain uncharacterized. Here, we present the first RNA m6A landscape of single human oocytes and early embryos. Comparative analyses with mouse data reveal an intriguing divergence during the window of zygotic genome activation. m6A-modified genes are involved in regulation of gene transcription, while unmodified genes are mainly associated with basic metabolic processes. Maternal decay mRNAs exhibit a propensity for m6A modifications, and these genes are targeted by miRNAs. m6A modified genes that are constantly expressed across all stages demonstrate higher translation efficiency. Moreover, we observe frequent m6A enrichment on stage-specifically expressed retrotransposons, particularly within young subfamilies. m6A inhibitor leads to m6A erasure on massive retrotransposons. In summary, this study provides a resource to broaden our understanding about the regulatory roles of m6A during early human embryo development.

Keywords: Human Early Embryos; Retrotransposons; Zygotic Genome Activation; m6A.


Conflict of interest statement

Disclosure and competing interests statement. The authors declare no competing interests.

Figures

Figure 1
Figure 1. Dynamic RNA m6A landscape in human oocytes and preimplantation embryos.
(A) Hierarchical clustering analysis of transcriptome-wide m6A profiles. (B) Number of m6A+ genes. (C) Representative genome browser view of picoMeRIP-seq signals. (D) Bubble plot representing the relative enrichment ratios in different genomic features. For each feature, the enrichment score was calculated as the log2 ratio of the observed peak numbers to the expected peak numbers. (E) Metagene profiles of m6A peak distribution. (F) Consensus motifs on m6A peaks identified in biological replicate 1.
Figure 2
Figure 2. Conservation and divergence of m6A methylation during human and mouse OET.
(A) Schematic of human and mouse oocytes and embryos used for stage comparison. Human ZGA mainly occurs at the 8C stage, while mouse ZGA occurs at the 2C stage. (B) Heatmaps showing the expression levels (left) of three categories of homologous genes in humans and mice for each developmental stage; and the ratios of genes with different m6A statuses (right). (C, D) Comparison of gene lengths (C) and RRACH counts (D) between m6A modified and unmodified homologous genes at the human 8C and mouse 2C stages. The P values were calculated by the two-sided Wilcoxon rank-sum test. The boxplots are generated with five percentile-based whiskers, arranged from top to bottom as follows: the 95th percentile, the 75th percentile, the median, the 25th percentile, and the 5th percentile; and the mean value indicated by a dot. N number of genes used in the data analysis. (E) GO analysis for m6A modified and unmodified human-specifically expressed genes. Fisher’s exact test was used to calculate the one-sided P values.
Figure 3
Figure 3. Enrichment of m6A in MD and ZGA genes, as well as in transcription factor coding genes.
(A) Expression (left) and m6A modification (right) dynamics of M-decay, Z-decay and ZGA genes. (B) Genome browser views showing the m6A profiles of representative M-decay, Z-decay and ZGA genes. (C) Percentage of m6A+ genes for each event at each specified stage. The P values are calculated by the one-sided Fisher’s exact test. (D, E) Comparison of gene lengths (D) and RRACH counts (E) between m6A modified and unmodified genes for M-decay, Z-decay and ZGA genes. The P values were calculated by the two-sided Wilcoxon rank-sum test. The boxplots were generated with five percentile-based whiskers, arranged from top to bottom as follows: the 95th percentile, the 75th percentile, the median, the 25th percentile, and the 5th percentile; and the mean value indicated by a dot. N number of genes used in the data analysis. (F) GO analysis for m6A modified and unmodified genes for MD and ZGA genes. Fisher’s exact test was used to calculate the one-sided P values. (G) Expression (left) and m6A status (right) dynamics of transcription factor coding genes.
Figure 4
Figure 4. Association of m6A modification with miRNA targeting and translation efficiency.
(A) Comparison of the proportion of mRNA genes targeted by miRNAs between m6A modified and unmodified genes for M-decay, Z-decay and ZGA genes. The P values are calculated by the one-sided Fisher’s exact test. (B) Comparison of the count of miRNAs targeting m6A modified versus unmodified genes for constantly expressed mRNA genes. The P values are calculated by the two-sided Wilcoxon rank-sum test. N number of genes used in the data analysis. (C, D) Comparison of translation efficiency between m6A modified and unmodified genes for M-decay, Z-decay and ZGA mRNA genes (C), as well as for constantly expressed mRNA genes (D). The P values were calculated by the two-sided Wilcoxon rank-sum test. N number of genes used in the data analysis. (E) Comparison of translation efficiency in constantly expressed mRNA genes with m6A across different genic regions. N number of genes used in the data analysis. The boxplots in (BE) were generated with five percentile-based whiskers, arranged from top to bottom as follows: the 95th percentile, the 75th percentile, the median, the 25th percentile, and the 5th percentile; and the mean value indicated by a dot.
Figure 5
Figure 5. m6A deposition on human retrotransposon-derived RNAs.
(A) Heatmaps showing the number of expressed loci (left), the number of those with m6A among the expressed loci (middle), and the percentage of loci with m6A (right) for the representative retrotransposon subfamilies. These results are based on uniquely aligned reads. (B) Distribution of m6A signals along the full-length HERVH and solo THE1C sequences (based on uniquely aligned reads from biological replicate 1). The mean (represented by the central black line) and standard deviation (represented by the band around the black line) across all loci were plotted. (C) Comparison of the number of retrotransposon-associated m6A peaks between DMSO control (Ctrl) and STM2457 treatment groups in human ESCs. (D) Comparison of the m6A signal on representative retrotransposon subfamilies between DMSO and STM2457 groups in hESCs (based on uniquely aligned reads from biological replicate 1). The P values were calculated by the two-sided Wilcoxon rank-sum test. The boxplots were generated with five percentile-based whiskers, arranged from top to bottom as follows: the 95th percentile, the 75th percentile, the median, the 25th percentile, and the 5th percentile; and the mean value indicated by a dot. N number of repeat loci used in the data analysis.
Figure 6
Figure 6
Summary of the RNA m6A methylome landscape during mammalian OET.
Figure EV1
Figure EV1. Performance evaluation of picoMeRIP-seq in human samples using hESCs and m6A profiling in human oocytes and preimplantation embryos; along with the RNA expression levels of m6A-related regulatory factors.
(A) Illustration of picoMeRIP-seq procedure performed on human oocytes and early embryos. The figure was created in BioRender. (B) Genome browser snapshots of two genes with m6A enrichment in hESCs. (C) Transcriptome-wide correlation analyses of picoMeRIP-seq experiments (IP samples) among samples from 1000, 100 and 10 cells in hESCs. (D) Heatmap showing the fraction of m6A-modified genes (identified in samples of 10 cells) over those identified in samples of 1000 and 100 cells, as well as over those from a previous study in hESCs (Batista et al, 2014). (E) Metagene profiles showing the enrichment of m6A peaks along protein-coding genes in hESCs. (F) Consensus motifs identified within m6A peaks in hESCs. (G) Principal component analysis (PCA) of transcriptome-wide m6A signals. Multiple biological replicates for each stage were generated. (H) Number of m6A peaks. For each stage, the averaged (mean) number across biological replicates 1 and 2 are shown. (I) Fraction of m6A+ genes under different expression cutoffs. (J) Boxplot showing mRNA levels of m6A associated proteins in human oocytes and early embryos. The data were downloaded from a previously published database EmAtlas (Zheng et al, 2023). The boxplots are arranged from top to bottom as follows: the maximal value, the 75th percentile, the median, the 25th percentile, and the minimal value. TB trophoblast.
Figure EV2
Figure EV2. The distribution of m6A peaks across different developmental stages; along with the protein expression levels of m6A-related regulatory factors.
(A) Bar charts showing protein levels of m6A associated proteins in human oocytes and early embryos. The data were downloaded from a previously published database (Zhu et al, 2025). The mean values were shown as the bar. (B) Number of m6A+ genes for different types of genes. (C) Fraction of m6A+ genes among different types of RNAs. (D) Top, pie charts show genomic annotation of m6A peaks. Bottom, bar plots show the peak enrichment score, which was calculated as the log2 ratio of the observed over expected peak numbers. (E) Consensus motifs identified within m6A peaks from biological replicate 2.
Figure EV3
Figure EV3. Comparison of gene length and RRACH motif between m6A modified and unmodified genes in human and mouse.
(A) Statistics of expression level of m6A+ genes in human and mouse data. TPM, transcripts per million. (B) The ratios of non-homologous genes (TPM ≥ 50) with m6A modification in human and mouse. (C, D) Comparison of gene lengths (C) and RRACH counts (D) between m6A modified and unmodified genes for human- (left) and mouse- (right) specifically expressed genes, as well as human-mouse co-expressed genes (middle). The P values were calculated by the two-sided Wilcoxon rank-sum test. N number of genes used in the data analysis. (E) The average RRACH motif density after normalized per 1 kb length between m6A modified and unmodified genes for human- (left) and mouse- (right) specifically expressed genes, as well as human-mouse co-expressed genes (middle). The P values were calculated by the two-sided Wilcoxon rank-sum test. N number of genes used in the data analysis. The boxplots in (CE) were generated with five percentile-based whiskers, arranged from top to bottom as follows: the 95th percentile, the 75th percentile, the median, the 25th percentile, and the 5th percentile; and the mean value indicated by a dot.
Figure EV4
Figure EV4. GO analysis of m6A modified and unmodified genes for mouse-specifically expressed genes and human-mouse co-expressed genes.
(AC) GO analysis for m6A + /− genes for mouse specifically expressed genes (A), for human genes that were co-expressed in mouse (B), and for mouse genes that were co-expressed in human (C). Fisher’s exact test was used to calculate the one-sided P values.
Figure EV5
Figure EV5. Comparison of m6A-modified and unmodified genes in terms of M-decay, Z-decay, and ZGA categories; along with the expression levels and m6A modification status of transcription factors and cofactors.
(AC) Comparison of expression levels (A), gene lengths (B), and RRACH counts (C) between m6A modified and unmodified genes for M-decay, Z-decay and ZGA genes. The P values were calculated by the two-sided Wilcoxon rank-sum test. The boxplots were generated with five percentile-based whiskers, arranged from top to bottom as follows: the 95th percentile, the 75th percentile, the median, the 25th percentile, and the 5th percentile; and the mean value indicated by a dot. N number of genes used in the data analysis. (D) Expression (left) and m6A status (right) dynamics of transcription cofactor coding genes. (E) Proportion of m6A+ transcription factors (left) and transcription cofactors (right) coding genes at each stage with different expression thresholds. (F) Expression and m6A marking status of genes essential for the lineage specification events in human early embryos. Top: gene expression, down: m6A status.
Figure EV6
Figure EV6. Comparison of miRNA targeting and translation efficiency between m6A modified and unmodified genes for M-decay, Z-decay and ZGA genes, as well as for constantly expressed genes; along with the analysis of m6A enrichment on retrotransposon-derived RNAs.
(A) Comparison of the count of miRNAs targeting m6A modified versus unmodified mRNA genes for M-decay, Z-decay and ZGA genes. The P values were calculated by the two-sided Wilcoxon rank-sum test. N number of genes used in the data analysis. (B) Comparison of the normalized count of miRNAs targeting m6A modified versus unmodified mRNA genes for M-decay, Z-decay and ZGA genes. See “Methods” for the calculation of normalized mRNA counts. The P values were calculated by the two-sided Wilcoxon rank-sum test. N number of genes used in the data analysis. (C) Comparison of the proportion of mRNA genes targeted by miRNAs between m6A modified and unmodified genes for constantly expressed genes. The P values were calculated by the one-sided Fisher’s exact test. (D) Comparison of the normalized count of miRNAs targeting m6A modified versus unmodified mRNA genes for constantly expressed genes. See “Methods” for the calculation of normalized mRNA counts. The P values were calculated by the two-sided Wilcoxon rank-sum test. N number of genes used in the data analysis. (E) Distribution of m6A signals along the full-length sequences of the representative retrotransposon subfamilies, based on unique assignment strategy. The mean (represented by the central black line) and standard deviation (represented by the band around the black line) across all loci were plotted. These plots are based on uniquely aligned reads. (F) Distribution of m6A signals along the full-length sequences of the representative retrotransposon subfamilies, based on a random assignment strategy. The mean (represented by the central black line) and standard deviation (represented by the band around the black line) across all loci were plotted. These plots are based on a random assignment strategy for those multiply aligned reads. (G) Heatmaps showing the number of expressed loci (left), the number of those with m6A among the expressed loci (middle), and the percentage of loci with m6A (right) for the representative retrotransposon subfamilies. These results are based on a random assignment strategy for those multiply aligned reads. (H) Comparison of the number of processed sequencing reads between control (DMSO) and treatment (STM2457) groups in human ESCs. (I) Comparison of the number of m6A peaks between control (DMSO) and treatment (STM2457) groups in human ESCs. The boxplots in (A, B, D) were generated with five percentile-based whiskers, arranged from top to bottom as follows: the 95th percentile, the 75th percentile, the median, the 25th percentile, and the 5th percentile; and the mean value indicated by a dot.
Figure EV7
Figure EV7. Analysis of m6A profile changes after STM2457 treatment in hESC.
(A) Comparison of the m6A signal on representative retrotransposon subfamilies between DMSO and STM2457 groups in hESCs (based on uniquely aligned reads from biological replicate 2). The P values were calculated by the two-sided Wilcoxon rank-sum test. N number of repeat loci used in the data analysis. (B, C) Comparison of the m6A signal on representative retrotransposon subfamilies between DMSO and STM2457 groups in hESCs (based on a random assignment strategy for those multiply aligned reads; see “Methods”). The (B) is biological replicate 1; and (C) is biological replicate 2. The P values were calculated by the two-sided Wilcoxon rank-sum test. N number of repeat loci used in the data analysis. (DF) The expression level and fold change (left), m6A status (middle) and percentage (right) of transcription factor (D), transcription cofactors (E) and metabolic pathways (F) mRNAs. The boxplots in (AC) were generated with five percentile-based whiskers, arranged from top to bottom as follows: the 95th percentile, the 75th percentile, the median, the 25th percentile, and the 5th percentile; and the mean value indicated by a dot.

References

    1. Agarwal V, Bell GW, Nam JW, Bartel DP (2015) Predicting effective microRNA target sites in mammalian mRNAs. eLife 4:e05005 - PMC - PubMed
    1. Alberio R (2020) Regulation of cell fate decisions in early mammalian embryos. Annu Rev Anim Biosci 8:377–393 - PubMed
    1. Batista PJ, Molinie B, Wang J, Qu K, Zhang J, Li L, Bouley DM, Lujan E, Haddad B, Daneshvar K et al (2014) m(6)A RNA modification controls cell fate transition in mammalian embryonic stem cells. Cell Stem Cell 15:707–719 - PMC - PubMed
    1. Blakeley P, Fogarty NM, del Valle I, Wamaitha SE, Hu TX, Elder K, Snell P, Christie L, Robson P, Niakan KK (2015) Defining the three cell lineages of the human blastocyst by single-cell RNA-seq. Development 142:3151–3165 - PMC - PubMed
    1. Chelmicki T, Roger E, Teissandier A, Dura M, Bonneville L, Rucli S, Dossin F, Fouassier C, Lameiras S, Bourc’his D (2021) m(6)A RNA methylation regulates the fate of endogenous retroviruses. Nature 591:312–316 - PubMed

LinkOut - more resources