. 2025 Aug;44(32):2893-2906.
doi: 10.1038/s41388-025-03460-7. Epub 2025 Jun 4.

SFXN1 promotes bladder cancer metastasis by restraining PINK1-dependent mitophagy

Affiliations

SFXN1 promotes bladder cancer metastasis by restraining PINK1-dependent mitophagy

Baochao Zhang et al. Oncogene. 2025 Aug.

Abstract

Sideroflexin 1 (SFXN1), a newly identified mitochondrial serine transporter, exhibits great potential to modulate mitochondrial function and promote tumor development. However, its role in bladder cancer (BLCA) remains unclear. Our study revealed that SFXN1 was enriched in clinical BLCA tissues, and high SFXN1 expression in BLCA was positively associated with the progression and poor prognosis. Further, SFXN1 deficiency remarkably suppressed the proliferation and metastasis of BLCA cells in vitro and in vivo, indicating an oncogenic role of SFXN1 in BLCA. Additionally, our results demonstrated that SFXN1 promotes metastasis through its unknown function of restraining PINK1 (PTEN-induced kinase 1)-dependent mitophagy rather than its classical role as a mitochondrial serine transporter to mediate one-carbon metabolism. Mechanistically, SFXN1 acted as a bridge to promote PINK1 degradation by interacting with PARL (presenilin-associated rhomboid-like protein) and MPP-β (mitochondrial processing peptidase-β), leading to mitophagy arrest. Notably, when mitophagy was restrained by highly-expressed SFXN1, mitochondrial reactive oxygen species were considerably enriched, thus activating TGF-β (transforming growth factor-β)-mediated epithelial-mesenchymal transition and promoting metastasis of BLCA cells. This study highlights SFXN1 as a novel promising therapeutic target for BLCA and identifies a new mitophagic modulator to improve our understanding of an association between mitophagy and BLCA progression. Schematic diagram of the proposed mechanism by which SFXN1 promotes bladder cancer metastasis by restraining PINK1-dependent mitophagy. SFXN1 is upregulated in BLCA tissues, and promotes BLCA metastasis through its unrevealed function of restraining PINK1-dependent mitophagy rather than its classical role as a mitochondrial serine transporter to promote cell proliferation. Specifically, SFXN1 acted as an essential bridging factor to promote PINK1 degradation by interacting with PARL and MPP-β on the IMM, leading to mitophagy arrest and mtROS accumulation, thus activated TGF-β-mediated EMT and promoted BLCA metastasis (This figure was created by Figdraw).


Conflict of interest statement

Competing interests: The authors declare no competing interests. Ethics approval and consent to participate: All study participants provided informed consent, and the study design was approved by Institutional Ethics Committee of the Nanjing Drum Tower Hospital approved this study (2022-493-01). All authors consent to the publication of the manuscript.

Figures

None
Schematic diagram of the proposed mechanism by which SFXN1 promotes bladder cancer metastasis by restraining PINK1-dependent mitophagy. SFXN1 is upregulated in BLCA tissues, and promotes BLCA metastasis through its unrevealed function of restraining PINK1-dependent mitophagy rather than its classical role as a mitochondrial serine transporter to promote cell proliferation. Specifically, SFXN1 acted as an essential bridging factor to promote PINK1 degradation by interacting with PARL and MPP-β on the IMM, leading to mitophagy arrest and mtROS accumulation, thus activated TGF-β-mediated EMT and promoted BLCA metastasis (This figure was created by Figdraw).
Fig. 1
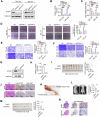
Fig. 1. SFXN1 expression is associated with the progression and outcomes in patients with BLCA.
A Representative images (left) and quantified results (right) of IHC staining of SFXN1 in matched BLCA tissues and adjacent noncancerous tissues (n = 21). The rectangles in the top row indicate the enlarged areas shown at the bottom. Scale bar: 250 μm (top) and 50 (bottom) μm. B WB analysis of SFXN1 levels in matched BLCA tissues and adjacent noncancerous tissues (n = 13). C Representative images (left) and quantified results (right) of IHC staining of SFXN1 in BLCA tissues with different T stages. (T1 stage: n = 39, T2 stage: n = 54, T3 stage: n = 43, T4 stage: n = 12). The rectangles in the top row indicate the enlarged areas shown at the bottom. Scale bar: 250 μm (top) and 50 (bottom) μm. D Representative images (left) and quantified results (right) of IHC staining of SFXN1 in BLCA tissues with different N stages. (N0 stage: n = 116, N1 stage: n = 25, N2 stage: n = 14). The rectangles in the top row indicate the enlarged areas shown at the bottom. Scale bar: 250 μm (top) and 50 (bottom) μm. The overall (E) and progression-free survival (F) curves of BLCA patients with low and high SFXN1 expression are generated using the Kaplan–Meier survival analysis. G The levels of SFXN1 mRNA in BLCA tissues and normal bladder tissues from TCGA database. (Normal: n = 19, Tumor: n = 408). H The overall survival curves of BLCA patients from TCGA database with low and high levels of SFXN1 mRNA are generated using the Kaplan–Meier survival analysis (n = 406). The P value was assessed using paired, two-tailed Student’s t test (A and B), unpaired, two-tailed Student’s t test (C, D and G) and the log-rank test (E, F and H). *P < 0.05, **P < 0.01, ***P < 0.001, ****P < 0.0001.
Fig. 2
Fig. 2. Knocking down SFXN1 inhibits proliferation and metastasis of BLCA cells in vitro and in vivo.
The knock down efficiency of siSFXN1 in BLCA cells were confirmed by WB (A) and qPCR (B) analysis. C Proliferation of BLCA cells transfected with siSFXN1 or siNC analyzed by MTT assays (n = 3). D Representative images (left) and quantified results (right) of wound healing assays in BLCA cells transfected with siSFXN1 or siNC (n = 3). E Representative images (left) and quantified results (right) of transwell assays in BLCA cells transfected with siSFXN1 or siNC (n = 3). F Representative images (left) and quantified results (right) of invasion assays in BLCA cells transfected with siSFXN1 or siNC (n = 3). G, H The knock down efficiency of shSFXN1 lentivirus in T24 cells were confirmed by WB (G) and qPCR (H) analysis. I Representative images (left) and quantified results (right) of enucleated subcutaneous tumors (n  = 8 per group). J Representative images of HE and IHC staining of SFXN1 or Ki-67 in subcutaneous tumors (n  = 5 per group). Scale bar: 250 and 50 μm. K Representative images of the nude mouse model of popliteal LN metastasis. L Representative bioluminescence images (left) and quantified results (right) of popliteal LN metastasis (n = 10 per group). M Representative images (left) and quantified results (right) of enucleated popliteal LNs (n = 10 per group). N Representative images of HE and IHC staining of lusiferase in popliteal LN (n = 10 per group). The rectangles in the left row indicate the enlarged areas shown at the right. Scale bar: 500 μm (left) and 125 μm (right). The P value was assessed using two-tailed Student’s t test. *P < 0.05, **P < 0.01, ***P < 0.001, ****P < 0.0001.
Fig. 3
Fig. 3. SFXN1 promotes the metastasis of BLCA cells independently of its serine transporter function.
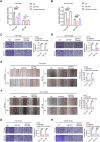
Proliferation of BLCA cells transfected with siSFXN1 or siNC cultured in full (A) and serine-free (B) media supplemented with or without 2 mM formate analyzed by MTT assays (n = 3). Representative images (left) and quantified results (right) of transwell assays in BLCA cells transfected with siSFXN1 or siNC cultured in full (C) and serine-free (D) media supplemented with or without 2 mM formate (n = 3). Representative images (left) and quantified results (right) of wound healing assays in BLCA cells transfected with siSFXN1 or siNC cultured in full (E) and serine-free (F) media supplemented with or without 2 mM formate (n = 3). Representative images (left) and quantified results (right) of invasion assays in BLCA cells transfected with siSFXN1 or siNC cultured in full (G) and serine-free (H) media supplemented with or without 2 mM formate (n = 3). The P value was assessed using two-tailed Student’s t test. *P < 0.05, **P < 0.01, ***P < 0.001, ****P < 0.0001.
Fig. 4
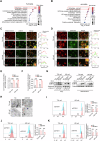
Fig. 4. SFXN1 deficiency promotes mitophagy of BLCA cells.
KEGG pathway enrichment analysis of the differently expressed genes between T24 cells transfected with siSFXN1 or siNC cultured in full media (A) and serine-free media (B). C, D Representative images (left) and the pixel intensity of red (mitochondria) and green (LC3B-II or lysosome) (right) in BLCA cells transfected with siSFXN1 or siNC. Scale bar: 35 and 2 μm. Quantified results of the co-localization mitochondria and LC3B (E) or lysosomal (F) in BLCA cells transfected with siSFXN1 or siNC (n = 3). G WB analysis of LC3B levels in whole-cell lysates (WCL) (left) and mitochondrial fractions (right) of BLCA cells transfected with siSFXN1 or siNC treated with or without chloroquine (CLQ). The numbers below the lanes represent the densitometry analysis of band intensity, relative to the ratio of LC3B-II to LC3B-I. H Representative images of transmission electron microscopy of BLCA cells transfected with siSFXN1 or siNC. Arrows indicate mitochondria (blue), autolysosome (red) and autophagosome (green). Scale bar: 400 nm. I Representative images (left) and quantified results (right) of mitochondrial mass of BLCA cells transfected with siSFXN1 or siNC measured by flow cytometry (n = 3). J Representative images (left) and quantified results (right) of mitochondrial ROS of BLCA cells transfected with siSFXN1 or siNC measured by flow cytometry (n = 3). K Representative images (left) and quantified results (right) of mitochondrial membrane potential of BLCA cells transfected with siSFXN1 or siNC measured by flow cytometry (n = 3). The P value was assessed using two-tailed Student’s t test. *P < 0.05, **P < 0.01, ***P < 0.001, ****P < 0.0001.
Fig. 5
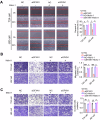
Fig. 5. SFXN1 promotes the metastasis of BLCA cells by inhibiting mitophagy.
A Representative images (left) and quantified results (right) of wound healing assays in BLCA cells transfected with siSFXN1 or siNC treated with or without Mdivi-1 (n = 3). B Representative images (left) and quantified results (right) of transwell assays in BLCA cells transfected with siSFXN1 or siNC treated with or without Mdivi-1 (n = 3). C Representative images (left) and quantified results (right) of invasion assays in BLCA cells transfected with siSFXN1 or siNC treated with or without Mdivi-1 (n = 3). The P value was assessed using two-tailed Student’s t test. *P < 0.05, **P < 0.01, ***P < 0.001, ****P < 0.0001.
Fig. 6
Fig. 6. SFXN1 inhibits PINK1-dependent mitophagy by mediating the degradation of PINK1 via PARL/MPP-β.
A WB analysis of PINK1 levels in whole-cell lysates (WCL) of BLCA cells transfected with siSFXN1 or siNC. B WB analysis of protein levels in the mitochondrial fractions of BLCA cells transfected with siSFXN1 or siNC. C WB analysis of protein levels in the mitochondrial fractions of BLCA cells transfected with siNC, siSFXN1, siPINK1, or siSFXN1+siPINK1. D Representative images of IHC staining of PINK1 and PARKIN in subcutaneous tumors (n  = 5 per group). Scale bar: 250 and 50 μm. WB analysis of PINK1 and SFXN1 levels in the products pulled down by IgG (as a control), anti-SFXN1 (E), or anti-PINK1 (F) antibodies in BLCA cells. G WB analysis of Tim23, Tom40, MPP-β, PARL and SFXN1 levels in the products pulled down by IgG (as a control), and anti-SFXN1 antibodies in BLCA cells. H WB analysis of MPP-β, PARL and SFXN1 levels in the products pulled down by IgG (as a control), or anti-MPP-β (left), or anti-PARL (right) antibodies in BLCA cells. I WB analysis of MPP-β, PARL and PINK1 levels in the products pulled down by IgG (as a control), or anti-PINK1 antibodies in BLCA cells transfected with siSFXN1 or siNC. Right (Input), WB analysis of MPP-β, PARL and PINK1 levels in cells as above, without co-IP. J WB analysis of full-long and cleaved PINK1 levels in the mitochondrial fractions of BLCA cells transfected with siSFXN1 or siNC. The P value was assessed using two-tailed Student’s t test. *P < 0.05, **P < 0.01, ***P < 0.001, ****P < 0.0001.
Fig. 7
Fig. 7. SFXN1 promotes the EMT of BLCA cells by inhibiting PINK1-mediated mitophagy.
A Representative images (left) and quantified results (right) of transwell assays in BLCA cells transfected with siNC, siSFXN1, siPINK1, or siSFXN1 + siPINK1 (n = 3). B Representative images (left) and quantified results (right) of invasion assays in BLCA cells transfected with siNC, siSFXN1, siPINK1, or siSFXN1+siPINK1 (n = 3). C Representative brightfield image of BLCA cells transfected with siSFXN1 or siNC. Scale bar: 100 μm. WB (D) and qPCR (E) analysis of SLUG, E-cadherin and N-cadherin levels of BLCA cells transfected with siSFXN1 or siNC (n = 3). F WB analysis of proteins levels of TGF-β/SMADs pathway of BLCA cells transfected with siSFXN1 or siNC. G WB analysis of proteins levels of TGF-β/SMADs and EMT pathway of BLCA cells transfected with siNC, siSFXN1, siPINK1, or siSFXN1 + siPINK1. H Representative images (left) and quantified results (right) of mitochondrial ROS of BLCA cells transfected with siSFXN1 or siNC treated with or without mitoTEMPO measured by flow cytometry (n = 3). I WB analysis of proteins levels of TGF-β/SMADs and EMT pathway of BLCA cells transfected with siSFXN1 or siNC treated with or without mitoTEMPO. The P value was assessed using two-tailed Student’s t test. *P < 0.05, **P < 0.01, ***P < 0.001, ****P < 0.0001.
Fig. 8
Fig. 8. Schematic diagram of the proposed mechanism by which SFXN1 promotes bladder cancer metastasis by restraining PINK1-dependent mitophagy.
SFXN1 is upregulated in BLCA tissues, and promotes BLCA metastasis through its unrevealed function of restraining PINK1-dependent mitophagy rather than its classical role as a mitochondrial serine transporter to promote cell proliferation. Specifically, SFXN1 acted as an essential bridging factor to promote PINK1 degradation by interacting with PARL and MPP-β on the IMM, leading to mitophagy arrest and mtROS accumulation, thus activated TGF-β-mediated EMT and promoted BLCA metastasis (This figure was created by Figdraw).

Similar articles

References

    1. Antoni S, Ferlay J, Soerjomataram I, Znaor A, Jemal A, Bray F. Bladder cancer incidence and mortality: a global overview and recent trends. Eur Urol. 2017;71:96–108. - PubMed
    1. Jubber I, Ong S, Bukavina L, Black PC, Compérat E, Kamat AM, et al. Epidemiology of bladder cancer in 2023: a systematic review of risk factors. Eur Urol. 2023;84:176–90. - PubMed
    1. Catto JWF, Gordon K, Collinson M, Poad H, Twiddy M, Johnson M, et al. Radical cystectomy against intravesical BCG for high-risk high-grade nonmuscle invasive bladder cancer: results from the randomized controlled BRAVO-feasibility study. J Clin Oncol. 2021;39:202–14. - PMC - PubMed
    1. Minoli M, Cantore T, Hanhart D, Kiener M, Fedrizzi T, La Manna F, et al. Bladder cancer organoids as a functional system to model different disease stages and therapy response. Nat Commun. 2023;14:2214. - PMC - PubMed
    1. Miller KD, Siegel RL, Lin CC, Mariotto AB, Kramer JL, Rowland JH, et al. Cancer treatment and survivorship statistics, 2016. CA Cancer J Clin. 2016;66:271–89. - PubMed

Substances