

Growth and gene expression of Pseudomonas nitroreducens TX1 on octylphenol polyethoxylate surfactants
- PMID: 40468059
- PMCID: PMC12137402
- DOI: 10.1007/s00253-025-13463-9
Growth and gene expression of Pseudomonas nitroreducens TX1 on octylphenol polyethoxylate surfactants
Abstract
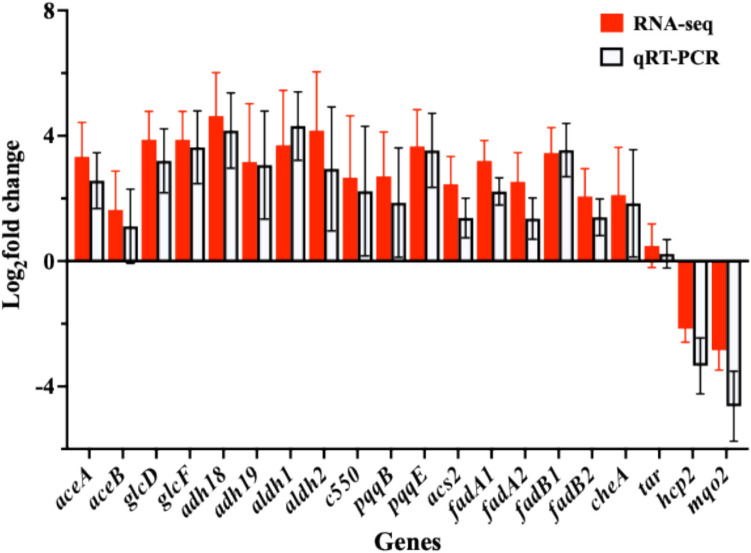
Pseudomonas nitroreducens ATCC PTA-6168 (also named TX1) efficiently grows on non-ionic surfactants as the sole source of carbon and energy aerobically. The global gene expression and bacterial stress responses during degradation remain further investigated. This study compared the growth, viability, and transcriptomic profiles of strain TX1 during the log phase when grown on minimal salts basal medium supplemented with 0.5% octylphenol polyethoxylates (OPEOn, commercial name Triton® X-100) vs. in 0.5% succinate. Differentially expressed genes were identified, with 219 upregulated and 22 downregulated. Gene ontology analysis revealed upregulation of oxidoreductase activity (53%), electrotransfer activity (11%), heme/FAD/cofactor binding (11/19/27%), and membrane (42%)-related functions. In ethanol oxidation, adh18 and adh19 (for two pyrroloquinoline quinone (PQQ)-dependent alcohol dehydrogenases), aldh1 and aldh2 (for two aldehyde dehydrogenases), c550 (for cytochrome c550), and pqqABCDEF (for PQQ biosynthesis proteins) and aceA (for isocitrate lyase) and aceB (for malate synthase) acting in the glyoxylate cycle were upregulated. In addition to the above genes, the expression level of the representative genes from fatty acid degradation and chemotaxis was verified by RT-qPCR. The global gene expression of P. nitroreducens TX1 provides candidate genes involved in the bacteria grown on nonionic surfactants. KEY POINTS: • Growth characteristics of Pseudomonas nitroreducens ATCC PTA-6168 on surfactants • Differentially expressed genes related to growth on surfactants were identified • The ethanol oxidation system was upregulated when grown on surfactants.
Keywords: Pseudomonas nitroreducens; Alcohol dehydrogenase; Differentially expressed genes; Ethanol oxidation system; Octylphenol polyethoxylates; Transcriptomic analysis.
© 2025. The Author(s).
Conflict of interest statement
Declarations. Ethics approval: This article does not contain any studies with human or animal participants. Conflict of interest: The authors declare no competing interests.
Figures


Similar articles
-
Transposon Mutagenesis Identifies Genes Critical for Growth of Pseudomonas nitroreducens TX1 on Octylphenol Polyethoxylates.Appl Environ Microbiol. 2016 Oct 27;82(22):6584-6592. doi: 10.1128/AEM.01907-16. Print 2016 Nov 15. Appl Environ Microbiol. 2016. PMID: 27590807 Free PMC article.
-
Bio-Fenton reaction involved in the cleavage of the ethoxylate chain of nonionic surfactants by dihydrolipoamide dehydrogenase from Pseudomonas nitroreducens TX1.Sci Rep. 2019 May 2;9(1):6827. doi: 10.1038/s41598-019-43266-8. Sci Rep. 2019. PMID: 31048711 Free PMC article.
-
Draft Genome Sequence of Pseudomonas nitroreducens Strain TX1, Which Degrades Nonionic Surfactants and Estrogen-Like Alkylphenols.Genome Announc. 2014 Jan 30;2(1):e01262-13. doi: 10.1128/genomeA.01262-13. Genome Announc. 2014. PMID: 24482523 Free PMC article.
-
The ethanol oxidation system and its regulation in Pseudomonas aeruginosa.Biochim Biophys Acta. 2003 Apr 11;1647(1-2):98-102. doi: 10.1016/s1570-9639(03)00066-9. Biochim Biophys Acta. 2003. PMID: 12686116 Review.
-
[Biodestruction of natural and artificial compounds by bacteria of the genus Pseudomonas].Mikrobiol Zh (1978). 1980 Jan-Feb;42(1):112-20. Mikrobiol Zh (1978). 1980. PMID: 6988680 Review. Russian. No abstract available.
References
-
- Adachi O, Yakushi T (2016) Membrane-bound dehydrogenases of acetic acid bacteria. In: Matsushita K, Toyama H, Tonouchi N, Okamoto-Kainuma A (eds) Acetic acid bacteria: Ecology and physiology. Springer Japan, Tokyo, pp 273–297. 10.1007/978-4-431-55933-7_13
-
- Ahel M, Giger W, Koch M (1994a) Behaviour of alkylphenol polyethoxylate surfactants in the aquatic environment—I. Occurrence and transformation in sewage treatment. Water Res 28(5):1131–1142. 10.1016/0043-1354(94)90200-3
-
- Ahel M, Giger W, Schaffner C (1994b) Behaviour of alkylphenol polyethoxylate surfactants in the aquatic environment—II. Occurrence and transformation in rivers. Water Res 28(5):1143–1152. 10.1016/0043-1354(94)90201-1
-
- Ahel M, Schaffner C, Giger W (1996) Behaviour of alkylphenol polyethoxylate surfactants in the aquatic environment—III. Occurrence and elimination of their persistent metabolites during infiltration of river water to groundwater. Water Res 30(1):37–46. 10.1016/0043-1354(95)00123-3
-
- Ali A, Khan ZH, Sahib MK, Durrani S, Shaligram U, Raju E, Durrani A (2016) Purification of recombinant subunit vaccine by HbsAg cell lysis using various enrichments of chaotropic and non-ionic detergents. Biosci Biotechnol Res Commun 9(2):240–248. 10.21786/bbrc/9.1/10
MeSH terms
Substances
Grants and funding
LinkOut - more resources
Full Text Sources
Miscellaneous
