. 2025 Jul;643(8072):755-767.
doi: 10.1038/s41586-025-09052-5. Epub 2025 Jun 4.

Increased CSF drainage by non-invasive manipulation of cervical lymphatics

Affiliations

Increased CSF drainage by non-invasive manipulation of cervical lymphatics

Hokyung Jin et al. Nature. 2025 Jul.

Abstract

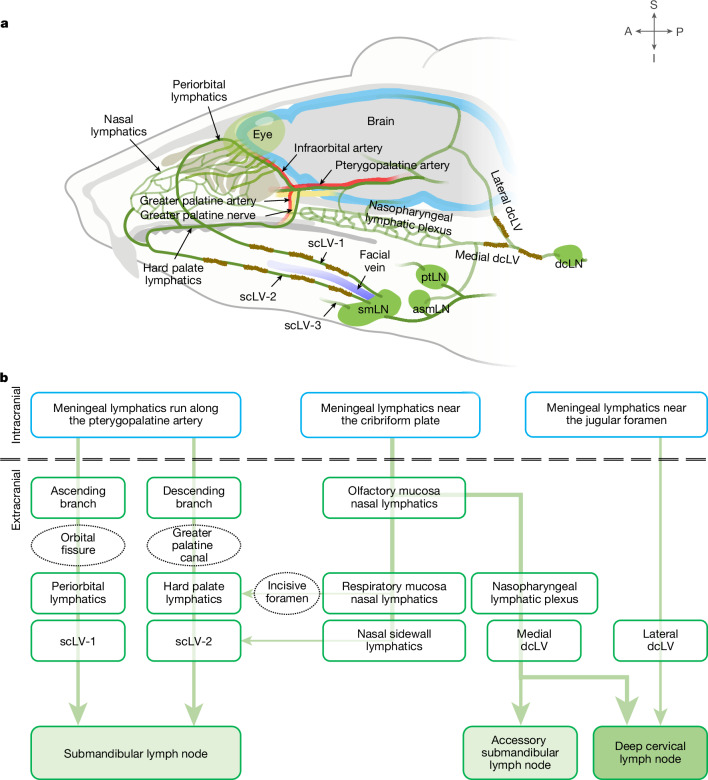
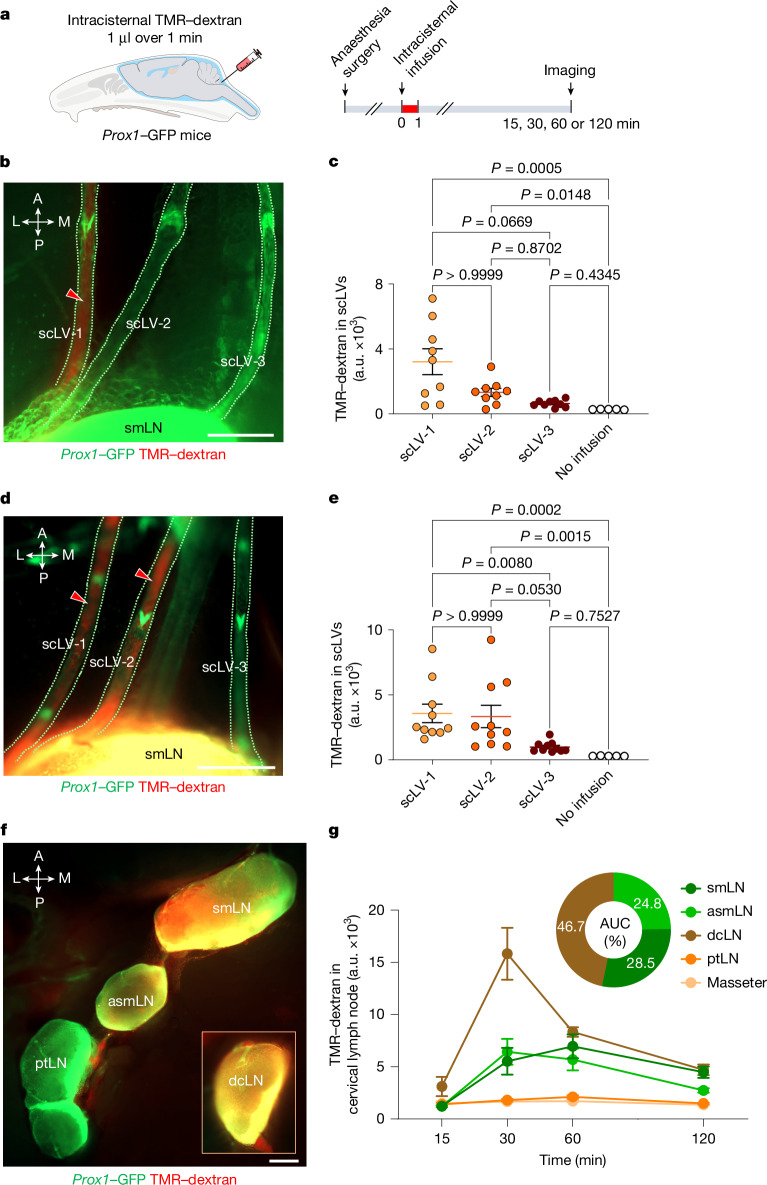
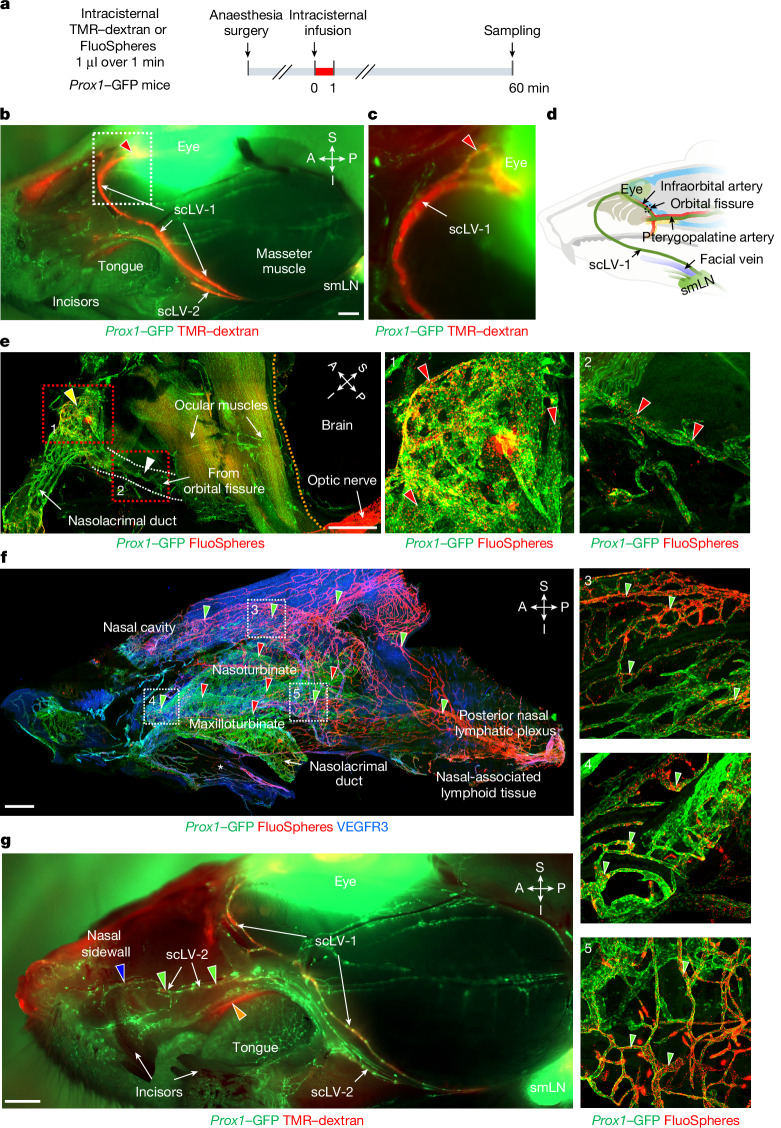
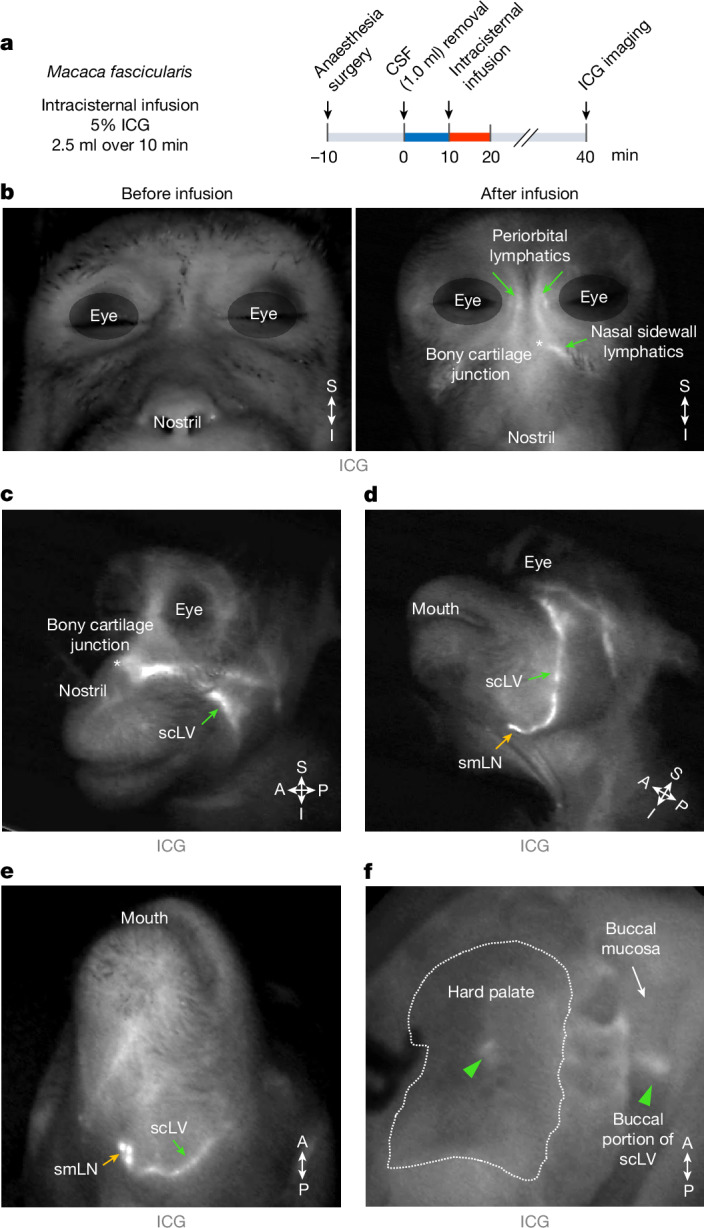
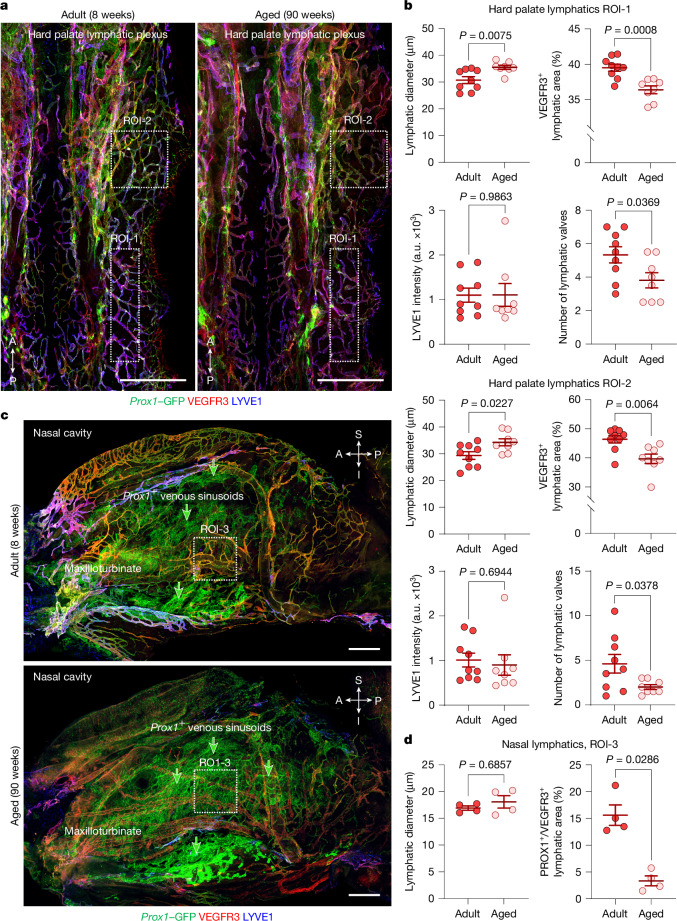
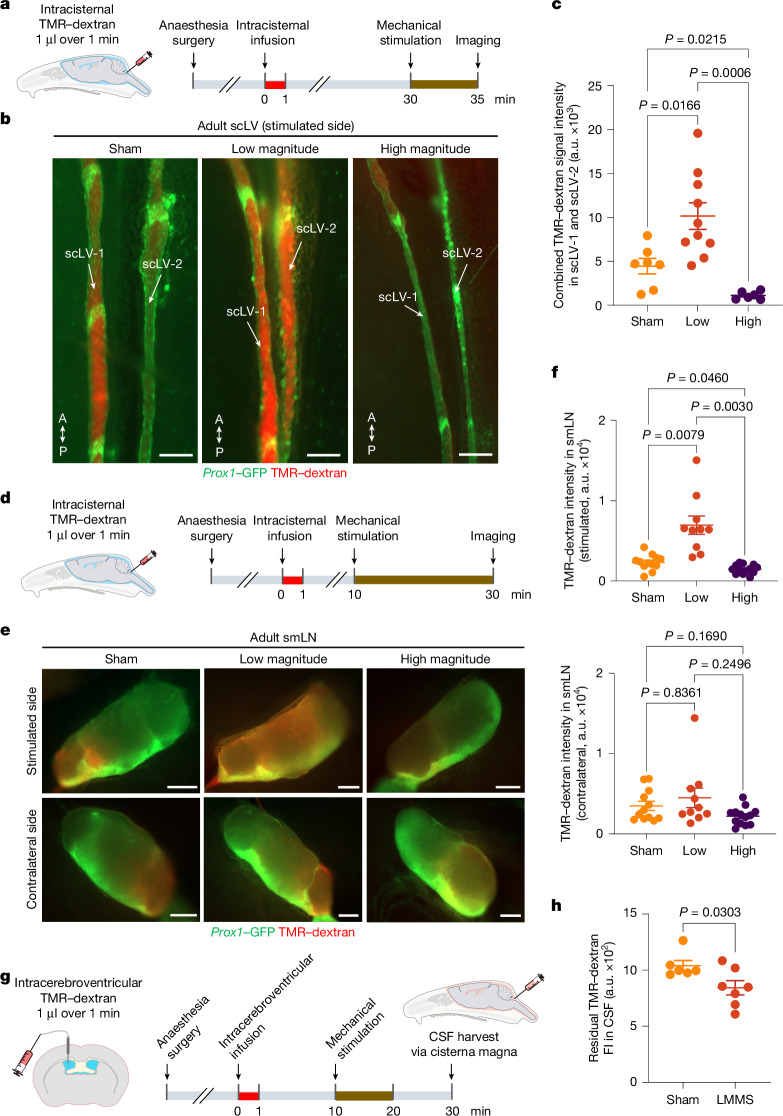
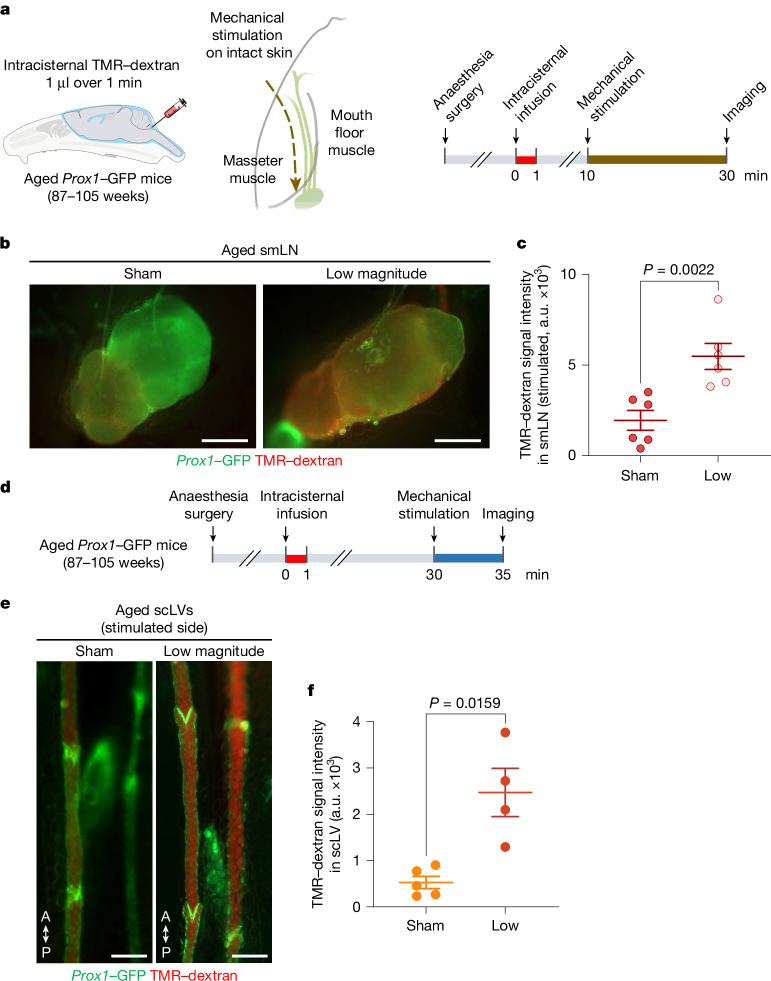
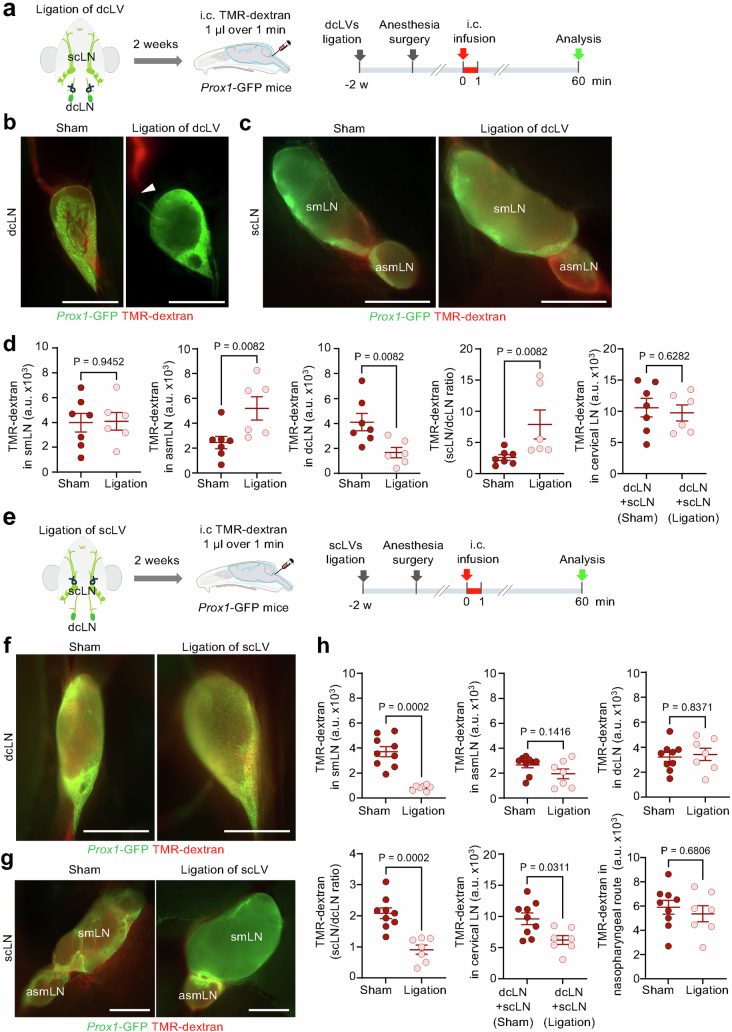
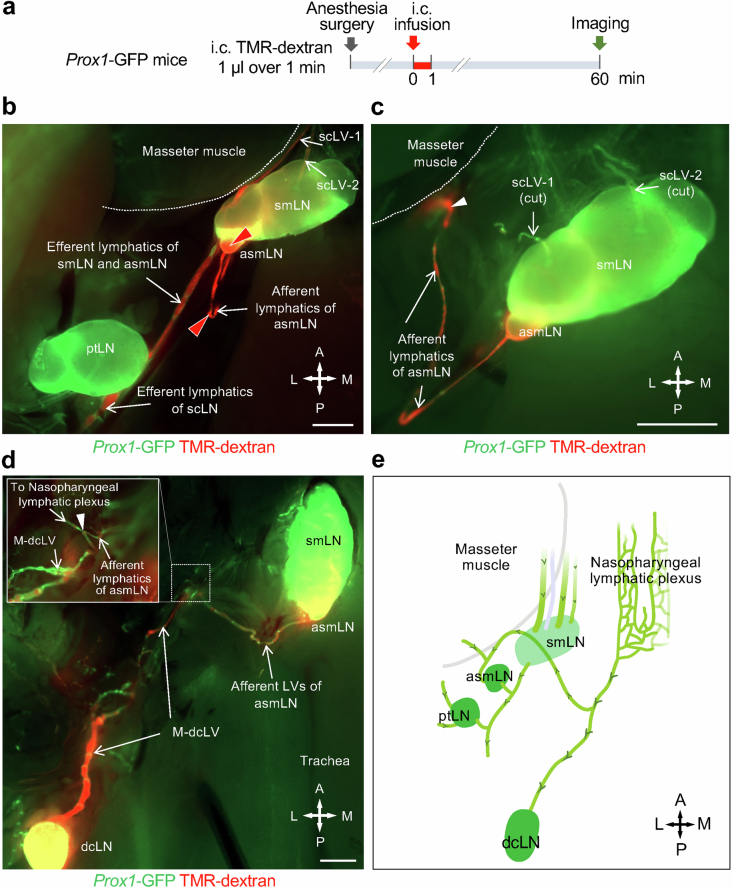
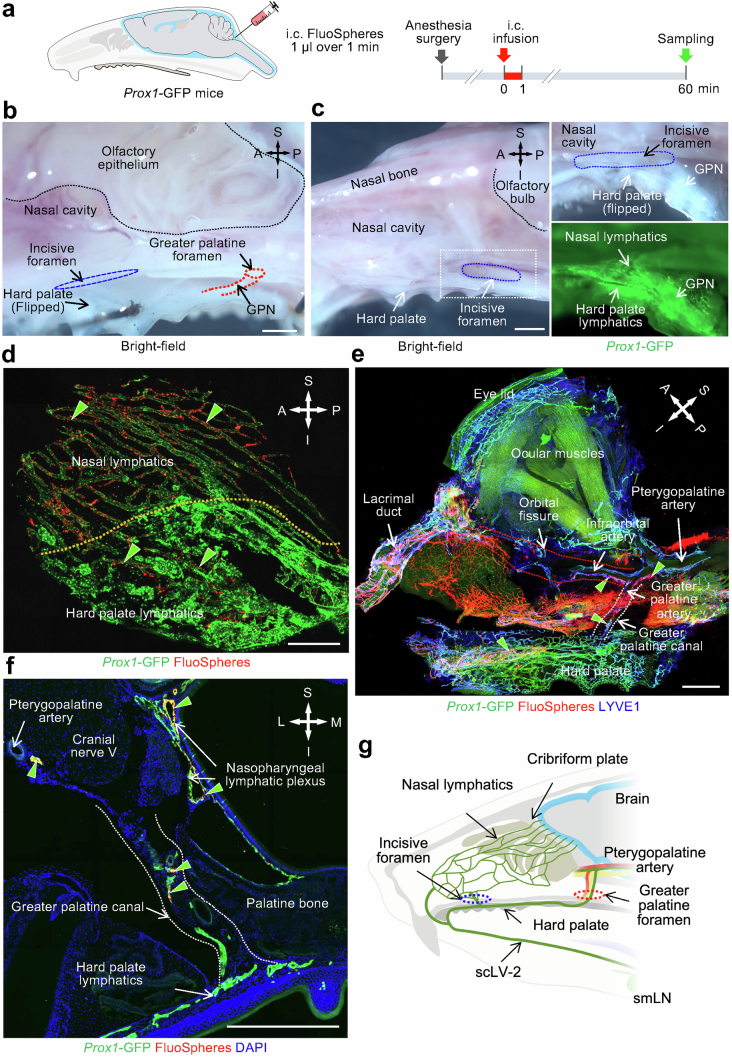
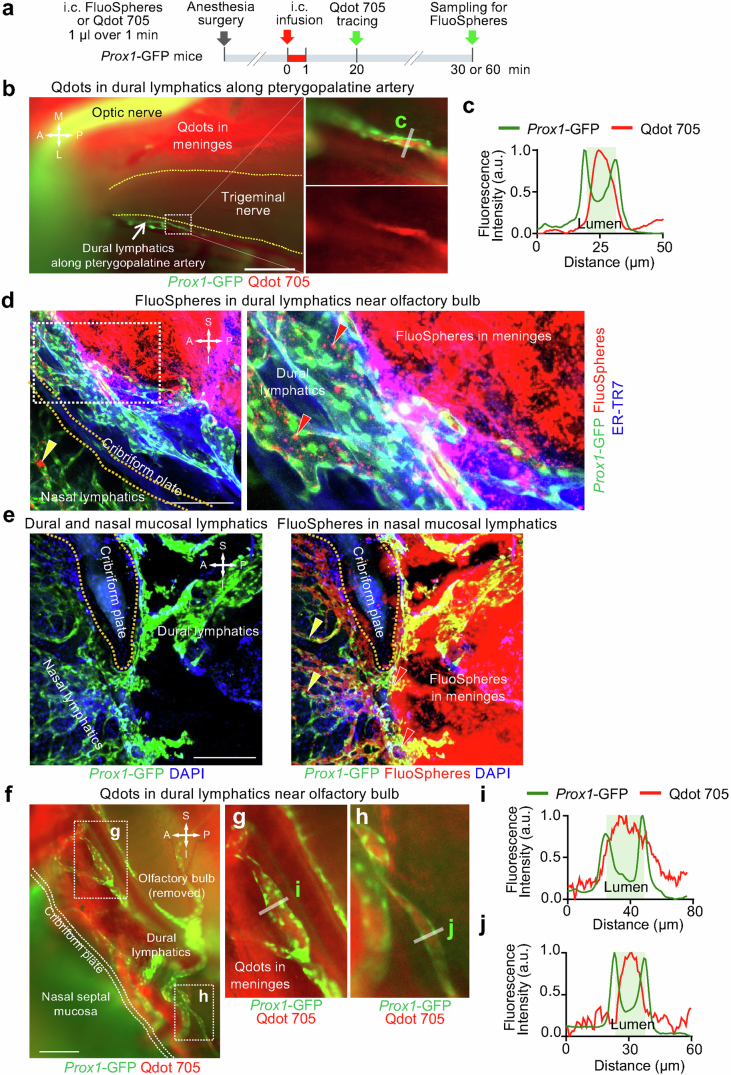
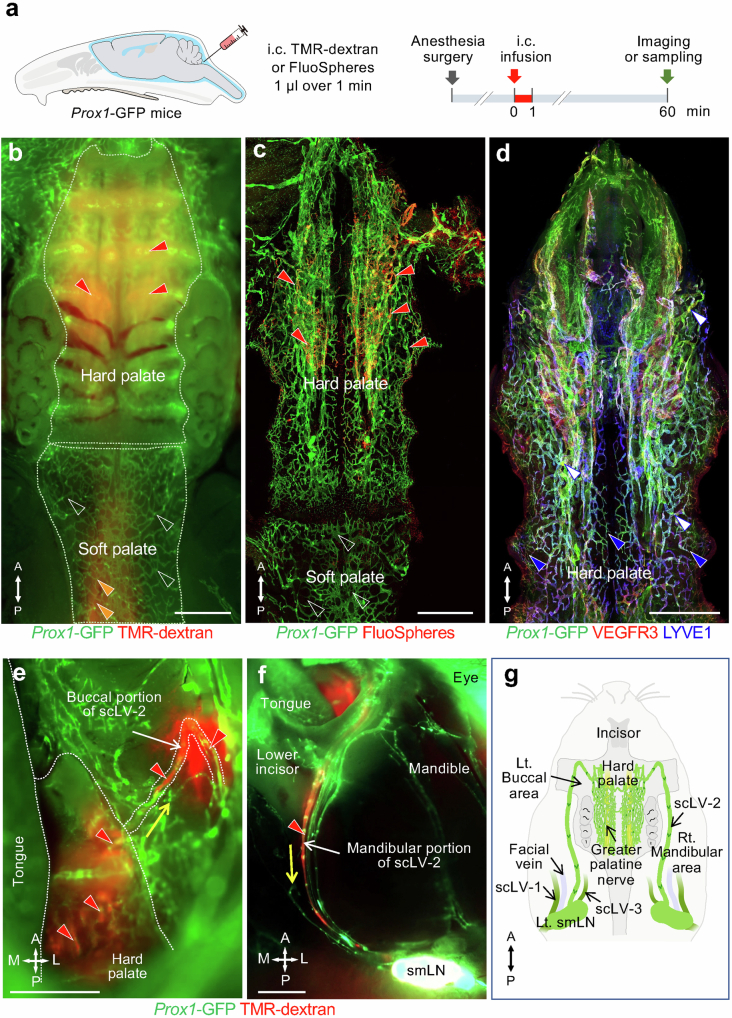
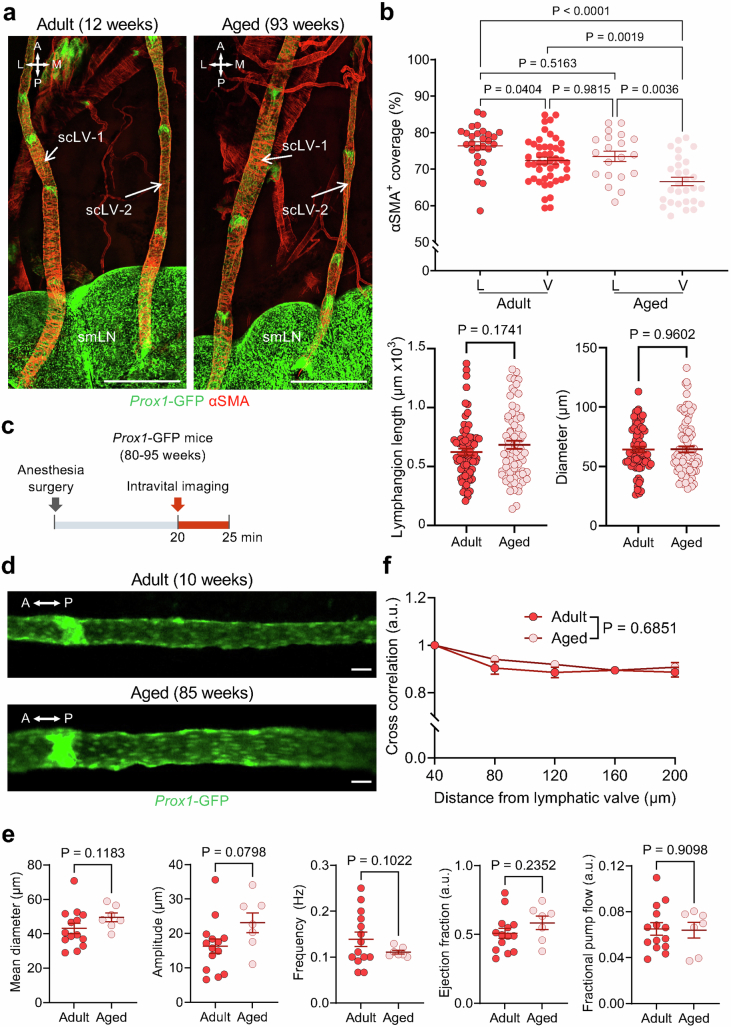
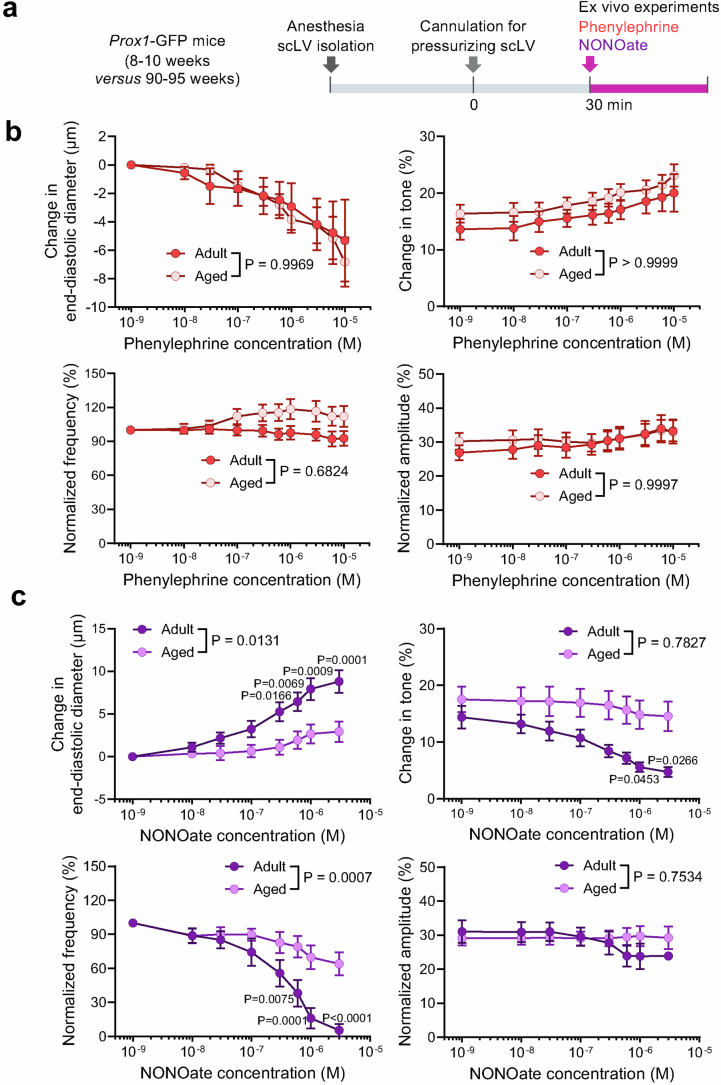
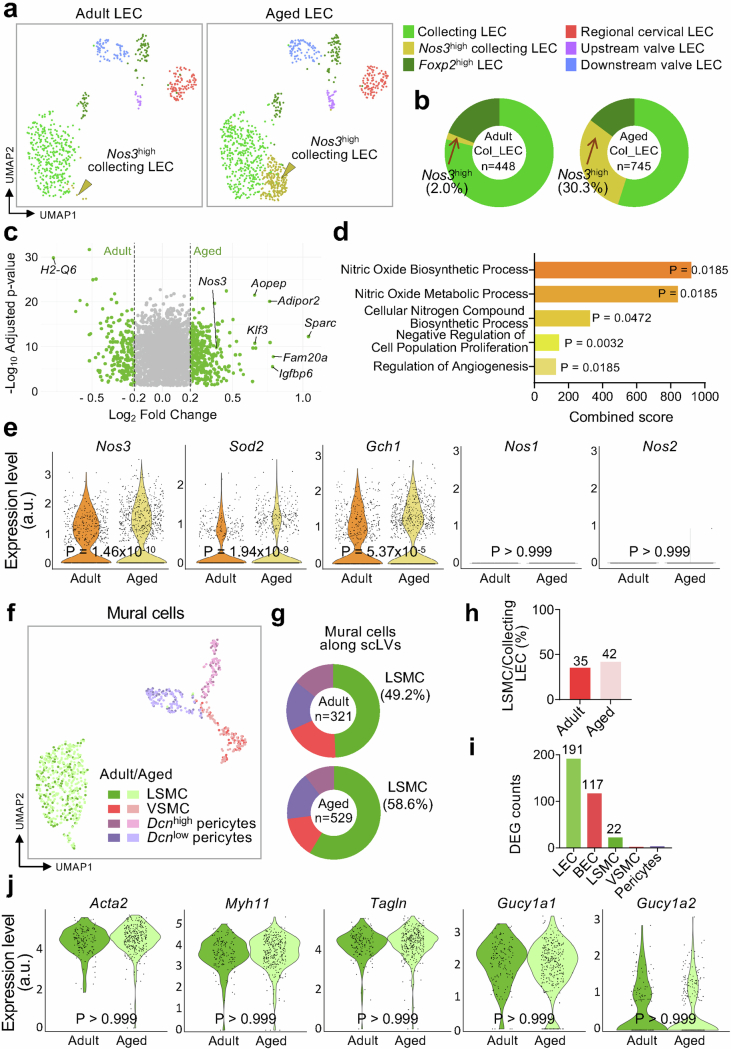
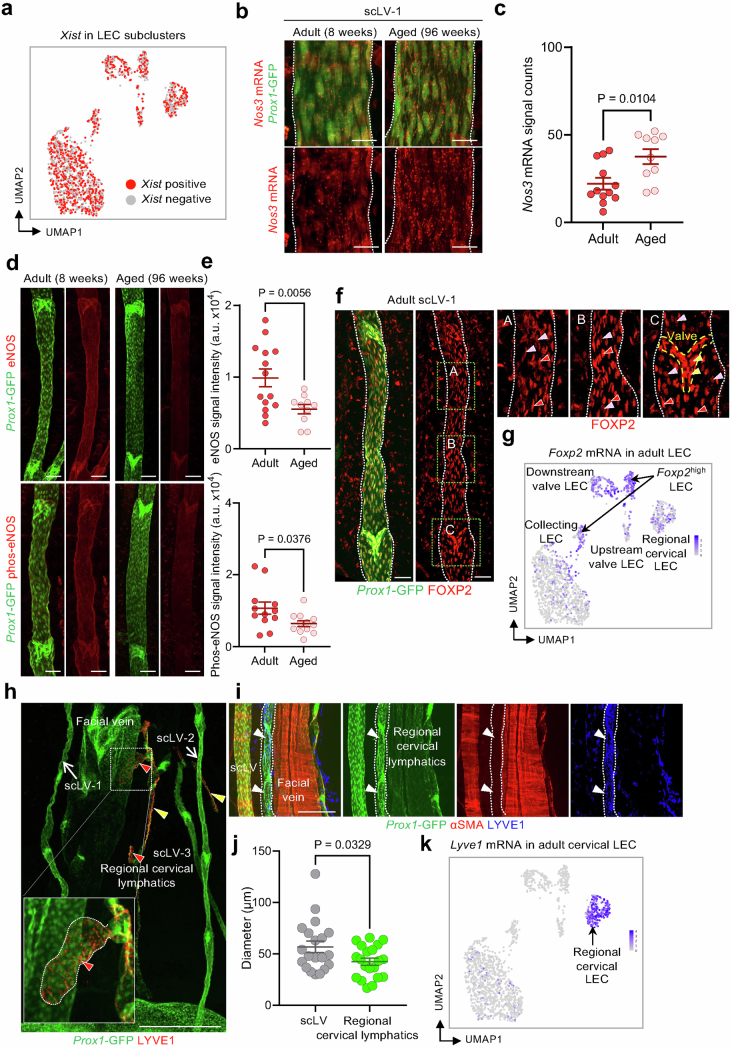
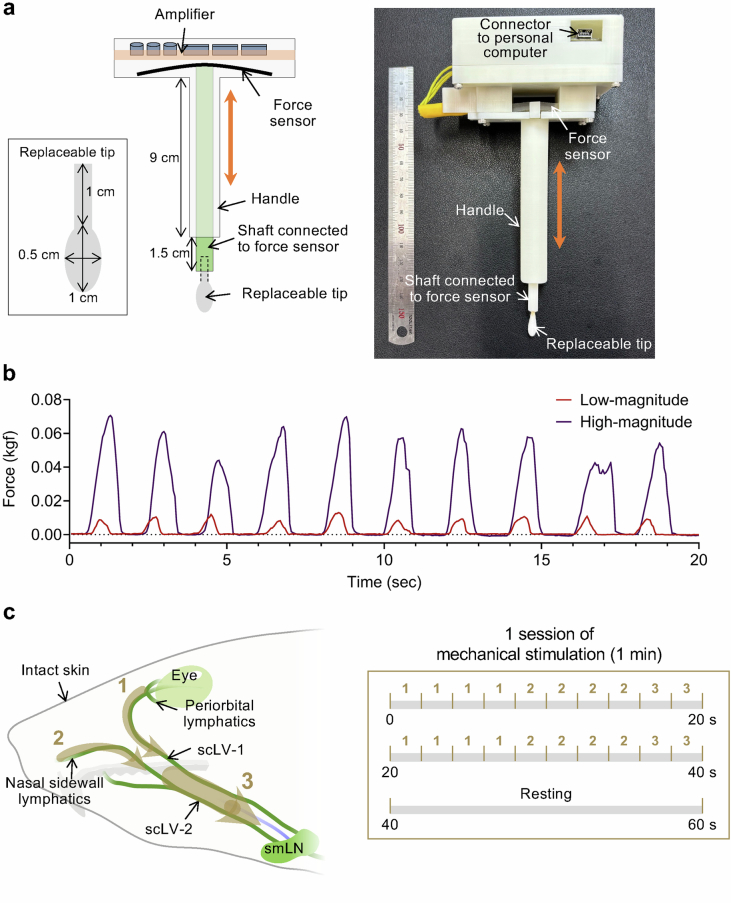
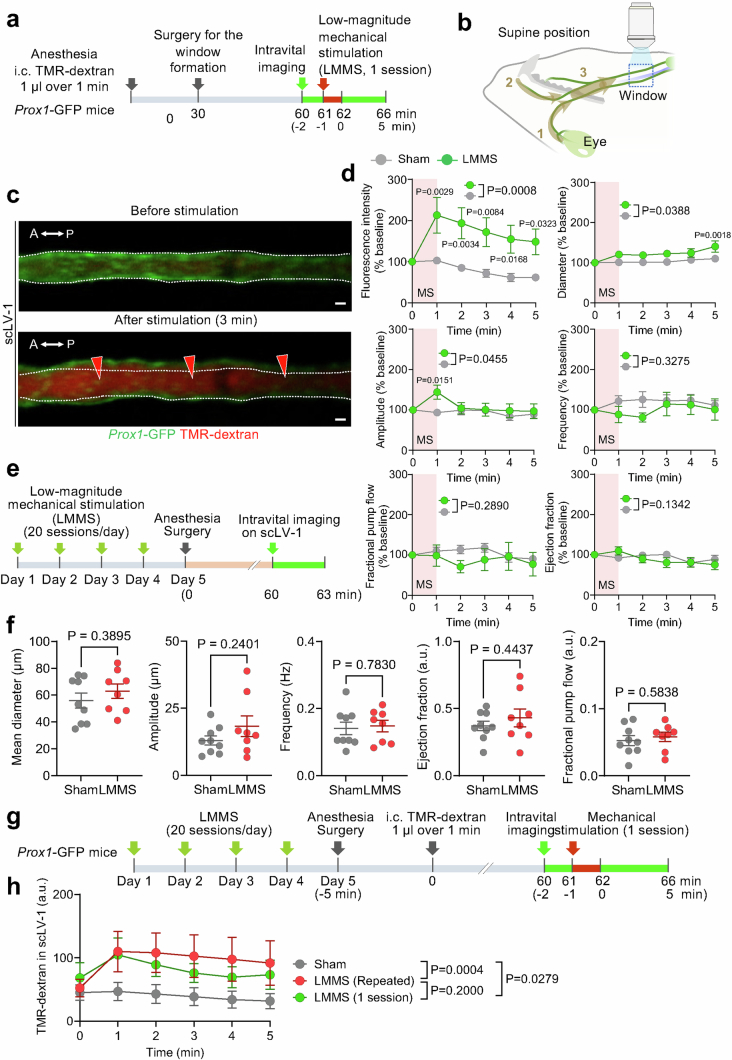
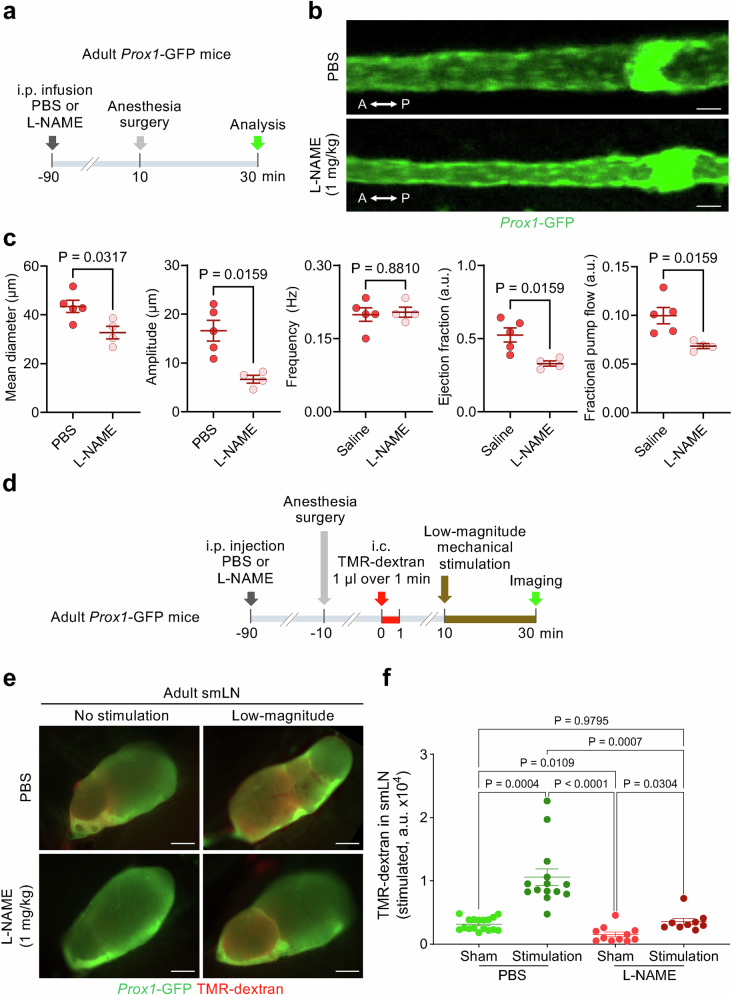
Cerebrospinal fluid (CSF) in the subarachnoid space around the brain drains to lymph nodes in the neck, but the connections and regulation have been challenging to identify1-24. Here we used fluorescent tracers in Prox1-GFP lymphatic reporter mice to map the pathway of CSF outflow through lymphatics to superficial cervical lymph nodes. CSF entered initial lymphatics in the meninges at the skull base and continued through extracranial periorbital, olfactory, nasopharyngeal and hard palate lymphatics, and then through smooth muscle-covered superficial cervical lymphatics to submandibular lymph nodes. Tracer studies in adult mice revealed that a substantial amount of total CSF outflow to the neck drained to superficial cervical lymph nodes. However, aged mice had fewer lymphatics in the nasal mucosa and hard palate and reduced CSF outflow to cervical lymph nodes. Superficial cervical lymphatics in aged mice had increased endothelial cell expression of Nos3, encoding endothelial nitric oxide synthase (eNOS), but had less eNOS protein and impaired nitric oxide signalling. Manipulation of superficial cervical lymphatics through intact skin by a force-regulated mechanical device doubled CSF outflow and corrected drainage impairment in aged mice. This manipulation increased CSF outflow by compressing superficial cervical lymphatics while having little effect on their normal spontaneous contractions. Overall, the findings highlight the importance of superficial cervical lymphatics for CSF outflow and the potential for reversing CSF drainage impairment by non-invasive mechanical stimulation.


Conflict of interest statement

Competing interests: The authors declare no competing interests.

Figures

Fig. 1
Fig. 1. Overview of CSF drainage from meningeal lymphatics to cervical lymphatics and lymph nodes.
a,b, Drawing (a) and flow chart (b) illustrating the complex lymphatic system for CSF drainage from meningeal lymphatics through multiple lymphatic pathways to superficial and deep cervical lymph nodes. (1) Meningeal lymphatics that run along the pterygopalatine and infraorbital arteries traverse the orbital fissure to join periorbital lymphatics that carry CSF through scLV-1 to the submandibular lymph node (smLN). (2) Some meningeal lymphatics that run along the pterygopalatine artery, greater palatine artery and greater palatine nerve traverse the greater palatine canal to join the hard palate lymphatic plexus en route to scLV-2 that drains CSF to the smLN. (3) Meningeal lymphatics near the olfactory bulb traverse the cribriform plate and join lymphatics in the nasal mucosa and nasal sidewall that carry CSF to scLV-2 en route to the smLN. Alternatively, nasal lymphatics traverse the incisive foramen to join the hard palate lymphatic plexus en route to scLV-2 and the smLN. (4) Other meningeal lymphatics near the olfactory bulb traverse the cribriform plate and join nasal lymphatics connected to the nasopharyngeal lymphatic plexus that carries CSF to medial dcLV en route to the accessory submandibular (asmLN) or deep cervical lymph node (dcLN). (5) Meningeal lymphatics at the base of the skull that traverse the jugular foramen join lateral dcLV en route to the dcLN. (6) The parotid lymph node (ptLN) does not receive CSF drainage. Anatomical positions are indicated in the top right corner. A, anterior; I, inferior; P, posterior; S, superior.
Fig. 2
Fig. 2. TMR–dextran distribution in scLVs and lymph nodes after intracisternal infusion.
a, Sequence of intracisternal infusion of 1.0 μl TMR–dextran over 1 min into Prox1–GFP mice followed 15, 30, 60 or 120 min later by measurement of TMR–dextran fluorescence in scLVs and draining lymph nodes. be, Images (b,d) and measurements (c,e) of TMR–dextran fluorescence in three scLVs that join the smLN. At 30 min after intracisternal infusion, TMR–dextran fluorescence (red arrowheads) is strong in scLV-1 (b), but at 60 min is strong in scLV-1 and scLV-2 (d), yet is essentially absent in scLV-3 at either time point (b,d); measurements support these findings (c,e). Scale bars, 200 μm. Each dot represents one mouse (n = 5 for no infusion, n = 9 for scLV-1, scLV-2 or scLV-3 at 30 min and n = 10 for scLV-1, scLV-2 or scLV-3 at 60 min) from three independent experiments. The error bars indicate mean ± s.e.m. P values were calculated by Kruskal–Wallis test followed by two-tailed Dunn’s multiple comparison post-hoc test. a.u., arbitrary unit. f,g, Images (f) and measurements (g) of temporal changes of TMR–dextran fluorescence in type 1 and type 2 superficial cervical lymph nodes, the dcLN (inset) and the masseter muscle. TMR–dextran fluorescence (red) is strong in all lymph nodes but is not evident in the ptLN (f). Scale bar, 500 μm. The curves show the tracer fluorescence intensity at the four time points. Each dot is the mean value for n = 4–12 mice per group from three independent experiments. The pie chart compares the amounts of tracer fluorescence in the smLN, asmLN and dcLN expressed as the percent of their area under the time-course curve (AUC; g). The error bars indicate mean ± s.e.m. Anatomical positions are indicated in the top left corner. L, lateral; M, medial. Source Data
Fig. 3
Fig. 3. CSF drainage through periorbital, nasal and hard palate lymphatics to the submandibular lymph node.
a, Sequence of intracisternal infusion of 1.0 μl TMR–dextran or FluoSpheres over 1 min into Prox1–GFP mice with analysis at 60 min. b,c, Fluorescence images of TMR–dextran (red) in head and neck lymphatics after removal of facial skin. The TMR–dextran signal is strong in scLV-1, scLV-2 and the periorbital region (red arrowhead). The white dashed line box marks the region enlarged in panel c. Scale bar, 1 mm. Representative of n = 4 mice from three independent experiments. d, Drawing showing the CSF drainage route from meningeal lymphatics near the orbit to the submandibular lymph node. e, Immunofluorescence images of FluoSpheres in periorbital (yellow arrowhead) and orbital fissure (white arrowhead) lymphatics. The white dashed lines indicate the lymphatic pathway from the orbital fissure. The orange dashed line marks the intracranial–extracranial boundary. The red dashed line boxes mark regions enlarged in panels showing that FluoSpheres (red) are abundant in periorbital (panel 1) and orbital fissure (panel 2) lymphatics (red arrowheads). Scale bar, 1 mm. Representative of n = 4 mice from three independent experiments. f, Immunofluorescence images of FluoSpheres in nasal lymphatics at 60 min after intracisternal infusion. In the nasal mucosa, FluoSpheres (red) are abundant in lymphatics (green arrowheads) but not in venous sinusoids (red arrowheads; also PROX1+). The white boxes in panel f are enlarged in panels 3–5. The white asterisk in panel f marks the junction of the nasal mucosa and hard palate. Scale bar, 500 µm. Representative of n = 5 mice from three independent experiments. g, Fluorescence image showing TMR–dextran (red) in nasal sidewall lymphatics (blue arrowhead), hard palate (orange arrowhead), and scLV-1 and scLV-2 (green arrowheads). Scale bar, 1 mm. Representative of n = 4 mice from three independent experiments. Anatomical positions are indicated in the top right corner.
Fig. 4
Fig. 4. CSF tracer in lymphatics around the eye and in the nasal sidewall, hard palate and superficial cervical regions of the monkey.
a, Sequence of intracisternal infusion of 2.5 ml indocyanine green (ICG) into M. fascicularis monkeys over 10 min followed at 30 min by imaging of ICG in the face and neck. Before infusion, 1.0 ml of CSF was removed at the cisterna magna over 10 min. be, Images of the face of monkeys before and after the intracisternal infusion showing ICG fluorescence (white) in lymphatics. The white asterisk (bone–cartilage junction) marks the lymphatic connection between the nasal mucosa and nasal sidewall. The green arrows indicate ICG in lymphatics in the periorbital and nasal sidewall regions and in scLVs. The yellow arrows indicate ICG in the smLN. Representatives of n = 3 monkeys from three independent experiments. f, Image showing ICG fluorescence (white) in hard palate and buccal lymphatics and scLVs (green arrowheads) of a monkey after intracisternal infusion. The white dashed line marks the boundary of the hard palate. Representatives of n = 3 monkeys from three independent experiments. Anatomical positions are indicated in the bottom right corner.
Fig. 5
Fig. 5. Ageing-related changes in lymphatics of the nasal mucosa and hard palate.
a, Immunofluorescence images of whole mounts comparing hard palate lymphatics in adult (8 weeks of age) and aged (90 weeks of age) Prox1–GFP mice. Like lymphatics, venous sinusoids are PROX1+. Ageing-related reductions in the lymphatic plexus are outlined by white dashed line boxes that mark regions of interest (ROIs) near the greater palatine nerve (ROI-1) and incisive foramen (ROI-2). Scale bars, 500 μm. Representative of n = 9 mice (adult) and n = 8 mice (aged) from three independent experiments. b, Comparison of lymphatic diameter, VEGFR3+ lymphatic area, LYVE1 intensity and number of lymphatic valves in ROI-1 and ROI-2 in adult (8–10 weeks of age; n = 9) and aged (86–95 weeks of age; n = 8) Prox1–GFP mice. Each dot is the value for one mouse. The error bars indicate mean ± s.e.m. P values were calculated by two-tailed Welch’s t-test. c, Immunofluorescence images of whole mounts comparing nasal lymphatics in adult (8 weeks of age) and aged (90 weeks of age) Prox1–GFP mice. Staining as in panel a. ROI-3 marks the measured region of PROX1+/VEGFR3+ nasal lymphatics (red) for data in panel d. Unlike PROX1+/VEGFR3+ nasal lymphatics, which are abundant in young adults but less in aged mice, PROX1+ venous sinusoids (green; marked by green arrows) are more abundant in aged mice, as previously described. Scale bars, 500 μm. Representative of n = 4 mice (adult) and n = 4 mice (aged) from three independent experiments. d, Comparison of lymphatic diameter and PROX1+/VEGFR3+ lymphatic area in nasal lymphatics of adult (8–10 weeks of age; n = 4) and aged (86–95 weeks of age; n = 4) Prox1–GFP mice. Each dot is the value for one mouse. The error bars indicate mean ± s.e.m. P values were calculated by two-tailed Mann–Whitney U-tests. Anatomical positions are indicated in the bottom left or top right corner. Source Data
Fig. 6
Fig. 6. Increased CSF drainage by non-invasive mechanical stimulation of scLVs.
a, Sequence of intracisternal infusion of TMR–dextran into Prox1–GFP mice followed by mechanical stimulation at 30 min for 5 min, then imaging of TMR–dextran in scLV-1 and scLV-2 at 35 min. b,c, Fluorescence images and measurements of TMR–dextran in scLV-1 and scLV-2. Sham compared with mechanical stimulation (b). Anatomical positions are indicated. Scale bars, 200 μm. Each dot represents combined TMR–dextran fluorescence intensity in scLV-1 and scLV-2 from one mouse (c). n = 7 (sham), n = 10 (low magnitude) and n = 6 (high magnitude) from three independent experiments. The error bars indicate mean ± s.e.m. P values were calculated by Brown–Forsythe analysis of variance (ANOVA) test followed by two-tailed Dunnett’s T3 multiple comparison post-hoc test. d, Sequence of intracisternal infusion of TMR–dextran into Prox1–GFP mice followed by mechanical stimulation at 10 min for 20 min, then imaging of TMR–dextran in the smLN at 30 min. e,f, Fluorescence images (e) and measurements (f) of TMR–dextran in the smLN of the stimulated side (top) versus unstimulated side (bottom). Scale bars, 500 μm. Each dot is the value for one mouse. n = 12 (sham), n = 10 (low magnitude) and n = 13 (high magnitude) from three independent experiments. The error bars indicate mean ± s.e.m. P values were calculated by Brown–Forsythe ANOVA test followed by two-tailed Dunnett’s T3 multiple comparison post-hoc test. g,h, Sequence of intracerebroventricular infusion of TMR–dextran into Prox1–GFP mice followed by low-magnitude mechanical stimulation (LMMS) at 10 min for 10 min and removal of CSF at 30 min (g). Fluorescence in CSF after LMMS or sham is also shown (h). Each dot is the value for one mouse. n = 6 (sham) and n = 7 (LMMS) from three independent experiments. The error bars indicate mean ± s.e.m. P values were calculated by two-tailed unpaired t-test with Welch’s correction. FI, fluorescence intensity. Source Data
Fig. 7
Fig. 7. Increased CSF drainage in aged mice by mechanical stimulation of scLVs.
a, Sequence of intracisternal infusion of 1.0 μl TMR–dextran over 1 min into aged Prox1–GFP mice (87–105 weeks of age) followed 10 min later by sham or low-magnitude mechanical stimulation of intact skin over 20 min beginning 10 min after TMR–dextran infusion. TMR–dextran fluorescence was imaged and measured in the ipsilateral smLN at 30 min. b,c, Fluorescence images (b) and measurements (c) of TMR–dextran fluorescence in the smLN after ipsilateral low-magnitude mechanical stimulation of the skin or no stimulation (sham) over 20 min. Scale bars, 500 μm. Each dot is the TMR–dextran fluorescence intensity of the smLN in one mouse. n = 6 mice per group from three independent experiments. The error bars indicate mean ± s.e.m. P values were calculated by two-tailed Mann–Whitney U-test. d, Sequence of intracisternal infusion of 1.0 μl TMR–dextran over 1 min into aged Prox1–GFP mice (87–105 weeks of age) followed by sham or low-magnitude mechanical stimulation of intact skin over 5 min beginning 30 min after TMR–dextran infusion. TMR–dextran fluorescence was imaged and measured in ipsilateral scLV-1 and scLV-2 at 35 min. e,f, Fluorescence images and measurements of TMR–dextran fluorescence in scLV-1 and scLV-2 at 35 min after ipsilateral low-magnitude mechanical stimulation of the skin or no stimulation (sham) over 5 min. Anatomical positions are shown in the bottom left corner. Scale bars, 200 μm. Each dot is the value of the combined TMR–dextran fluorescence intensity of scLV-1 and scLV-2 from one mouse. n = 5 (sham) and n = 4 (low-magnitude mechanical stimulation) mice per group from three independent experiments. The error bars indicate mean ± s.e.m. P values were calculated by two-tailed Mann–Whitney U-test. Source Data
Extended Data Fig. 1
Extended Data Fig. 1. Variability in relative positions of superficial cervical lymph nodes.
a-c, Fluorescence images and drawings of the three types of superficial cervical lymph nodes defined by the relationship of the accessory submandibular lymph node (asmLN, white dashed line) to neighboring lymph nodes in Prox1-GFP mice (a,b). Type 1, asmLN is fused with the submandibular lymph node (smLN). Type 2, asmLN is separated from both smLN and the parotid lymph node (ptLN). Type 3, asmLN is fused with ptLN. Anatomical positions are indicated in the top left corner (a): A, anterior; P, posterior; M, medial; L, lateral. Scale bars, 1 mm. Drawings illustrate the relationship of asmLN to other lymph nodes (b). Pie charts showing the percentage of the three types of asmLN in male (n = 41), female (n = 36), and all (n = 77) mice (c). d-f, Sequence of intracisternal (i.c.) infusion of 1.0 μl TMR-dextran over 1 min into Prox1-GFP mice followed 15, 30, 60, or 120 min later by measurement of TMR-dextran fluorescence in superficial cervical lymph nodes (d). Fluorescence images representative of n = 7 mice showing TMR-dextran distribution in asmLN (green dashed line) and ptLN components of a Type 3 superficial cervical lymph node at 30 min after intracisternal infusion (e). TMR-dextran fluorescence in (i) asmLN and the adjacent region of ptLN (red arrowheads) and in (ii) efferent lymphatics (orange dashed lines) but not in (iii) afferent lymphatics of ptLN (blank arrowheads) at 30 min after intracisternal infusion (e). Scale bars, 500 μm. Measurements of temporal changes in TMR-dextran fluorescence in Type 1, Type 2, and Type 3 superficial cervical lymph nodes after intracisternal infusion (f). Each dot represents the mean value of superficial cervical lymph nodes on one side of n = 3-5 mice for 15 min, n = 7-19 mice for 30 min, n = 10-15 mice for 60 min, and n = 6-17 mice for 120 min. Error bars indicate mean ± s.e.m. a.u., arbitrary unit. P values calculated by two-way ANOVA followed by Tukey’s multiple comparison test. Source Data
Extended Data Fig. 2
Extended Data Fig. 2. Compensatory redistribution of CSF drainage after ligation of either deep or superficial cervical lymphatics.
a, Sequence for intracisternal (i.c.) infusion of 1 µl TMR-dextran over 1 min into Prox1-GFP mice 2 wk after ligation of deep cervical lymphatics (dcLV) on both sides. The fluorescence intensity of the deep cervical (dcLN) and superficial cervical lymph nodes (scLN) was measured at 60 min after TMR-dextran infusion. b,c, Fluorescence images of dcLN, submandibular lymph node (smLN, left) and accessory submandibular lymph nodes (asmLN, right) after ligation of the deep cervical lymphatics (dcLV). TMR-dextran accumulated in the dcLN in the sham group but not in the ligation group. However, TMR-dextran fluorescence in the asmLN is stronger in the ligation group than in the sham group. Scale bars, 1 mm. Representative of n = 6-7 mice from three independent experiments. d, Comparison of TMR-dextran signal intensity in smLN, asmLN, dcLN, scLN/dcLN ratio, and cervical LN. Compensation in CSF drainage among cervical lymph nodes at 2 wk after ligation of deep cervical lymphatics (dcLV) shown by similar CSF drainage to cervical lymph nodes (sum of TMR-dextran fluorescence intensity for superficial and deep cervical lymph nodes) without ligation (sham, left) and with ligation (right) and increased ratio of TMR-dextran fluorescence in superficial to deep cervical lymph nodes with ligation. Each dot is the value for one mouse. Sham (n = 7 mice), dcLV ligation (n = 6 mice) from three independent experiments. Error bars indicate mean ± s.e.m. a.u., arbitrary unit. P values calculated by two-tailed Mann-Whitney U-test. e, Sequence for intracisternal (i.c.) infusion of 1 µl TMR-dextran over 1 min into Prox1-GFP mice at 2 weeks after ligation of superficial cervical lymphatics (scLV) on both sides. The fluorescence intensity of the deep cervical (dcLN) and superficial cervical lymph nodes (scLN) was measured at 60 min after TMR-dextran infusion. f,g, Strong TMR-dextran fluorescence (red) in a deep cervical lymph node (dcLN, f) and accessory submandibular lymph node (asmLN, g), with or without (sham) ligation of scLV. However, red fluorescence is evident in a submandibular node (smLN) in the sham but not after scLV ligation (g). Scale bars, 1 mm. Representative images of n = 7-9 mice from three independent experiments. h, Measurements of TMR-dextran fluorescence in smLN, asmLN, and dcLN with or without scLV ligation. Also shown are corresponding calculated values for the ratio of superficial to deep lymph nodes (scLN/dcLN), sum of deep and superficial cervical lymph nodes (dcLN + scLN), and nodes downstream of the nasopharyngeal lymphatic drainage route (asmLN + dcLN, as shown in Fig. 1). ScLV ligation resulted a large reduction in TMR-dextran in smLN (and corresponding reduction in dcLN + scLN) but no reduction in asmcLV or dcLN due to continued patency of the nasopharyngeal route. Each dot is the value for one mouse. Sham (n = 9 mice) and scLV ligation (n = 7 mice) from three independent experiments. Error bars indicate mean ± s.e.m. a.u., arbitrary unit. P values calculated by two-tailed Mann-Whitney U-test. Source Data
Extended Data Fig. 3
Extended Data Fig. 3. FluoSpheres distribution in cervical lymph nodes and hard palate of monkeys after infusion into cisterna magna.
a, Sequence of intracisternal (i.c.) infusion of FluoSpheres into Macaca fascicularis monkeys at 2.5 ml over 10 min followed by measurement of FluoSpheres in cervical lymph nodes and hard palate at 180 min. Before infusion, 1 ml of CSF was removed at the cisterna magna over 10 min. Anesthesia was administered until the end of the infusion and then readministered at 180 min. b, Immunofluorescence images showing the distribution of FluoSpheres (red) and LYVE1+ vessels in submandibular, parotid, and retropharyngeal lymph nodes (LN). White dashed line boxes mark regions enlarged in panels below. Red arrowheads mark regions with abundant FluoSpheres in lymph node medullary sinusoids. Scale bars, 1 mm. Representative of n = 2 monkeys from two independent experiments. c, Fluorescence image showing the distribution of FluoSpheres (red) in the right-side of the hard palate of a Macaca fascicularis monkey. FluoSpheres (red arrowheads) are abundant near the incisive and greater palatine foramina (white dashed ellipses) in the hard palate. Scale bar, 5 mm. Representative of n = 2 monkeys from two independent experiments. Anatomical positions are indicated in the top right corner: A, anterior; P, posterior; M, medial; L, lateral.
Extended Data Fig. 4
Extended Data Fig. 4. Lymphatic connection of nasopharyngeal lymphatic plexus to accessory submandibular lymph node.
a, Sequence of intracisternal (i.c.) infusion of 1.0 μl TMR-dextran over 1 min into Prox1-GFP mice followed by imaging of TMR-dextran in superficial cervical lymphatics and lymph nodes 60 min later. b,c, Fluorescence image of Prox1-GFP mouse showing TMR-dextran (red) in superficial cervical lymphatics scLV-1 and scLV-2, submandibular (smLN) and accessory submandibular (asmLN) lymph nodes, and efferent lymphatics from these lymph nodes but not in the parotid lymph node (ptLN) (b). Lymphatics near the masseter muscle (white arrowhead) en route to asmLN (c). White dashed lines mark the border of the masseter muscle. Scale bars, 1 mm. Representative of n = 4 mice from four independent experiments. d, Fluorescence image showing the connections of medial deep cervical lymphatics (M-dcLV) and lymphatics that drain into the accessary submandibular lymph node (asmLN). White dashed line boxes marks the connecting point (white arrowhead) and the enlargement of this region. TMR-dextran fluorescence (red) is strong in M-dcLV and afferent lymphatics of asmLN and in the deep cervical lymph node (dcLN) and asmLN. Scale bars, 1 mm. Representative of n = 4 mice from four independent experiments. e, Drawing summarizing the lymphatic connections of the nasopharyngeal lymphatic plexus and the downstream accessory submandibular (asmLN) and deep cervical (dcLN) lymph nodes. The submandibular (smLN) and parotid (ptLN) lymph nodes are not downstream of the nasopharyngeal lymphatic plexus. Anatomical positions are indicated in the bottom right corner: A, anterior; P, posterior; M, medial; L, lateral.
Extended Data Fig. 5
Extended Data Fig. 5. CSF drainage through two lymphatic routes to hard palate lymphatics en route to the submandibular lymph node.
a, Sequence of intracisternal (i.c.) infusion of 1.0 μl FluoSpheres over 1 min into Prox1-GFP mice followed by imaging of FluoSphere distribution in the nasal cavity and hard palate 60 min later. b, Brightfield microscopic image showing the anatomical location of the incisive foramen (blue dashed elliptical circle), greater palatine foramen (red dashed circle), and greater palatine nerve (GPN, red dashed lines). The black dashed line marks the border of the olfactory epithelium. Scale bar, 1 mm. Representative of n = 3 mice from three independent experiments. c, Brightfield, fluorescence, and immunofluorescence images of whole mounts showing connections between lymphatics in the nasal cavity and hard palate through the incisive foramen. Brightfield image showing the anatomical location of the incisive foramen (blue dashed elliptical circle). White dashed line box is enlarged in brightfield and fluorescence images in the right two panels that show connections between lymphatics in the nasal mucosa and hard palate through the incisive foramen. The black dashed line marks the border of the intracranial olfactory bulb. Scale bar, 1 mm. Representative of n = 4 mice from three independent experiments. d, Immunofluorescence image showing FluoSpheres (red) within lymphatics in the nasal mucosa and hard palate (green arrowheads). The orange dashed line marks the boundary between lymphatics in the nasal mucosa and hard palate. Scale bar, 200 μm. Representative of n = 4 mice from three independent experiments. e, Immunofluorescence image of whole mount showing FluoSpheres (red) and lymphatics (Prox1-GFP, green; LYVE1, blue) in the periorbital area and hard palate. FluoSphere fluorescence is strong in lymphatics along the pterygopalatine artery, infraorbital artery in the orbital fissure, greater palatine artery in the greater palatine canal, and hard palate (green arrowheads). Red dashed lines mark the lymphatic pathway from the orbital fissure to periorbital lymphatics. White dashed lines mark the lymphatic pathway from descending branch of pterygopalatine artery through the greater palatine canal to the hard palate plexus. Scale bar, 1 mm. Representative of n = 4 mice from three independent experiments. f, Immunofluorescence image of coronal section of the greater palatine canal showing FluoSpheres (red) in lymphatics (green) along the pterygopalatine artery, in the greater palatine canal, and in the nasopharyngeal lymphatic plexus (green arrowheads). The white dashed lines mark the lymphatic pathway from the greater palatine canal to the hard palate. Scale bar, 500 μm. Representative of n = 4 mice from three independent experiments. g, Drawing of two lymphatic routes for CSF to reach the hard palate lymphatic plexus, superficial cervical lymphatic scLV-2, and submandibular lymph node (smLN): (1) Meningeal lymphatics that cross the cribriform plate join nasal lymphatics and then traverse the incisive foramen to join the hard palate plexus. (2) Meningeal lymphatics along the pterygopalatine artery travel with the greater palatine artery through the greater palatine canal and join the hard palate lymphatic plexus. Lymphatics in the hard palate plexus carry CSF to scLV-2 en route to the submandibular lymph node. Anatomical positions are indicated in the top right corner: S, superior; I, inferior; A, anterior; P, posterior; M, medial; L, lateral.
Extended Data Fig. 6
Extended Data Fig. 6. Dural lymphatics containing tracers after infusion into the CSF.
a, Sequence of intracisternal (i.c.) infusion of 1.0 μl FluoSpheres or Qdot 705 over 1 min into Prox1-GFP mice followed by imaging of the tracer distribution in dural lymphatics near pterygopalatine artery or cribriform plate 20, 30 or 60 min later. b,c, Fluorescence images of Qdot 705 in dural lymphatics along pterygopalatine artery (b). Trigeminal nerve is outlined by yellow dashed line. Region of dashed line box is enlarged in right two panels, upper showing Prox1-GFP and Qdot 705 and lower showing only Qdot 705. Fluorescence intensity profiles of Prox1-GFP and Qdot 705 in the dural lymphatic (gray bar in b) is shown in c. Scale bar, 500 μm. Representative of n = 3 mice from three independent experiments. d,e, Confocal microscopic images of whole mounts showing a sagittal view of lymphatics near the cribriform plate (yellow dashed line). Dashed line box in d-left is enlarged in d-right. Panel e shows a region near d without (e-left) and with (e-right) the red channel (FluoSpheres). After intracisternal infusion, FluoSpheres (red) are located in dural lymphatics (red arrowheads), nasal mucosal lymphatics (yellow arrowheads), and trapped in the meninges (probably arachnoid layer) bordering the SAS. Staining of meninges by anti-mouse fibroblast antibody ER-TR7 (blue). Scale bars, 200 μm. Representative of n = 6 mice from three independent experiments. f-j, Fluorescence images showing Qdot 705 in dural lymphatics near the cribriform plate (white dashed lines). Regions in f marked by dashed line boxes are enlarged in right two panels (g and h). Fluorescence intensity profiles of Prox1-GFP and Qdot 705 (i and j) in dural lymphatics (gray bars in g and h). Scale bar, 1 mm. Representative of n = 3 mice from three independent experiments. Anatomical positions are indicated in the top right or left corner: S, superior; I, inferior; A, anterior; P, posterior; M, medial; L, lateral.
Extended Data Fig. 7
Extended Data Fig. 7. CSF drainage through the hard palate lymphatic plexus to the submandibular lymph node.
a, Sequence of intracisternal (i.c.) infusion of 1.0 μl TMR-dextran or FluoSpheres over 1 min into Prox1-GFP mice followed by analysis of the distribution of the tracer in the hard palate lymphatic plexus at 60 min. b-d, Fluorescence images showing the distribution of TMR-dextran or FluoSpheres (red) in whole mounts of the hard palate and soft palate of Prox1-GFP mice (b,c). White dashed lines mark border between hard palate and soft palate (b). Tracer fluorescence (red) is strong in hard palate lymphatic plexus (red arrowheads) but not in soft palate lymphatic plexus (b,c white empty arrowheads). Orange arrowheads mark the faint TMR-dextran fluorescence in the nasopharyngeal lymphatic plexus (b). Hard palate lymphatic plexus of Prox1-GFP mouse stained for VEGFR3 (red) and LYVE1 (blue) (d). Lymphatic valves (d, white arrowheads). Initial lymphatics (d, blue arrowheads) are distributed in the medial and lateral sides of hard palate. Scale bars, 1 mm. Representative of n = 5 mice from three independent experiments. e,f, Images showing TMR-dextran fluorescence (red arrowheads) in the buccal (e) and mandibular (f) portions of superficial cervical lymphatic scLV-2 between the hard palate lymphatic plexus and submandibular lymph node. White dashed lines (e) outline border of hard palate, tongue, and buccal portion of scLV-2. Yellow arrows mark the direction of CSF outflow. Scale bars, 1 mm. Representative of n = 5 mice from three independent experiments. g, Drawing of downstream connection of hard palate plexus to submandibular lymph node (smLN) through buccal and mandibular portions of scLV-2 for CSF drainage. Locations of scLV-1 and scLV-3 are shown for comparison. Left (Lt.), Right (Rt.). Anatomical positions are indicated in the bottom left corner: A, anterior; P, posterior; M, medial; L, lateral.
Extended Data Fig. 8
Extended Data Fig. 8. Ageing-related changes in smooth muscle coverage and functional properties of superficial cervical lymphatics in vivo.
a, Immunofluorescence images showing smooth muscle coverage in superficial cervical lymphatics (scLV) of aged Prox1-GFP mice (93 weeks) and in younger adults (12 weeks). α-smooth muscle actin (αSMA), Submandibular lymph node (smLN). Scale bars, 500 μm. Representative of n = 12-13 mice from three independent experiments. b, Measurements showing less circular smooth muscle coverage (α-smooth muscle actin, αSMA) in the peri-valvular region (V) of superficial cervical lymphatics in aged Prox1-GFP mice (80–95 weeks) than in younger adults (10–12 weeks) but no difference in coverage of the middle of lymphangions (L) (upper). Similarities of lymphangion length and diameter at the two ages are also shown (lower). Each dot is the value for one lymphangion. n = 13 (adult), n = 12 (aged) mice per group from four independent experiments. Error bars indicate mean ± s.e.m. P values calculated by two-tailed unpaired t test with Welch’s correction or Brown-Forsythe ANOVA test followed by Dunnett’s T3 multiple comparison test. c, Sequence of surgical exposure and intravital imaging of superficial cervical lymphatics scLV-1 from adult (10–12 weeks) and aged (80–95 weeks) Prox1-GFP mice. Intravital imaging began after a 20-min stabilization period and lasted 5 min. d, Intravital images of superficial cervical lymphatic scLV-1 of adult (10 weeks) and aged (85 weeks) Prox1-GFP mice. Scale bars, 20 μm. Representative of n = 7-14 mice from four independent experiments. e, Measurements showing no age-related difference in mean diameter, contraction amplitude, frequency of spontaneous contraction, ejection fraction, or fractional pump flow of scLV-1 from aged Prox1-GFP mice (80–95 weeks) and younger adults (10–12 weeks). Each dot is the value for one mouse. n = 14 (adult), n = 7 (aged) mice of both sexes per group from four independent experiments. Error bars indicate mean ± s.e.m. a.u., arbitrary unit. P values calculated by two-tailed unpaired t test with Welch’s correction. f, Measurements of synchronization of spontaneous contractions and relaxations within a lymphangion assessed by cross-correlation of changes in diameter at five locations in superficial cervical lymphatics scLV-1 spaced 40 μm to 200 μm away from a valve in aged (80–95 weeks) and younger adult (10–12 weeks) Prox1-GFP mice. Each dot is the value for one mouse and n = 8 (adult), n = 7 (aged) mice for both sexes from three independent experiments. Error bars indicate mean ± s.e.m. P values calculated by two-way ANOVA test. The P value represents the significance of the interaction between cross-correlation and the measurement location. Anatomical positions are indicated in the top left corner: A, anterior; P, posterior; M, medial; L, lateral. Source Data
Extended Data Fig. 9
Extended Data Fig. 9. Ageing-related reduction in response of isolated superficial cervical lymphatics to NONOate but not to phenylephrine.
a, Sequence of experiments of superficial cervical lymphatics scLV-1 or scLV-2 removed from Prox1-GFP mice at age 8–10 weeks (adult) and 90–95 weeks (aged), cannulated, pressurized, and then exposed ex vivo to phenylephrine or NONOate. b, Comparison of response to phenylephrine measured by changes in end-diastolic diameter, tone, normalized frequency, and amplitude of scLV-1 and scLV-2 after removal from adult (8–10 weeks, n = 9) and aged (90–95 weeks, n = 14) Prox1-GFP mice. No significant age-related differences were found. Each dot is the value for one mouse of either sex from three independent experiments. Error bars indicate mean ± s.e.m. P values calculated by two-way ANOVA test followed by two-tailed Sidak’s multiple comparison test. The P values represent the significance of the interaction between phenylephrine concentration and scLV from adult or aged mice. c, Comparison of response to NONOate reflected by changes in end-diastolic diameter, tone, normalized frequency, and amplitude of scLV-1 and scLV-2 from adult (8–10 weeks, n = 9) and aged (90–95 weeks, n = 14) Prox1-GFP mice. Ageing-related differences in concentration-dependent NONOate-induced end-diastolic diameter and normalized frequency were significant. Each dot is the value for one mouse of either sex from three independent experiments. Error bars indicate mean ± s.e.m. P values calculated by two-way ANOVA test followed by two-tailed Sidak’s multiple comparison test. The P values represent the significance of the interaction between NONOate concentration and scLV from adult or aged mice. Source Data
Extended Data Fig. 10
Extended Data Fig. 10. Ageing-related transcriptomic changes in superficial cervical lymphatics.
a, Uniform manifold approximation and projection (UMAP) plot of single-cell gene expression (scRNA-seq) showing six subclusters of lymphatic endothelial cells (LEC) isolated from superficial cervical lymphatics scLV-1 and scLV2 proximal to and around submandibular lymph nodes of adult (12 weeks) and aged (93 weeks) mice. Gold arrowheads mark the Nos3high collecting LEC subcluster that is greatly increased in aged mice. b, Pie charts showing the 15-fold enlargement of the Nos3high LEC subcluster in collecting LEC from aged mice (745 cells) compared collecting LEC from adult mice (448 cells). The other LEC subclusters do not show this change. Values based on scRNA-seq gene expression analysis of scLV-1 and scLV2 in a. c, Volcano plot showing 2,624 differentially expressed genes between adult and aged LECs. Positive values of Log2 fold change indicate genes upregulated in aged LECs, while negative values indicate genes with higher expression in adult LECs. Gray dots indicate genes with Log2 fold change absolute values less than 0.2, while green dots indicate genes with absolute values greater than 0.2. P values calculated by two-tailed MAST with Bonferroni post hoc test. d, Bar graphs showing five terms from Gene Ontology (GO) analysis of Nos3high collecting LEC indicating the largest enrichment of nitric oxide-related gene functions. GO enrichment was assessed using Enrichr. P values calculated using one-tailed Fisher’s exact test, with FDR correction using the Benjamini-Hochberg method. Complete dataset for the GO term analysis is presented in Supplementary Table 2. e, Violin plots showing greater expression of Nos3, Sod2, and Gch1 genes in LEC of aged mice but no detected expression of Nos1 and Nos2 genes in LEC of either younger adults or aged mice. P values calculated by two-tailed MAST with Bonferroni post hoc test. f-i, Uniform manifold approximation and projection (UMAP) plot of gene expression in mural cells from superficial cervical lymphatics showing four subclusters that are similar in younger adult (12 weeks, n = 321 cells analyzed) and aged (93 weeks, n = 529 cells analyzed) mice (f). Pie charts showing similar proportions of lymphatic smooth muscle cells (LSMC), vascular smooth muscle cells (VSMC), Dcnhigh pericytes, and Dcnlow pericytes in younger adults and aged mice (g). Bar graph comparing the percentage of LSMC relative to the number of collecting lymphatic endothelial cells (Apoe+Eng+Bgn+) from younger adult and aged mice (h). Number of differentially expressed genes between aged mice and younger adults in lymphatic endothelial cells (LEC), blood endothelial cells (BEC), LSMC, VSMC, and pericytes (i). j, Violin plots showing the absence of ageing-related gene expression differences in lymphatic smooth muscle cells of three smooth muscle markers (Acta2, Myh11, Tagln) and two downstream guanylate cyclases (Gucy1a1, Gucy1a2) of the nitric oxide pathway. P values calculated by two-tailed MAST with Bonferroni post hoc test.
Extended Data Fig. 11
Extended Data Fig. 11. Validation of scRNA-seq data with RNA in-situ hybridization and immunohistochemical staining of LEC clusters.
a, Uniform manifold approximation and projection (UMAP) plot showing expression of Xist, a female-specific non-coding RNA, in LEC clusters from 3 male and 3 female Prox1-GFP mice shown in Extended Data Fig. 10a. Equal distributions of Xist positive and Xist negative cells are consistent with the sample being representative. b,c, Representative RNA in-situ hybridization images and signal counts comparing Nos3 mRNA expression in superficial cervical lymphatics scLV-1 (white dashed lines) in whole mounts from adult (8 weeks) and aged (96 weeks) Prox1-GFP mice. Scale bars, 20 μm. In c, each dot is the value for one side of scLV-1 from one mouse. n = 6 mice (adult) and n = 5 mice (aged) from three independent experiments. Error bars indicate mean ± s.e.m. P values calculated by two-tailed Welch’s t-test. d,e, Confocal microscopic images and measurements of immunofluorescence staining for eNOS and phosphorylated-eNOS (phos-eNOS) in superficial cervical lymphatics scLV-1 in tissue whole mounts from adult (8 weeks) and aged (96 weeks) Prox1-GFP mice. Scale bars, 100 µm. Each dot is the value for one side of scLV-1 from one mouse. n = 7 (adult, eNOS), n = 6 (adult, Phos-eNOS) mice and n = 5 (aged, eNOS), n = 6 (aged, Phos-eNOS) mice from three independent experiments. Error bars indicate mean ± s.e.m. P values calculated by two-tailed Welch’s t-test. f,g, Confocal microscopic images of immunofluorescence staining (f) and uniform manifold approximation and projection (UMAP) plot (g) of FOXP2 expression in superficial cervical lymphatics scLV-1 (white dashed lines) in tissue whole mounts from adult (8 weeks) Prox1-GFP mice. Green dashed line boxes in f mark regions enlarged in the right three panels. Diverse features of FOXP2 expression in LEC are marked by colored arrowheads: red (Foxp2high LEC), pink (Foxp2low LEC), and yellow (Foxp2high LEC in valve). Scale bars, 50 μm. Representative of n = 3 mice from three independent experiments. FOXP2 immunofluorescence was variably strong in luminal LEC but consistently strong in valve LEC (f), which fits with the UMAP plot that shows two separate Foxp2high LEC clusters (g). h-k, Immunofluorescence images of whole mounts showing staining for Prox1-GFP and LYVE1 in initial lymphatics (with blunt ends, red arrowheads) and pre-collecting lymphatics (with valves, yellow arrowheads) of regional cervical lymphatics (h). White dashed line box marks the region enlarged in the left lower corner. Scale bar, 500 μm. Representative of n = 3 mice from three independent experiments. Immunofluorescence images of whole mounts showing Prox1-GFP in all lymphatics but not in a facial vein; αSMA staining of smooth muscle in a collecting lymphatic and facial vein but not in a pre-collecting lymphatic; and LYVE1 staining in a pre-collecting lymphatic (white arrowheads and dashed line outline) but not in the other vessels (i). Scale bar, 200 μm. Representative of n = 3 mice from three independent experiments. Dot plot graph showing superficial cervical collecting lymphatics that are larger in diameter than pre-collecting lymphatics in adult Prox1-GFP mice (j). Each dot is the value for one lymphangion from one side of cervical lymphatics. n = 6 mice from three independent experiments. Error bars indicate mean ± s.e.m. a.u., arbitrary unit. P values calculated by two-tailed Welch’s t-test. The immunofluorescence staining (h,i) fits with the strong Lyve1 mRNA expression restricted to the regional cervical (initial and pre-collecting) LEC cluster in the uniform manifold approximation and projection (UMAP) plot (k). Source Data
Extended Data Fig. 12
Extended Data Fig. 12. Differential effects of ageing on gene expression in five fibroblast subclusters associated with superficial cervical lymphatics.
a, Uniform manifold approximation and projection (UMAP) plots of single-cell gene expression (scRNA-seq) analysis identified five subclusters of fibroblasts in tissues around superficial cervical lymphatics from six adult (12 weeks) and six aged (93 weeks) Prox1-GFP mice. Arrowheads in plot of fibroblasts from aged mice mark subclusters that were rare in younger adult mice: magenta arrowhead marks the Postnhigh fibroblast subcluster, and pink arrowhead marks the Ptgfrhigh fibroblast subcluster. The total number of fibroblasts analyzed is 6,042 in adult mice and 12,034 in aged mice. b, Pie charts of the five fibroblast subclusters showing that Postnhigh (magenta) and Ptgfrhigh (pink) fibroblasts around superficial cervical lymphatics of aged mice were both 18 times the corresponding proportion in younger adults, but the other three fibroblast subclusters were similarly abundant at both ages. c, Gene ontology analysis of gene expression of fibroblasts around superior cervical lymphatics showing five gene ontology terms related to fibrosis that were significantly enriched in aged mice: collagen fibril organization, extracellular structure organization, external encapsulating structure organization, extracellular matrix organization, skin development. GO enrichment was assessed using Enrichr. P values calculated using one-tailed Fisher’s exact test, with FDR correction using the Benjamini-Hochberg method. Complete dataset for the GO term analysis is presented in Supplementary Table 3. d, Violin plots showing four examples of fibrosis- or inflammation-related genes in fibroblasts around superficial cervical lymphatics that had significantly greater expression in aged mice than in younger adults: Postn (periostin, osteoblast-specific factor 2), Tgfbi (transforming growth factor, beta-induced), Col1a1 (skin, tendon, bone collagen, type I, alpha-1 chain), and Nfkb1 (nuclear factor kappa-B, subunit 1). P values calculated by two-tailed MAST with Bonferroni post hoc test. e-g, Images comparing RNA in-situ hybridization of Postn mRNA expression in whole mounts of superficial cervical lymphatics (white dashed lines) in Prox1-GFP mice at age 8 weeks and 93 weeks and corresponding measurements (e,f). In the younger adult specimen, Prox1-GFP nuclei (green) are prominent, but in the aged adult specimen, fibroblasts with strong expression of postn mRNA (magenta) and DAPI-stained (blue) nuclei are distributed around the superficial cervical lymphatics (e). Scale bars, 20 μm. The dot plot (g) shows the relative expression levels of postn mRNA in fibroblasts, mural cells, and endothelial cells of blood vessels (BEC) and lymphatics (LEC), based on scRNA-seq data in Supplementary Fig. 14. Each dot (f) is the value for one scLV from n = 4 mice (younger adult) and n = 4 mice (aged) examined in three independent experiments. Error bars indicate mean ± s.e.m. P values calculated by two-tailed Welch’s t-test. h,i, Type 1 collagen immunofluorescence around the superficial cervical lymphatics and adjacent vein in whole mounts from adult (8 weeks) and aged (93 weeks) Prox1-GFP mice and corresponding measurements. Type 1 collagen staining (red arrowheads) is strongest in fibroblasts near the vein in the aged mouse but is less near the lymphatics and elsewhere (h). Veins (left of white dashed lines) are distinguished by the weak signal (blank arrowheads) of Prox1-GFP fluorescence. PDGFRα+ fibroblasts (blue). Scale bars, 100 μm. Measurements document greater type 1 collagen staining in the aged mice (i). Each dot is the value for one scLV. n = 5 mice (adult) and n = 5 mice (aged) from three independent experiments. Error bars indicate mean ± s.e.m. P values calculated by two-tailed Welch’s t-test. Source Data
Extended Data Fig. 13
Extended Data Fig. 13. Features and use of mechanical stimulator for increasing CSF drainage through superficial cervical lymphatics.
a, Drawing and photograph of the precision force-regulated mechano-stimulator consisting of an amplifier, force sensor, handle, shaft connecting the tip to the force sensor, and replaceable tip. The replaceable tip was an oval-shaped cotton ball, with a major axis of 1 cm and minor axis of 0.5 cm, that was attached to a 1-cm long rod securely connected to the shaft. The length of the handle was 9 cm. The force sensor made of silicone and conductive fabric was connected to the replaceable tip through the shaft. The measured force was transmitted to an amplifier connected to a personal computer. b, Graphs comparing low-magnitude (0.01-0.02 kgf) and high-magnitude (0.04-0.08 kgf) forces generated by the mechanical stimulator every 2 s over 20 s. c, Drawing (left) showing the three stimulation paths (numbered brown dashed arrows) in three regions of intact skin of mice along the course of superficial cervical lymphatics scLV-1 and scLV-2 to promote CSF flow toward the submandibular lymph node (smLN). Region 1 was from the periorbital area to the mandible. Region 2 was from the nasal sidewall to the mandible. Region 3 was along the paths of scLV-1 and scLV-2 to the submandibular lymph node. Each 1-min session of mechanical stimulation consisted of two sequences of 10 two-second strokes each, with a 20-sec rest period after the two sequences. Each sequence included four two-second strokes in Region 1, four in Region 2, and two in Region 3 (right). Source Data
Extended Data Fig. 14
Extended Data Fig. 14. Low-magnitude mechanical stimulation increases CSF outflow through superficial cervical lymphatics with sustained efficacy after 4 daily sessions.
a, Sequence of surgical exposure of superficial cervical lymphatics scLV-1 in Prox1-GFP mice, a 20-min stabilization period, and intravital imaging during and 5 min after 1-min of low-magnitude mechanical stimulation (LMMS) of the face and neck as in Extended Data Fig. 13. Measurements were made at 1-min intervals for 5 min after stimulation. b, Drawing showing the relative locations of region 3 of LMMS of scLV-1 and scLV-2 and the downstream window for intravital imaging (blue dashed box). c, Intravital images of scLV-1 of Prox1-GFP mouse downstream before and after one session of LMMS. White dashed lines outline the vessel border before LMMS. Red arrowheads mark regions of TMR-dextran fluorescence. Scale bars, 20 μm. Anatomical positions are indicated in the top left corner: A, anterior; P, posterior. d, Measurements of temporal changes in TMR-dextran fluorescence, as an index of CSF outflow, and five parameters of spontaneous contraction of scLV-1 at the onset and 1-5 min after a 1-min session of LMMS (MS). At 1-min, TMR-dextran values are more than double the onset and continue to be significantly greater throughout the 5-min monitoring period. Other values show a small increase in scLV-1 mean diameter and transient increase in amplitude of spontaneous contractions but no significant change in ejection fraction, contraction frequency, or fractional pump flow. All values are expressed as % of mean baseline fluorescence before LMMS. Each dot is the mean value for n = 9 (sham), n = 7 (LMMS) mice of both sexes from three independent experiments. Error bars indicate s.e.m. P values calculated by two-way repeated-measures ANOVA followed by Sidak’s multiple comparison test. e, Sequence of repeated low-magnitude mechanical stimulation (LMMS, 20 sessions/day) for 4 days followed on day 5 by surgical exposure and intravital imaging of superficial cervical lymphatic scLV-1 in adult (8–12 weeks) Prox1-GFP mice. Intravital imaging began after a 30-min stabilization period and lasted 3 min. f, Measurements show no difference between the sham and stimulated group in values for mean diameter, spontaneous contraction amplitude, ejection fraction, frequency, or fractional pump flow in scLV-1. Each dot is the value for one mouse. n = 9 (sham), n = 8 (LMMS) mice per group in three independent experiments. Error bars indicate mean ± s.e.m. a.u., arbitrary unit. Intravital imaging values were averaged over 3 min for each mouse. P values calculated by two-tailed Welch’s t test. g, Sequence of repeated LMMS (20 sessions/day) for 4 days followed by surgical exposure, intracisternal infusion of TMR-dextran, intravital imaging of scLV-1, low-magnitude mechanical stimulation (1 session) in adult Prox1-GFP mice, and measurement of TMR-dextran fluorescence in scLV-1 within the imaging window. Intravital imaging began after a 30-min stabilization period and lasted 5 min after LMMS (1 session) or sham. h, Comparison of three conditions showing significantly greater TMR-dextran fluorescence in scLV-1 in the repeated stimulation group than in the sham group. The magnitude of TMR-dextran fluorescence in the scLV-1 after repeated stimulation over 4 days did not differ from corresponding values after one stimulation session (data from Extended Data Fig. 14d). Each dot is the value for n = 9 (sham), n = 7 (1 session LMMS or repeated LMMS) mice of both sexes from three independent experiments. Error bars indicate mean ± s.e.m. a.u., arbitrary unit. P values calculated by two-way repeated-measures ANOVA. Source Data
Extended Data Fig. 15
Extended Data Fig. 15. Nitric oxide signaling contribution to increased CSF drainage by mechanical stimulation.
a, Sequence of intraperitoneal (i.p.) injection of PBS or l-NAME (1 mg/kg body weight) followed 120 min later by intravital imaging and measurements of superficial cervical lymphatic vessel scLV-1 of Prox1-GFP mice (8–12 weeks old). b, Intravital image showing scLV-1 of Prox1-GFP mouse at 120 min after treatment with PBS or l-NAME. Basal tone (smaller diameter) was greater after l-NAME. Scale bars, 30 μm. A, anterior; P, posterior anatomical position. Representative of n = 4-5 mice from three independent experiments. c, Comparison of effect of PBS or l-NAME on scLV-1 mean diameter, amplitude, frequency, ejection fraction, and fractional pump flow. Each dot is the value for one mouse. n = 5 (PBS), n = 4 (l-NAME) mice of both sexes per group from three independent experiments. Error bars indicate mean ± s.e.m. a.u., arbitrary unit. P values calculated by two-tailed Mann-Whitney U-test. d, Sequence of PBS or l-NAME injected intraperitoneally (i.p.) followed 90 min later by intracisternal (i.c.) infusion of 1.0 μl TMR-dextran over 1 min into adult Prox1-GFP mice followed by measurement of TMR-dextran fluorescence in the submandibular lymph node 30 min later. Low-magnitude mechanical stimulation was applied for 20 min beginning 10 min after the intracisternal infusion. e,f, Fluorescence images and measurements of TMR-dextran fluorescence in the submandibular lymph node 30 min after the intracisternal infusion and mechanical stimulation shown in d. Scale bars, 500 μm. Fluorescence in lymph node of PBS controls compared to l-NAME treatment without stimulation (sham) or after 20 low-magnitude stimulation sessions over 20 min beginning 10 min after TMR-dextran infusion. Each dot is the value for one mouse. n = 17 (PBS, sham), n = 14 (PBS, stimulated), n = 11 (l-NAME, sham), n = 9 (l-NAME, stimulated) mice per group from four independent experiments. Error bars indicate mean ± s.e.m. a.u., arbitrary unit. P values calculated by Brown-Forsythe ANOVA test followed by Dunnett’s T3 multiple comparison test. Source Data

Similar articles

References

    1. Key, A. & Retzius, G. Studien in der Anatomie des Nervensystems und des Bindegewebes: 1. Hälfte Vol. 1 (Samson & Wallin, 1875).
    1. Bradbury, M. W. B. & Cserr, H. F. Drainage of cerebral interstitial fluid and of cerebrospinal fluid into lymphatics. Exp. Biol. Lymph. Circ.9, 355–394 (1985).
    1. Cserr, H. F., Harling-Berg, C. J. & Knopf, P. M. Drainage of brain extracellular fluid into blood and deep cervical lymph and its immunological significance. Brain Pathol.2, 269–276 (1992). - PubMed
    1. Kida, S., Pantazis, A. & Weller, R. O. CSF drains directly from the subarachnoid space into nasal lymphatics in the rat. Anatomy, histology and immunological significance. Neuropathol. Appl. Neurobiol.19, 480–488 (1993). - PubMed
    1. Zakharov, A., Papaiconomou, C., Djenic, J., Midha, R. & Johnston, M. Lymphatic cerebrospinal fluid absorption pathways in neonatal sheep revealed by subarachnoid injection of Microfil. Neuropathol. Appl. Neurobiol.29, 563–573 (2003). - PubMed

MeSH terms