. 2025 Aug;644(8076):547-556.
doi: 10.1038/s41586-025-09125-5. Epub 2025 Jun 4.

Loss of colonic fidelity enables multilineage plasticity and metastasis

Affiliations

Loss of colonic fidelity enables multilineage plasticity and metastasis

Patrizia Cammareri et al. Nature. 2025 Aug.

Abstract

Cancer cell plasticity enables the acquisition of new phenotypic features and is implicated as a major driver of metastatic progression1,2. Metastasis occurs mostly in the absence of additional genetic alterations3-5, which suggests that epigenetic mechanisms are important6. However, they remain poorly defined. Here we identify the chromatin-remodelling enzyme ATRX as a key regulator of colonic lineage fidelity and metastasis in colorectal cancer. Atrx loss promotes tumour invasion and metastasis, concomitant with a loss of colonic epithelial identity and the emergence of highly plastic mesenchymal and squamous-like cell states. Combined analysis of chromatin accessibility and enhancer mapping identified impairment of activity of the colonic lineage-specifying transcription factor HNF4A as a key mediator of these observed phenotypes. We identify squamous-like cells in human patient samples and a squamous-like expression signature that correlates with aggressive disease and poor patient prognosis. Collectively, our study defines the epigenetic maintenance of colonic epithelial identity by ATRX and HNF4A as suppressors of lineage plasticity and metastasis in colorectal cancer.


Conflict of interest statement

Competing interests: The authors declare no competing interests.

Figures

Fig. 1
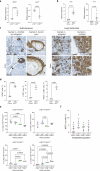
Fig. 1. Atrx loss promotes metastasis.
a, Representative images of lung metastases (stained with haematoxylin and eosin) from mice injected with AKP control or AKP AtrxKO organoids through the tail vein. Metastatic nodules are indicated with black arrowheads. b, Quantification of the number of lung metastases per mouse (n = 8 mice each). c, Quantification of total lung tumour burden per mouse (n = 8 mice each). d, Summary data indicating the presence or absence of lung metastases. The number of mice with or without lung metastases is indicated on the graph (n = 8 mice each). e, Representative images of liver metastases (stained with haematoxylin and eosin) from mice injected with AKP control or AKP AtrxKO organoids through intrasplenic injection. Metastatic nodules are indicated with black arrowheads. f, Quantification of the number of liver metastases per mouse (n = 8 mice each). g, Quantification of the total liver tumour burden per mouse (n = 8 mice each). h, Summary data indicating the presence or absence of liver metastases. The number of mice with or without liver metastases is indicated on the graph (n = 8 mice each). i, Fluorescence microscopy of calcein-stained AKP control and AKP AtrxKO organoids after treatment with 5 ng ml–1 TGFβ (TGFβ1). Spindle-like organoid structures are indicated with white arrowheads. Zoomed areas are outlined by the white boxes. j, Quantification of the percentage of AKP control and AKP AtrxKO organoids adopting a spindle-like morphology after TGFβ treatment (n = 7 (control) and 6 (KO) independent experiments). P  = 0.000027. k, RT–qPCR analysis of EMT markers in AKP control and AKP AtrxKO organoids untreated or treated with 5 ng ml–1 TGFβ (n = 3 independent experiments). Gene expression was normalized to Actb, and levels relative to untreated AKP control were calculated using the ΔΔCt method. Data are the mean ± s.d. (b,c,f,g,j,k). P values were calculated using two-tailed Mann–Whitney tests (b,c,f,g), two-sided Fisher’s exact tests (d,h), two-tailed Student’s t-tests (j) or ordinary one-way analysis of variance ANOVA with multiple comparisons (k). Scale bars, 2.5 mm (a,e) or 1,000 μm (i). Source Data
Fig. 2
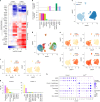
Fig. 2. Colonic epithelial identity is perturbed after Atrx loss.
a, Heatmap of RNA-seq data from AKP control and AKP AtrxKO organoids with or without TGFβ treatment. Representative genes marking colonic epithelial, squamous and mesenchymal lineages are shown. log2 fold change values relative to untreated AKP control organoids are indicated by the colour intensity. Genes of multiple lineages co-expressed in AKP AtrxKO organoids are highlighted as ‘hybrid phenotype’. b, TissueEnrich analysis of genes upregulated and downregulated in AKP AtrxKO organoids compared with AKP controls. Dashed line indicates P = 0.05. c, UMAP plot of AKP control (23,579 cells) and AKP AtrxKO (25,757 cells) single cells coloured by genotype. d, UMAP plot coloured and numbered by cluster in AKP control and AKP AtrxKO single cells. e, UMAP plots coloured by the expression of genes used for defining colonic differentiation and EMT in AKP control and AKP AtrxKO single cells. Colour scale indicates expression levels. f, UMAP plot coloured by the expression of genes used for defining squamous differentiation in AKP control and AKP AtrxKO single cells. Colour scale indicates expression levels. g, TissueEnrich analyses of genes enriched in single-cell RNA-seq clusters 4 and 15. Dashed line indicates P = 0.05. h, Dot plot of signature scores across all clusters coloured by the average expression and sized by the percentage of cells expressing the signature. Cluster 4 oesophagus and cluster 15 skin signatures are derived from TissueEnrich analyses. Significance was calculated using hypergeometric tests (one-sided) with Benjamini–Hochberg multiple-testing correction (b,g).
Fig. 3
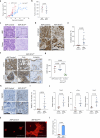
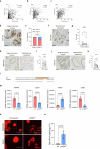
Fig. 3. Atrx loss induces squamous-like plasticity.
a, FACS plots for analysing and sorting EPCAM+LY6D+ cells from AKP control and AKP AtrxKO organoids. b, Quantification of the percentage of cells in each EPCAM and LY6D population (n = 3 independent experiments each). c, Quantification of the percentage of LY6D+ cells in AKP control and AKP AtrxKO organoids (n = 3 independent experiments each). P = 0.000019. d, RT–qPCR analysis of squamous cell markers in LY6D and LY6D+ cells sorted from AKP AtrxKO organoids (n = 3 independent experiments each). Gene expression was normalized to Actb, and levels relative to LY6D cells were calculated using the ΔΔCt method. e, Representative images of KRT5-stained subcutaneous tumours and lung metastases from mice injected with AKP control or AKP AtrxKO organoids. f, Quantification of the percentage of KRT5+ cells in subcutaneous tumours from mice injected with AKP control or AKP AtrxKO organoids (n = 5 mice each). g, Quantification of the percentage of KRT5+ cells in subcutaneous tumours and lung metastases from mice injected with AKP AtrxKO organoid cells (n = 5 (subcutaneous) and 6 (lung metastasis) mice). h, Representative images of EPCAM and KRT5 co-immunofluorescence in AKP AtrxKO subcutaneous tumours. White arrows indicate cells exclusively expressing EPCAM (in EPCAM only panel, magenta), KRT5 (in KRT5 only panel, green) or co-expressing EPCAM and KRT5 (merge). n = 3 biologically independent samples. i, FACS plots for analysing and sorting LY6D+ITGA5+ cells from AKP control and AKP AtrxKO organoids. j, Quantification of the percentage of cells in each LY6D and ITGA5 population (n = 3 independent experiments each). k, Schematic of the strategy used to determine the plasticity of different ITGA5 and LY6D expressing cell populations in AKP AtrxKO organoids. l, Quantification of the percentage of cells in each LY6D and ITGA5 population 9 days after plating. The original plated population is noted on the x axis (n = 4 independent experiments each). m, Representative images of KRT5-stained subcutaneous tumours from mice injected with different LY6D and ITGA5 populations derived from AKP AtrxKO organoid cells. The population transplanted is indicated above each image (n = 5 mice each). Scale bars, 50 µm. Data are the mean ± s.d. (c,d,f,g). P values were calculated using two-tailed Student’s t-test (c,d) or two-tailed Mann–Whitney test (f,g). Scale bars, 50 µm (e,h,m). The schematic in k was created using BioRender (https://biorender.com). Source Data
Fig. 4
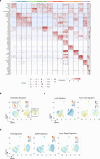
Fig. 4. HNF4A activity maintains colonic epithelial identity.
a, DiffTF analysis of combined ATAC–seq and RNA-seq data with selected TFs highlighted. Shaded areas indicate gain (red) or loss (blue) of TF activity in AKP AtrxKO organoids compared with AKP controls. TFs highlighted in green are associated with transcriptional activation and in red with transcriptional repression. b, Volcano plot of H3K27ac CUT&RUN data in AKP control and AKP AtrxKO organoids. Each data point represents a H3K27ac binding peak. Significantly altered sites (false discovery rate (FDR) ≤ 0.05) are highlighted in pink. c, Table outlining the overlap between ATAC–seq accessibility changes and altered H3K27ac peaks in AKP control and AKP AtrxKO organoids. H3K27ac losses are mostly associated with reduced chromatin accessibility. d, Representative Integrative Genomics Viewer (IGV) browser tracks of AKP control and AKP AtrxKO ATAC–seq accessibility and H3K27ac CUT&RUN data. Cdx1 and Hnf4a gene loci are shown. Regions shaded grey have significant loss of chromatin accessibility and corresponding depletion of H3K27ac. e, Table outlining the overlap between RNA-seq gene expression changes in AKP AtrxKO and AKP Hnf4aKO organoids. f, Fluorescence microscopy of phalloidin-stained AKP control or AKP Hnf4aKO organoids after treatment with TGFβ (5 ng ml–1). Scale bars, 400 μm. g, Quantification of the percentage of AKP control and AKP Hnf4aKO organoids adopting a spindle-like morphology after TGFβ treatment (n = 3 independent experiments each). h, Representative IHC images of β-catenin-stained subcutaneous tumours from mice injected with AKP control or AKP Hnf4aKO organoid cells (n = 5 mice each). β-catenin staining is used to identify tumour cells. Scale bars, 100 µm (overview) and 50 μm (zoom). For a, two-sided P values for each transcription factor was calculated with Welch two-sample t-tests using the bootstrap approach. Adjusted P values were calculated using the Benjamini–Hochberg method for multiple-testing correction. For g, data are mean ± s.d., and P values were calculated using two-tailed Student’s t-tests.
Fig. 5
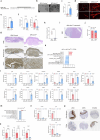
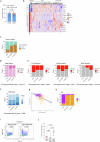
Fig. 5. Squamous-like gene expression predicts aggressive disease and poor patient outcome.
a, Representative IHC staining of a human CRC TMA for ATRX, HNF4A, CDX2 and LY6D. Examples of positive and negative staining are shown. Scale bar, 100 µm. b, Quantification of ATRX, HNF4A and CDX2 histoscore (H-score) values in LY6D (<2% cells LY6D+) and LY6D+ (>2% cells LY6D+) tumour cores. n = 500 (ATRX, HNF4A) and 509 (CDX2) biologically independent samples. c, Representative IHC image of a LY6D-stained human stage IV primary tumour. Scale bars, 50 µm. d, Summary data indicating the percentage of human primary tumours at stages I–III versus stage IV positive for LY6D. The percentages are based on >2% cells LY6D+ and <2% cells LY6D. P = 0.000027. e, Representative IHC image of LY6D-stained human liver metastasis. Scale bars, 100 µm. f, Summary data indicating the percentage of LY6D+ cells in matched human primary tumours and liver metastases. n = 17 biologically independent matched samples (7 data points are visible as 11 primary tumour samples have the same value (0) and are overlapping). g, UMAP plot of Juanito scRNA-seq dataset overlayed with iCMS designation. For comparison, AtrxKO, AtrxWT and AtrxKO/AtrxWT transcriptional expression scores are overlayed in the same data. h, Survival plot of Marisa CRC patient dataset separated on Atrx-based gene expression clusters. i, Volcano plot of HOMER TF enrichment analysis of TFs with differential motif accessibilities between HiSquam and HiCol signature tumours. Selected TF motifs in regions with reduced accessibility in HiSquam tumours highlighted in blue and TF motifs in regions with increased accessibility in HiSquam tumours highlighted in red. Data are the mean ± s.d. (b). P values were calculated using two-tailed Mann–Whitney tests (b), two-sided Fisher’s exact tests (d), two-tailed Wilcoxon matched-pairs signed-rank tests (f), log-rank (Mantel–Cox) tests (h) or two-sided Fisher’s exact test and adjusted for multiple comparisons with the Benjamini–Yekutieli method (i). NS, not significant.
Extended Data Fig. 1
Extended Data Fig. 1. Loss of ATRX expression is associated with metastasis.
(a) International Cancer Genome Consortium data of top 20 mutated cancer genes with high functional impact mutations in colorectal cancer (CRC). (b) Representative ATRX staining of human normal and CRC tissue microarray. Examples of positive and negative staining are shown. Scale bars, 500 µm. (c) Quantification of ATRX expression using immunohistochemistry H-score method analysed using QuPath. Samples are separated into normal, non-metastatic (stage I and II) and metastatic (stage III and IV) groups, n = 8 vs 47 vs 25 tumours. (d) Summary data indicating presence (H-score > 10) or absence (H-score <10) of ATRX staining in non-metastatic and metastatic samples. Number of tumours in each group indicated on graph, n = 47 vs 25 tumours. (e) Summary data indicating presence or absence of ATRX mutation in CRIS-B vs all other CRIS transcriptional subtypes. Data extracted from TCGA dataset where CRIS tumour annotation is known. Number of tumours in each group indicated on graph, n = 43 vs 278 tumours. (f) Overall survival data of patients with CRIS-B tumours separated on presence or absence of ATRX mutation. Data extracted from TCGA dataset, n = 37 vs 6 patients. For (c) data are mean ± SD. P values were calculated using ordinary one-way ANOVA with multiple comparisons. For (d) and (e) p values were calculated using two-sided Fisher’s exact test. For (f) P value was calculated using Log-rank (Mantel-Cox) test. (g) Lollipop plot of TCGA PanCancer mutational data for ATRX. ATRX mutations were analysed using cBioPortal (07/12/23) with TCGA PanCancer Atlas Studies selected. (h) Western-blot analysis of AKP ATRXKO organoids for ATRX and β-actin. n = 2 technical replicates. (i) Representative images of haematoxylin and eosin (H&E) stained lung metastases in mice injected with AKP Control or AKP AtrxKO2 organoid cells via tail vein. Scale bars, 500 µm. (j) Quantification of number of lung metastases per mouse, n = 7 vs 8 mice. (k) Quantification of total lung tumour burden per mouse, n = 7 vs 8 mice. (l) Summary data indicating presence or absence of lung metastases. Number of mice with lung metastases or no metastases indicated on graph, n = 7 vs 8 mice. For (j) and (k) data are mean ± SD. P values were calculated using two-tailed Mann-Whitney test. For (l) p value was calculated using two-sided Fisher’s exact test. Source Data
Extended Data Fig. 2
Extended Data Fig. 2. Atrx deletion leads to tumour invasion.
(a) Subcutaneous tumour volume growth of mice injected with AKP Control or AKP AtrxKO organoid cells. (b) Volumes of tumours generated via subcutaneous injection of AKP Control or AKP AtrxKO, n = 5 vs 5 tumours. (c) Representative images of H&E-stained subcutaneous tumours in mice subcutaneously injected with AKP Control or AKP AtrxKO organoid cells. Scale bars, 100 μm overview and 50 μm zoom. (d) Representative images of β-catenin-stained subcutaneous tumours in mice subcutaneously injected with AKP Control or AKP AtrxKO organoid cells. β-catenin staining is used to identify tumour cells. Black arrows indicate β-catenin positive tumour cells invading into surrounding stroma. Scale bars, 100 μm overview and 50 μm zoom. (e) Quantification of invasive area of AKP Control vs AKP AtrxKO tumours, n = 5 vs 5 tumours. (f) Representative images of CDH1 stained subcutaneous tumours in mice subcutaneously injected with AKP Control or AKP AtrxKO organoid cells. Tumour core and invasive region of AKP AtrxKO tumour shown. Scale bars, 100 μm overview and 50 μm zoom. (g) Quantification of CDH1 staining intensity (H-score analysed with QuPath) in AKP Control vs AKP AtrxKO tumours, n = 5 vs 5 tumours. (h) Representative images of TWIST1 stained subcutaneous tumours in mice subcutaneously injected with AKP Control or AKP AtrxKO organoid cells. Scale bars, 100 μm overview and 50 μm zoom. (i) Quantification of TWIST1 staining in AKP Control vs AKP AtrxKO tumours, n = 5 vs 5 tumours. (j) RT-qPCR analysis of EMT marker expression in AKP Control vs AKP AtrxKO tumours, n = 5 vs 5 tumours. For (b), (e) and (i) data are mean ± SD. P values were calculated using two-tailed Mann-Whitney test. For (g) data are mean ± SD. P values were calculated using ordinary one-way ANOVA with multiple comparisons. For (j) gene expression was normalised to Actb and levels relative to AKP Control tumours calculated using the ΔΔCt method. Data are mean ± SD. P values were calculated using two-tailed student’s ttest. (k) Fluorescence microscopy of phalloidin stained AKP Control and AKP AtrxKO2 organoids following treatment with 5 ng/ml TGF-beta. Scale bars, 200 μm. (l) Quantification of the percentage of AKP Control vs AKP AtrxKO2 organoids adopting spindle-like morphology following TGF-beta treatment, n = 3 vs 3 independent experiments. Data are mean ± SD. P value was calculated using two-tailed student’s ttest. Source Data
Extended Data Fig. 3
Extended Data Fig. 3. Deletion of Atrx promotes metastasis.
(a) Fluorescence microscopy of phalloidin stained AKP Control and AKP AtrxKO organoids following concentration gradient of TGF-beta (TGFβ). Scale bars, 400 μm. (b) Quantification of the percentage of AKP Control vs AKP AtrxKO organoids adopting spindle-like morphology following TGF-beta gradient treatment, n = 3 vs 3 independent experiments. Data are mean ± SD. P values were calculated using ordinary two-way ANOVA with Sidak’s multiple comparisons. (c) Representative images of AKP Control and AKP AtrxKO organoids treated with TNFα (0.5 ng/mL), IFNγ (0.25 ng/mL) or control for 8 days, n = 3 vs 3 independent experiments. (d) Representative images of AKP Control and AKP AtrxKO treated with JQ1 (250 nm), FK228 (10 nM) or control for 8 days. n = 3 vs 3 independent experiments. (e) Relative cell viability following JQ1 or FK228 treatment in AKP Control vs AKP AtrxKO organoids, n = 3 vs 3 independent experiments. Data are mean ± SD. P values (DMSO vs JQ1 AKP control (p = 0.00000043), DMSO vs JQ1 AKP ATRX (p = 0.00000037). DMSO vs FK228 AKP control (p = 0.00000003), DMSO vs FK228 AKP ATRX (p = 0.00000003) were calculated using ordinary two-way ANOVA with multiple comparisons. (f) Cartoon illustrating organoids orthotopic colonic injection. Created with BioRender. (g) Representative colonoscopy images of mice orthotopically transplanted with AKP Control or AKP AtrxKO organoids, 7-weeks post transplantation, n = 9 vs 10 mice. (h) Survival plot for mice orthotopically transplanted with AKP Control or AKP AtrxKO aged until clinical end-points. (i) Total tumour area of primary tumours per mouse of the shown genotypes, n = 8 vs 9 mice. (j) Summary data indicating absence, presence, and site of metastases per genotype. Number of mice with metastases or no metastases indicated on graph, n = 9 vs 10 mice. (k) Representative images of H&E-stained primary tumours and liver metastasis in mice orthotopically transplanted with AKP Control and AKP AtrxKO organoid cells. n = 9 vs 10 biologically independent samples. Scale bars, 1 mm for primary tumours and 500 µm for liver metastasis. (l) Representative β-catenin-stained images of primary tumours in mice orthotopically transplanted with AKP Control or AKP AtrxKO organoids. β-catenin is used to identify tumour cells. Magnification highlights the distinct morphological features. Scale bars, 100 µm overview, 50 µm zoom. (m) Quantification of glandular morphology areas of AKP Control vs AKP AtrxKO primary tumours, n = 9 vs 10 mice. For (h) p value was calculated using Long-rank (Mantel-Cox) test. For (i) and (m) data are mean ± SD. P values were calculated using two-tailed Mann-Whitney test. For (j) p value is calculated using Fisher’s exact test. Source Data
Extended Data Fig. 4
Extended Data Fig. 4. Atrx deletion in BPN model results in tumour invasion.
(a) Targeted DNA sequencing of targeted Atrx locus in BPN AtrxKO organoid lines. (b) Representative pictures of BPN Control and BPN AtrxKO organoid culture. Scale bars, 1000 µm. (c) RT-qPCR analysis of the EMT marker Twist1 in BPN Control vs BPN AtrxKO organoid culture, n = 3 vs 3 independent experiments. (d) Fluorescence microscopy of phalloidin stained BPN Control and BPN AtrxKO organoids following treatment with 5 ng/ml TGF-beta. Zoomed area outlined in white box. Scale bars, 400 μm overview and 200 μm zoom. (e) Average number of clusters of BPN Control and BPN AtrxKO organoids per well exhibiting a spindle-like morphology following TGF-beta treatment, n = 5 vs 4 independent experiments. (f) RT-qPCR analysis of EMT and epithelial marker expression in BPN AtrxKO organoids either untreated or treated with 5 ng/ml TGF-beta, n = 3 vs 3 independent experiments. (g) Representative H&E and β-catenin-stained images of primary tumours in mice orthotopically transplanted with BPN Control or BPN AtrxKO organoid cells. β-catenin is used to identify tumour cells. Magnification highlights the distinct morphological features. Scale bars, 1 mm overview and 100 µm zoom, n = 6 vs 8 mice. (h) Quantification of tumour areas with glandular morphology in BPN Control and BPN AtrxKO primary tumours, n = 6 vs 8 mice. (i) Representative H&E-stained image of BPN AtrxKO metastasis. Scale bars, 1 mm. (j) Summary data indicating presence or absence of metastases. Number of mice with metastases or no metastases indicated on graph, n = 6 vs 8 mice. For (c) and (f) gene expression was normalised to Actb and relative levels were calculated using the ΔΔCt method. Data are mean ± SD. For (c), (e) and (f) p values were calculated using two-tailed student’s ttest. For (e) p = 0.000023. For (h) p value was calculated using two-tailed Mann-Whitney test. (k) Normalised enrichment scores of significantly enriched gene sets in TGF-beta treated AKP Control vs AKP AtrxKO organoids. (l) RT-qPCR analysis of representative EMT markers induced in AKP AtrxKO organoids following treatment with TGF-beta, n = 3 vs 3 independent experiments. (m) Normalised enrichment scores of significantly enriched gene sets in untreated AKP Control vs AKP AtrxKO organoids. (n) RT-qPCR analysis of representative genes important for colonic lineage specification and function, n = 3 vs 3 independent experiments. (o) RT-qPCR analysis of representative genes important for colonic lineage specification and function in BPN Control vs BPN AtrxKO organoids, n = 3 vs 3 independent experiments. For (l) gene expression was normalised to 18S rRNA and levels relative to untreated AKP control organoids calculated using the ΔΔCt method. For Twist1, Irx2 and Tfap2c gene expression was normalised to Actb and levels relative to untreated AKP control organoids calculated using the ΔΔCt method. For (n) gene expression was normalised to Actb and levels relative to untreated AKP Control organoids calculated using the ΔΔCt method. For (o) gene expression was normalised to Actb and levels relative to BPN Control organoids calculated using the ΔΔCt method. For (l) and (n) data are mean ± SD. P values were calculated using ordinary one-way ANOVA with multiple comparisons. For (l) Fgf2 p = 0.00000006, Serpine2 p = 0.000006, Col1a1 p = 0.000005, Col6a1 p = 0.000045, Col6a2 p = 0.000004, Pcolce p = 0.000015, Twist1 control p = 0.00000026, Twist1 + TGFβ1 p = 0.00000004. For (n) Hnf4a control p = 0.00000001, Cdx1 control p = 0.000000000000051, Cftr control p = 0.00000008. For (o) data are mean ± SD. P values were calculated using two-tailed student’s ttest. (p) Representative images of LY6D, KRT5 and EPCAM stained oesophagus and colon from Human Protein Atlas (Human Protein Atlas proteinatlas.org). Source Data
Extended Data Fig. 5
Extended Data Fig. 5. scRNAseq of AKP vs AKP AtrxKO organoids.
(a) Heatmap of single-cell RNAseq analysis showing the top 5 differentially expressed genes per cluster in AKP Control and AKP AtrxKO organoids. (b) UMAP plot of AKP Control and AKP AtrxKO cells coloured by expression levels of the osteoblast signature. The zoomed area of cluster 13 and 15 are outlined in black boxes. (c) UMAP plots of AKP Control and AKP AtrxKO cells coloured by expression levels of the Lgr5 and tumour intestinal stem cells (ISC) signatures. (d) UMAP plots of AKP Control and AKP AtrxKO cells coloured by expression levels of the Fetal, Epithelial-Specific High-Risk (EpiHR) or Injury Repair signatures.
Extended Data Fig. 6
Extended Data Fig. 6. Atrx deletion results in hybrid-EMT phenotype.
(a) Representative images of CDH1/TWIST1 co-immunofluorescence in AKP Control vs AKP AtrxKO organoids. n = 1 biological sample examined over three independent experiments. Scale bars, 100 µm. (b) FACS plots for analysing and sorting EPCAM+ve/ITGA5+ve cells from AKP Control or AKP AtrxKO organoids. (c) Quantification of percentage of cells in each EPCAM/ITGA5 population, n = 5 vs 5 independent experiments. (d) Quantification of percentage of ITGA5+ve cells in AKP Control vs AKP AtrxKO organoids, n = 5 vs 5 independent experiments. (e) Quantification of percentage of EPCAM+ve cells in AKP Control vs AKP AtrxKO organoids, n = 5 vs 5 independent experiments. (f) Fluorescence microscopy of phalloidin stained ITGA5+ve and ITGA5-ve cells sorted from AKP Control or AKP AtrxKO organoids following treatment with 5 ng/ml TGF-beta, n = 3 vs 3 independent experiments. Spindle-like structures indicated with white arrows. Scale bars, 1000 μm. Zoomed area outlined in white box. (g) Quantification of presence of spindle-like organoid structures formed following treatment of ITGA5+ve and ITGA5-ve cells sorted from AKP Control or AKP AtrxKO organoids with 5 ng/ml TGF-beta, n = 3 vs 3 independent experiments. (h) RT-qPCR analysis of Itga5 expression in ITGA5+ve vs ITGA5-ve cells sorted from AKP AtrxKO organoids, n = 3 vs 3 independent experiments. (i) RT-qPCR analysis of various mesenchymal marker gene expression in ITGA5+ve vs ITGA5-ve cells sorted from AKP AtrxKO organoids, n = 3 vs 3 independent experiments. (j) RT-qPCR analysis of various colonic epithelial marker gene expression in ITGA5+ve vs ITGA5-ve cells sorted from AKP AtrxKO organoids, n = 3 vs 3 independent experiments. For (d) and (e) data are mean ± SD. P values were calculated using two-tailed student’s ttest. For (d) p = 0.000032. For (g) data are mean ± SD. P values were calculated using two-way ANOVA with Sidak’s multiple comparisons test. For (h) gene expression was normalised to Actb and levels relative to ITGA5-ve cells calculated using the ΔΔCt method. Data are mean ± SD. P value was calculated using two-tailed student’s ttest. For (i) and (j) gene expression was normalised to Actb and levels relative to ITGA5-ve cells calculated using the ΔΔCt method. Data are mean ± SD. P values were calculated using two-way ANOVA with Sidak’s multiple comparisons test. For (i) Twist1 p = 0.00000006, Col16a1 p = 0.00000003, Snai1 p = 0.00000012.
Extended Data Fig. 7
Extended Data Fig. 7. Emergence of squamous-like cells following Atrx deletion.
(a) RT-qPCR analysis of Emp1 and Lgr5 expression in LY6D+ve vs LY6D-ve cells sorted from AKP AtrxKO organoids, n = 3 vs 3 independent experiments. (b) RT-qPCR analysis of squamous markers Ly6d and Krt5 expression in tumours from mice injected with AKP Control or AKP AtrxKO organoids, n = 5 vs 5 tumours. (c) Representative images of KRT5 staining of AKP AtrxKO subcutaneous tumours (left) and lung metastases (right). Examples of the different morphologies of KRT5+ cells observed in these tumours are shown. In subcutaneous example 1, stratified epithelium (indicated by a black *) and elongated cells (indicated by black arrow) are shown. In subcutaneous tumour example 2 a keratin pearl is shown. In lung metastasis example 1 elongated cells are shown (indicated by black arrows). In lung metastasis example 2 stratified regions are shown. (d) Quantification of percentage of ITGA5+ve single positive, LY6D+ve single positive, and ITGA5+ve/LY6D+ve double positive cells in AKP Control vs AKP AtrxKO organoids, n = 3 vs 3 independent experiments. For (a) gene expression was normalised to Actb and levels relative to LY6D-ve cells calculated using the ΔΔCt method. Data are mean ± SD. P values were calculated using two-tailed student’s ttest. For (b) gene expression was normalised to Actb and levels relative to AKP Control tumours calculated using the ΔΔCt method. Data are mean ± SD. P values were calculated using two-tailed student’s ttest. For Ly6d p = 0.00005. For (d) data are mean ± SD. P values were calculated using two-tailed student’s ttest. For ITGA5+ cells (left panel) p = 0.000044. (e) Quantification of percentage of ITGA5-ve/LY6D-ve double negative, LY6D+ve single positive, ITGA5+ve single positive, and ITGA5+ve / LY6D+ve double positive cells in cultures of AKP AtrxKO organoids 9 days after plating of different sorted populations. The plated population is indicated on the x-axis and the population being analysed indicated in the graph title and y-axis, n = 4 vs 4 independent experiments. (f) Quantification of percentage of KRT5+ cells in tumours derived from mice injected with ITGA5-ve/LY6D-ve double negative, LY6D+ve single positive, ITGA5+ve single positive, or ITGA5+ve / LY6D+ve double positive AKP AtrxKO cells, n = 5 vs 5 mice. For (e) and (f) data are mean ± SD. P values were calculated using one-way ANOVA with multiple comparisons test. Source Data
Extended Data Fig. 8
Extended Data Fig. 8. Tgfbr2 deletion suppresses plasticity in AtrxKO organoids.
(a) Representative images of AKP Control and AKP AtrxKO cells treated or untreated with 5 ng/ml TGF-beta (TGFβ) for 72 h, n = 3 vs 3 independent experiments. Scale bars, 200 μm. (b) Relative cell viability of AKP Control vs AKP AtrxKO single cells treated or untreated with TGF-beta, n = 3 vs 3 independent experiments. (c) Targeted DNA sequencing of targeted Tgfbr2 locus in AKP AtrxKO organoid lines. (d) RT-qPCR analysis of representative genes important for squamous, EMT and colonic lineage specification and function in AKP Control, AKP AtrxKO Control and AKP AtrxKO Tgfbr2KO organoids. (e) FACS plots for analysing LY6D+ve/ITGA5+ve cells from AKP AtrxKO Control and AKP AtrxKO Tgfbr2KO organoids, n = 3 vs 3 independent experiments. (f) Quantification of percentage of cells in each LY6D / ITGA5 population, n = 3 vs 3 independent experiments. (g) Fluorescence microscopy of phalloidin stained AKP AtrxKO Control and AKP AtrxKO Tgfbr2KO organoids following treatment with 5 ng/ml TGF-beta, n = 3 vs 3 independent experiments. Scale bars, 200 μm. (h) Quantification of presence of spindle -like organoid structures formed following treatment of AKP AtrxKO Control and AKP AtrxKO Tgfbr2KO organoids with 5 ng/ml TGF-beta, n = 3 vs 3 independent experiments. For (b) data are presented as mean values ± SD. P values were calculated using one-sided ANOVA multiple comparisons test. For (d) n = 1 biologically independent sample examined over 3 independent experiments. Gene expression was normalised to Actb and levels relative to AKP Control calculated using the ΔΔCt method. Data are mean ± SD. P values were calculated using one-sided ANOVA multiple comparisons test. For (h) p value was calculated using two-tailed student’s ttest.
Extended Data Fig. 9
Extended Data Fig. 9. HNF4A mediates Atrx loss phenotypes.
a) PCA plot of ATAC-seq data comparing AKP Control vs AKP AtrxKO organoids, n = 3 vs 3 independent experiments. (b) Representative IGV browser tracks of ATAC peaks at colonic epithelial genes. Significantly altered peaks are outlined with a red box. Blue track refers to AKP control, while red track refers to AKP AtrxKO organoids. (c) Representative IGV browser tracks of ATAC peaks at mesenchymal genes. Significantly altered peaks are outlined with a red box. Blue track refers to AKP control, while red track refers to AKP AtrxKO organoids. (d) Representative IGV browser tracks of ATAC peaks at squamous genes. Significantly altered peaks are outlined with a red box. Note lack of significantly different peaks at Krt5 and Ly6d despite altered expression. Blue track refers to AKP control, while red track refers to AKP AtrxKO organoids. (e) Heatmap showing transcription factor binding sites enriched in regions that lose accessibility in AKP AtrxKO organoids. Brown shade gradient indicates regions where accessibility is lost in AKP AtrxKO organoids. (f) PCA plot of H3K27ac CUT&RUN comparing AKP Control vs AKP AtrxKO organoids, n = 3 vs 3 independent experiments. (g) RT-qPCR analysis of colonic epithelial cell marker expression in AKP Control, AKP AtrxKO and AKP AtrxKO Hnf4a overexpressing organoids, n = 3 vs 3 independent experiments. (h) RT-qPCR analysis of Hnf4α in AKP Control vs AKP Hnf4aKO organoids, n = 3 vs 3 independent experiments (i) Western-blot analysis of AKP Control and AKP Hnf4aKO organoids for HNF4A and β-actin. n = 4 vs 4 technical replicates. (j) Volcano plot depicting differentially expressed genes in AKP Control vs AKP Hnf4a KO organoids following RNAseq analysis. Red dots represent genes expressed at higher levels in the AKP Hnf4a KO organoids, while blue dots represent genes expressed at higher levels in the AKP Control, n = 3 vs 3 technical replicates. (k) Representative H&E images of subcutaneous tumours in mice subcutaneously injected with AKP Control or AKP Hnf4aKO organoid cells, n = 5 vs 5 mice. Magnification highlights the distinct morphological features. Scale bars, 1 mm overview and 250 µm zoom. (l) Quantification of non-glandular morphology area of AKP Control vs AKP Hnf4aKO subcutaneous tumours, n = 5 vs 5 mice. For (e) p values were calculated using one-sided Fisher’s exact test. For (g) and (h) gene expression was normalised to Actb and levels relative to AKP Control calculated using the ΔΔCt method. Data are mean ± SD. For (g) p values were calculated using one-way ANOVA with multiple comparisons test. For (h) p value was calculated using two-tailed student’s ttest. For (l) data are mean ± SD. P values were calculated using two-sided Mann-Whitney test. Source Data
Extended Data Fig. 10
Extended Data Fig. 10. Squamous-like plasticity observed in stage IV CRC samples.
(a) Scatter plot of individual tumour H-score values for HNF4A and ATRX of stained human CRC tissue microarray. (b) Scatter plot of individual tumour H-score values for CDX2 and ATRX of stained human CRC tissue microarray. (c) Scatter plot of individual tumour H-score values for CDX2 and HNF4A of stained human CRC tissue microarray. For (a), (b) and (c) samples staining positive for LY6D ( > 2% cells LY6D+ve) highlighted in red. Data is individual value X/Y scatter plot. P values were calculated using two-sided Pearson’s correlation test. For (a) p < 0.000000000000001, (b) p = 0.0000000009, (c) p < 0.000000000000001. (d) Representative IHC staining of a human primary stage IV CRC tissue microarray for KRT5. (e) Summary data indicating the presence of KRT5 positive cells (>2% cells KRT5+ve) in human stage I-III vs stage IV primary CRC. (f) Representative IHC staining of a human matched liver metastasis tissue microarray for KRT5 expression. (g) Summary data indicating the percentage of KRT5 positive cells in matched human primary tumours and liver metastases. (h) Representative image of HNF4A IHC staining in matched human stage IV primary tumour and matched liver metastasis. Scale bars, 100 µm. (i) Summary data indicating the percentage of HNF4A positive cells in matched human primary tumours and liver metastases. (j) Representative image of ATRX IHC staining in matched human stage IV primary tumour and liver metastasis. Scale bars, 100 µm. (k) Summary data indicating the percentage of ATRX positive cells in matched human primary tumours and liver metastasis. For (e) p value was calculated using two-sided Fisher’s exact test. For (g), (i) and (k) p values were calculated using two-tailed Wilcoxon matched-pairs signed rank test. n = 17 vs 17 matched human primary stage IV tumours and liver metastases. (l) Targeted DNA sequencing of targeted ATRX locus in human CRC organoid line. (m) RT-qPCR analysis of colonic epithelial and squamous marker gene expression in human ATRXKO CRC organoids and control (NT), n = 3 vs 3 independent experiments. (n) Fluorescence microscopy of phalloidin stained human control (NT) and ATRXKO CRC organoids following treatment with 5 ng/ml TGF-beta, n = 3 vs 3 independent experiments. Zoomed area outlined in white box. Scale bars, 400 μm overview, 200 μm zoom. (o) Quantification of the percentage of human control (NT) and ATRXKO CRC organoids adopting spindle-like morphology following TGF-beta treatment. For (m) gene expression was normalised to ACTB. For (m) and (o) n = 1 biologically independent sample examined over 3 independent experiments. Data are mean ± SD. P values were calculated using two-tailed student’s ttest.
Extended Data Fig. 11
Extended Data Fig. 11. ATRX mutation correlates with iCMS3 transcriptional subtype.
(a) Summary data indicating presence or absence of ATRX mutation in iCMS2 vs iCMS3 transcriptional subtypes. Data extracted from TCGA dataset. Number of tumours in each group indicated on graph, n = 348 vs 244 tumours. (b) Heatmap clustering of Marisa CRC patient dataset of 557 tumours based on squamous-like (AtrxKO) and colonic epithelial (AtrxWT) gene expression signatures. (c) Percentage of tumours located in the distal (left sided) or proximal (right sided) colon in different Atrx expression clusters. One-tailed Chi-squared test, p value = 1.72e-16. (d) MMR status of tumours in HiCol, Intermediate and HiSquam expression clusters. (e) Mutational status of tumours in HiCol, Intermediate and HiSquam expression clusters. (f) TNM stage of tumours in HiCol, Intermediate and HiSquam expression clusters. (g) Correlation of AtrxWT (colonic epithelial-like) and AtrxKO (squamous-like) gene expression signatures in GSE39582 dataset. iCMS status overlayed in purple (iCMS2) and orange (iCMS3). (h) Percentage of tumours designated as iCMS2 (i2) or iCMS3 (i3) transcriptional subtype in different Atrx expression clusters. Chi-squared test, p value = 2.2e-16. (i) FACS plots for analysing EPCAM+ve/LY6D+ve cells from normal colon and colon cancer samples. Box highlights the presence of EPCAM+ve/LY6D+ve cells. (j) Quantification of EPCAM+ve/LY6D+ve cells from normal colon and colon cancer samples, separated into left and right sided groups. For (a) p value was calculated using two-sided Fisher’s exact test. For (c), (d), (e), (f) and (h) p values were calculated using one-tailed Chi-Square test. For (g) Pearson’s correlation coefficient and two-sided p-value are described. The blue line and gray shaded area represent the regression line and 95% confidence interval. For (j) n = 5 (normal colon), n = 2 (left sided tumour), n = 3 (right sided tumour) biological independent samples. Data are mean ± SD. P values were calculated using ordinary one-way ANOVA with multiple comparisons.
Extended Data Fig. 12
Extended Data Fig. 12. AtrxKO expression signature is associated with loss of HNF4A activity.
Heatmap of z-scores of ATAC-seq log2 normalised counts across 77 samples from 37 CRC patients from the TCGA. ATAC-seq peaks shown correspond to the significantly differential accessible regions in patients with high AtrxKO expression score vs high AtrxWT patients. FDR was calculated using two tailed ttest.

References

    1. Hanahan, D. Hallmarks of cancer: new dimensions. Cancer Discov.12, 31–46 (2022). - PubMed
    1. Pérez-González, A., Bévant, K. & Blanpain, C. Cancer cell plasticity during tumor progression, metastasis and response to therapy. Nat. Cancer4, 1063–1082 (2023). - PMC - PubMed
    1. Birkbak, N. J. & McGranahan, N. Cancer genome evolutionary trajectories in metastasis. Cancer Cell37, 8–19 (2020). - PubMed
    1. Martínez-Jiménez, F. et al. Pan-cancer whole-genome comparison of primary and metastatic solid tumours. Nature618, 333–341 (2023). - PMC - PubMed
    1. Priestley, P. et al. Pan-cancer whole-genome analyses of metastatic solid tumours. Nature575, 210–216 (2019). - PMC - PubMed

MeSH terms

LinkOut - more resources