. 2025 Aug;644(8076):453-462.
doi: 10.1038/s41586-025-09037-4. Epub 2025 Jun 4.

Molecular gradients shape synaptic specificity of a visuomotor transformation

Affiliations

Molecular gradients shape synaptic specificity of a visuomotor transformation

Mark Dombrovski et al. Nature. 2025 Aug.

Abstract

How does the brain convert visual input into specific motor actions1,2? In Drosophila, visual projection neurons (VPNs)3,4 perform this visuomotor transformation by converting retinal positional information into synapse number in the brain5. The molecular basis of this phenomenon remains unknown. We addressed this issue in LPLC2 (ref. 6), a VPN type that detects looming motion and preferentially drives escape behaviour to stimuli approaching from the dorsal visual field with progressively weaker responses ventrally. This correlates with a dorsoventral gradient of synaptic inputs into and outputs from LPLC2. Here we report that LPLC2 neurons sampling different regions of visual space exhibit graded expression of cell recognition molecules matching these synaptic gradients. Dpr13 shapes LPLC2 outputs by binding DIP-ε in premotor descending neurons mediating escape. Beat-VI shapes LPLC2 inputs by binding Side-II in upstream motion-detecting neurons. Gain-of-function and loss-of-function experiments show that these molecular gradients act instructively to determine synapse number. These patterns, in turn, fine-tune the perception of the stimulus and drive the behavioural response. Similar transcriptomic variation within neuronal types is observed in the vertebrate brain7 and may shape synapse number via gradients of cell recognition molecules acting through both genetically hard-wired programs and experience.


Conflict of interest statement

Competing interests: The authors declare no competing interests.

Figures

Fig. 1
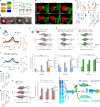
Fig. 1. Molecular gradients correlate with synaptic gradients and behaviour.
a, VPN dendrites cover the lobula (Lo) and LoP, and axons converge on optic glomeruli innervated by descending neurons (DNs). n = 12 brains. D, dorsal; V, ventral. The illustration of the brain was created using BioRender (https://biorender.com). b, Confocal projection of LPLC2 and the giant fibre (GF). n, individual brains. Scale bar, 20 μm. L, lateral. c, Connectomic reconstructions of LPLC2 neurons (‘hemibrain’), coloured by LPLC2–GF synapse count (top), and linear regression of synapse number versus dorsoventral (DV) axis (bottom). The dots indicate individual neurons, and the error bands denote ±95% confidence intervals. The bottom panel was adapted from ref. , Springer Nature. d, Same as panel c (top), using FlyWire,. e, GF-mediated short-mode takeoffs in response to lateral (90°) looms at various elevations. The error bars denote ±95% confidence intervals. Numbers indicate total takeoffs (one per animal). Chi-squared test (P = 8.351 × 10−7) with post-hoc Bonferroni correction for multiple comparisons, **P = 0.0066 (−30° versus 77°), ****P < 0.0001 (0° versus 77°), *P = 0.0215 (23° versus 77°) and ***P = 0.000399 (45° versus 77°). f, GF response to looming at different elevations (left), and pooled peak GF responses across five trials (right). Dots denote individual flies (n = 5 biologically independent animals). The boxes denote quartiles, and the whiskers indicate 1.5× interquartile range. Repeated measures analysis of variance (rANOVA; P = 0.0048) with Sidak-adjusted post-hoc test, *P = 0.0385 (−25° versus 25°). g, Retinotopic maps transform into synaptic gradients between LPLC2 and GF without axonal retinotopy. h, Single-cell RNA sequencing (scRNA-seq) experimental design. The illustrations of the fly and pupa were adapted from ref. , Wiley Periodicals. i,j, tSNE plots of the 48 h APF dataset (i) with LPLC2, LPLC1 and LC4 annotated by marker gene expression (j). TP10K, transcripts per 10,000; X, unknown cell type. k, Heatmaps of the top 30 PC1 genes (15% variance explained) in LPLC2 at 48 h APF. Scaled expression levels (left), and log-normalized expression (right) are shown. l, LPLC2 neuron distributions along PC1–PC2 at 48 h APF, coloured by age, genotype, sex and coverage. lncRNA, long non-coding RNA; nUMI, number of unique molecular identifiers. m, PCA plots of LPLC2 neurons at 48 h APF, 72 h APF and 96 h APF, showing temporal expression changes in select genes from panel k. Source data
Fig. 2
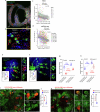
Fig. 2. Gradients of recognition molecules align with synaptic gradients.
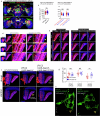
a, Light-sheet projection of the Drosophila optic lobe showing LPLC2 nuclei and transcripts of dpr13 and SiaT. n = 7 brains. Scale bar, 100 μm. b, Antiparallel expression of dpr13 and SiaT across LPLC2 neurons (scRNA-seq; Fig. 1h–m). The smoothed lines indicate estimated mean expression trend. The error bands denote ±95% confidence intervals. r, Spearman’s rank correlation coefficient. c, Single 0.5-μm-thick slice from panel a (zoomed in region highlighted by the dashed rectangular box). The arrowheads denote individual LPLC2 neurons expressing markedly different levels of dpr13 and SiaT. Scale bar, 10 μm. d, Comparison between scRNA-seq (left) and FISH (right) measuring correlation in expression for two pairs of graded genes: dpr13–SiaT (top) and dpr13–beat-VI (bottom) across LPLC2 neurons. The smoothed lines indicate linear regression fits, and the shaded bands denote ±95% confidence intervals. r, Spearman’s rank correlation coefficient (rs). e, Comparison of RNA-seq and HCR-FISH measuring correlation in expression for 12 pairs of genes at three developmental time points across LPLC2 neurons. Individual dots indicate rs for each brain (FISH) and each genotype (scRNA-seq). The error bars denote means ± 95% confidence intervals. n, total neurons tested. f, Genetic approach to visualize a subset of neurons within a VPN cell type expressing a specific gene at a particular time point. g, Positive control for panel f. n = 5 brains (one side per animal tested). Scale bars, 20 μm. M, medial. h, Correlation between expression levels of dpr13–beat-VI and dpr17–SiaT (from scRNA-seq; Fig 1h–m), along PC1 across the LPLC2 population. i, Subsets of LPLC2 neurons expressing dpr13, dpr17, beat-VI and SiaT. n, number of brains (one side per animal tested); n = 11 for dpr13, n = 8 for beat-VI, n = 10 for SiaT and n = 7 for dpr17. Scale bars, 10 μm. A, anterior. For panels ad,hI, 48 h APF developmental time point. Data are from single experiments. Source data
Fig. 3
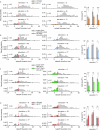
Fig. 3. A gradient of DIP-ε–Dpr13 interactions controls a looming escape synaptic gradient.
a, Molecular-binding partners of differentially expressed recognition molecules in LPLC2. b,c, Expression levels of candidate genes in the GF. Light-sheet projections of the GF nuclei (b), and quantification of their expression levels across development (c). The red puncta indicate candidate gene mRNA, and the circles denote individual GF neurons (one per animal; n = 3 neurons per gene). Scale bars, 10 μm. d, Confocal projections of colocalized LPLC2 axon terminals and the GF dendrites in wild-type and DIP-εnull animals across development. n, brains (one side per animal); n = 11 and 11 for 48 h APF, n = 10 and 9 at 72 h APF, n = 14 and 13 at 96 h APF for wild type and DIP-εnull, respectively. Scale bars, 10 μm. e, LPLC2–GF axo-dendritic overlap in controls and DIP-εnull across development. Unpaired t-test with Welch’s correction (two-sided). ***P = 0.000323 (48 h APF), ****P = 2.138 × 10−5 (72 h APF) and ****P = 3.344 × 10−11 (96 h APF). f, Same as panel e for DIP-ε rescue in the GF. One-way ANOVA (F = 63.753, P = 3.64 × 10−13) followed by Tukey’s (HSD) test for post-hoc pairwise comparisons. Not significant (NS) P = 0.588, ****P = 3.76 × 10−12 and ****P = 2.188 × 10−11. g, Same as panel e for controls and GF > DIP-ε RNAi animals. Unpaired t-test with Welch’s correction (two-sided). ****P = 1.347 × 10−9 and ****P = 7.587 × 10−11. h, Whole-cell patch-clamp recordings in the GF. GF responses to looming at r/v = 40 ms (left). Control (n = 5 flies) and DIP-εnull (n = 7 flies) traces (individual and average) are overlayed. The looming stimulus profile over time is displayed below the GF responses. Quantification of expansion peak amplitudes from individual flies is also shown (right). n, biologically independent animals. The circles indicate mean values of two recordings per animal, and the error bars denote median and 25–75th percentiles. Mann–Whitney U-test U = 4, *P = 0.0303. i, Same as panel h for controls and GF > DIP-ε RNAi animals (n = 5 flies each). U = 2, *P = 0.03175. j, Violin plots of takeoff sequence durations for lateral stimuli at different elevations in wild-type and DIP-εnull animals (top). The lines indicate single takeoffs. Short and long modes are separated by a red dashed line. n, total takeoffs. Mann–Whitney U-test, ****P = 2.763 × 10−7, ****P = 8.166 × 10−9 and ***P = 1.978 × 10−4. Short-mode takeoff percentages are also shown (bottom). The error bars denote mean ± 95% confidence intervals. The dashed lines indicate the wild-type DV gradient and its elimination DIP-εnull. Numbers refer to total takeoffs. Chi-squared test with post-hoc Bonferroni correction for multiple comparisons: *P = 0.0218 and NS P = 0.1149. k, Same as panel j for controls and GF > DIP-ε RNAi. *P = 0.031, NS P = 0.334 and ***P = 1.92 × 10−4 (top), and *P = 0.047 and NS P = 0.874 (bottom). l, Same as panel j for controls and LPLC2 > UAS-dpr13. ***P = 4.63 × 10−4, *P = 0.038 and NS P = 0.941 (top), and **P = 0.0018 and NS P = 0.8651 (bottom). m, Same as panel e for control animals, and LPLC2 > UAS-dpr13 animals. Unpaired t-test with Welch’s correction (two-sided). *P = 0.022640. n, Same as panel j for wild type and dpr13null. **P = 0.0056, NS P = 0.4267 and NS P = 0.7714 (left), and *P = 0.0342 and NS P = 0.6221. a.u., arbitrary units. o, Same as panel e for control and LPLC2 > UAS-DIP-ε animals. Unpaired t-test with Welch’s correction (two-sided). ***P = 0.000503. p, The model shows that a DV gradient of Dpr13–DIP-ε interactions determines synapse number between individual LPLC2 neurons and the GF. Scale bars, 10 μm. In panels eg,mo, n values (images) and circles (plots) represent brains (one side per animal), and the error bars denote median ± 95% confidence intervals. Data are from single experiments. Source data
Fig. 4
Fig. 4. A gradient of Beat-VI–Side-II interactions controls a dendritic synaptic gradient between T4d/T5d and LPLC2 neurons.
a, Confocal projections of the LPLC2 population (top; n = 8 brains) and an individual LPLC2 neuron (bottom; n = 11 neurons, one per brain), highlighting the dendritic branches in the LoP. Numbers refer to LoP layers. The inset shows the posterior view of a single LoP dendrite with branches extending into one of the four cardinal directions in each layer. b, In the connectomic reconstructions (FlyWire,) of LPLC2 neurons, the skeleton of each neuron is colour coded by the number of inputs each LPLC2 neuron receives from T4c or T4d and T5c or T5d neurons. The insets show schematics of single LPLC2 (red) and T4c or T4d or T5c or T5d neurons, overlaid on the lobula or LoP outlines. Scale bars, 50 μm (a,b). c, Confocal projections of LoP dendrites (posterior view) in individual dorsal, central and ventral LPLC2 in control and LPLC2 > beat-VI RNAi flies. The numbers denote LoP layers. The dashed ovals indicate LoP4 dendritic branches. n, neurons, one per brain (n = 12 and n = 9 for dorsal control versus beat-VI RNAi; n = 11 and n = 13 for central control versus RNAi; n = 12 and n = 9 for dorsal control versus RNAi; and n = 9 for ventral control versus RNAi). d, Length of LoP4 dendritic branches for dorsal, central and ventral LPLC2 neurons in control and LPLC2 > beat-VI RNAi flies. The circles denote neurons (one neuron per brain), and the error bars indicate median ± 95% confidence intervals. Unpaired t-test with Welch’s correction. ***P = 2.95 × 10−8 (dorsal LPLC2), ****P = 2.264 × 10−8 (central LPLC2) and NS P = 0.923 (ventral LPLC2). e, Confocal projections of individual LoP dendrites (posterior view) of dorsal and ventral LPLC2 neurons in T4/T5 > side-II RNAi flies. The dashed ovals denote LoP4 dendritic branches. n = 6 neurons for both positions (one neuron per brain). Scale bars, 10 μm (c,e). Data are from single experiments (a,c,e). Source data
Fig. 5
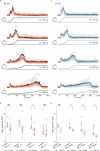
Fig. 5. A gradient of Beat-VI–Side-II interactions controls downwards motion perception in LPLC2.
a, Schematic of the fly eye relative to the display for visual stimulation during calcium imaging. Schematic adapted from ref. , eLife Sciences Publications. b, Display positions probing LPLC2 receptive field with dark edges moving in 24 orientations (top). The orange line indicates the eye equator (eq) projected onto the display. Mollweide projection of the outermost positions (black boxes) relative to the eye is also shown (bottom). c, Connectomic reconstructions of putative LPLC2 neurons at positions 16 (bodyID_28871) and 40 (bodyID_30207). The insets show neurites imaged; single-cell ROIs are overlaid. Scale bars, 25 μm. P, posterior. d, Polar plots of peak responses to moving dark edges in dorsal (red) and ventral (blue) LPLC2 neurons (representative fly). e, Directional sensitivity index (DSI) for dorsal (red) and ventral (blue) LPLC2 neurons in control, beat-VIRNAi and UAS-beat-VI flies. The circles indicate individual recordings, and the lines denote position–genotype interactions. The error bars indicate mean ± s.e.m. A two-way rANOVA revealed a genotype × position interaction (χ2 = 9.80, P = 0.0074). *P = 0.0192 (UAS-beat-VI versus control), *P = 0.0173 (beat-VIRNAi versus control) and NS P = 1.0000 (UAS-beat-VI versus beat-VI RNAi). Bonferroni-adjusted pairwise contrasts. f, Bootstrap of DSI mean in dorsal (16; top) and ventral (40; bottom) regions for control, beat-VI RNAi and UAS-beat-VI flies. g, Filtered heatmap of DSI for all tested positions in control, beat-VI RNAi and UAS-beat-VI flies. h, Average peak responses to looming stimuli above (dorsal) or below (ventral) the eye’s equator in UAS-beat-VI (left), control (middle) and beat-VI RNAi (right) flies. The error bars denote mean ± s.e.m. A two-way rANOVA revealed a main effect of position (χ2 = 75.75, P < 0.0001). Bonferroni-adjusted pairwise t-tests for post-hoc comparisons. NS P = 1.0000 for all comparisons. i, The model shows that a DV gradient of Beat-VI–Side-II interactions determines synapse number between T4d/T5d and LPLC2 neurons. n, biologically independent animals (multiple trials per animal; e,g,h). Data are from single experiments. Source data
Extended Data Fig. 1
Extended Data Fig. 1. (related to Fig. 1). LPLC2-GF dorsoventral synaptic gradient biases the looming escape circuit towards short-mode takeoffs at higher stimulus elevations.
a, GF-mediated short-mode (<7 ms sequence duration) takeoffs in response to frontal (0°) looms at various elevations. Error bars, ± 95% confidence intervals. Numbers, total takeoffs (one takeoff per animal). Chi-squared test (p < 0.0001) with post-hoc Bonferroni correction for multiple comparisons, ***P = 8.79 × 10−4 (−30° vs 77°), ****P = 0.03 × 10−4 (0° vs 77°), **P = 5.68 × 10−3 (23° vs 77°), ****P = 0.37 × 10−4 (45° vs 77°). b, Histograms showing the distribution of takeoff sequence durations in response to frontal (left) and lateral (right) looming stimuli at different elevations (detailed breakdown of data summarized in Fig. 1e). Short-mode and long-mode takeoffs are distinguished by the red dashed lines. Numbers, total trials. c, Total takeoff percentage in response to frontal (0°) and lateral (90°) looms at various elevations. Error bars, ± 95% confidence intervals. Numbers, total trials. Chi-squared test (P < 0.0001 for both azi=0° and azi=90°) with post-hoc Bonferroni correction for multiple comparisons, ***P = 2.46 × 10−4 (−30° vs 77°, azi=0°), **P = 0.0025 (0° vs 77°, azi=0°), **P = 0.0039 (23° vs 77°, azi=90°). d, Top: whole-cell electrophysiological recordings of the GF in response to looming stimuli at different elevations in control animals. Black traces represent averaged responses of five animals (corresponding to Fig. 1f), green traces represent responses of individual animals. Middle: baseline region (2 s before the onset of stimulus) and response region (150 ms after the onset of stimulus) defined in the traces for analysis of the GF responses. Bottom: change of disk size over time. e, Pooled mean of integrated potentials for the GF in response to looming stimuli at different elevations across five repeated trials. Each dot represents a single fly (n = 5 biologically independent animals). Boxes: quartiles; whiskers: 1.5× interquartile range. Repeated-measures one-way ANOVA (P = 0.01) with post-hoc Sidak correction for multiple comparisons, *P = 0.0496 (−25° vs 25°). f, Violin plots of takeoff sequence durations for lateral stimuli (90°) at different elevations (0°, 45°, 77°) in controls and LPLC2-silenced animals. Lines, single takeoffs. Short-mode and long-mode durations are separated by a red dashed line. n, total takeoffs. Mann-Whitney U test, ***P = 2.72 × 10−4 (0° elevation)) *P = 0.0118 (45° elevation), **P = 0.0040 (77° elevation). g, Histograms showing the distribution of takeoff sequence durations in response to lateral looming stimuli at different elevations in controls and LPLC2-silenced animals (detailed breakdown of f). Short-mode and long-mode takeoffs are distinguished by the red dashed lines. Numbers, total trials. h, Short-mode takeoff percentages at different elevations for controls and LPLC2-silenced animals. Error bars, ± 95% confidence intervals. Dashed lines indicated gradient trends. n, total number of takeoffs. Chi-squared test (NSP = 0.0977 for control; NSP = 0.7058 for LPLC2-silenced). NS, not significant. i, Total takeoff percentages at different elevations for controls and LPLC2-silenced animals. Numbers, total trials. Error bars, ± 95% confidence intervals. Chi-squared test, ****P = 1.772 × 10−7 (0° elevation), ****P = 1.671 × 10−16 (45° elevation), ****P = 8.272 × 10−11 (77° elevation). Source data
Extended Data Fig. 2
Extended Data Fig. 2. (related to Fig. 1). Synaptic gradients are associated with molecular heterogeneity across VPN cell types.
a-b, t-SNE plots of 72 h APF (a) and 96 h APF (b) datasets. LPLC2, LPLC1, and LC4 neurons were annotated based on the expression of known transcription factors (right panels). X indicates unknown ectopic cell types. c, Heatmaps of the expression patterns of the top 30 genes with the highest contribution (loading) to differentially expressed genes along Principal Component 1 (PC1, 15.2% variance explained) across LPLC1 neurons at 48 h APF (see Fig. 1 legend for details). Genes encoding cell recognition molecules (IgSF superfamily) are highlighted in bold. d, PCA plots of LPLC1 neurons at 48, 72, and 96 h APF, colored by the expression levels of two cell recognition molecules from c. e, PCA plots of LPLC2, LPLC1, and LC4 neurons at 48 h APF colored by genotype, age (early vs late collection), genotype (DGRP line), sex (male-specific transcript), and coverage. PC1-6 for LPLC1 and LC4, and PC3-6 for LPLC2 are shown. Source data
Extended Data Fig. 3
Extended Data Fig. 3. (related to Fig. 1). Further analysis of within-cell-type heterogeneity in gene expression across LPLC2, LPLC1 and LC4.
a-b, PCA plots of LPLC2, LPLC1 and LC4 neurons at 72 h APF (a) and 96 h APF (b) colored by genotype, age (early vs late collection), genotype (DGRP line), sex (male-specific transcript), and coverage. Shown are PC1-6. Variance explained by PC1 at 72 h: 32% for LPLC2, 17% for LPLC1, 11% for LC4. Variance explained by PC1 at 96 h: 28% for LPLC2, 15% for LPLC1, 21% for LC4. c-e, Scatter plots of LPLC2 cells (48 h APF) embedded in the first two principal components (PC1 and PC2) colored by their cluster labels (n = 2, inferred from K-means clustering). PCs are calculated using the top 1000 highly variable genes based on the actual data (c), after shuffling gene expression levels for each gene independently across all cells (d), and after shuffling each gene only within each cluster (e), respectively. Shuffling gene expression across all cells (d) disrupts this gradient, indicating that the observed differences reflect coordinated gene expression rather than uncorrelated variation. Shuffling within each cluster (e) disrupts the internal gradient of each cluster, creating artificial gaps not present in the original data (c), which suggests that the continuous gradient observed in the original data cannot be represented as a set of discrete clusters. f, Scatter plots of cells in PCA embeddings after shuffling genes within each cluster for an increasing number of fine-grained clusters (n = 2,5,30). g, Gap size as a function of the number of clusters. Gap size is defined as the minimum distance in PC1 and PC2 space needed to connect 90% of cells into a single graph component. The gap size decreases and plateaus as the number of clusters increases. This means that a continuum can be approximated by a large number of discrete clusters. However, a small number of clusters (like 2) is insufficient to capture the continuous nature of the data. Source data
Extended Data Fig. 4
Extended Data Fig. 4. (related to Fig. 2). Molecular validation of graded gene expression in LPLC2.
a-b, Light sheet projection of the expanded Drosophila optic lobe (48 h APF) with labeled LPLC2 nuclei and transcripts of dpr17 and beat-VI (a) and a single slice (0.5 μm) from the light sheet projection (b, zoomed into the yellow dashed rectangular region); arrows indicate LPLC2 somas expressing markedly different levels of dpr17 and beat-VI. n = 7 brains (one side per animal). Scale bar, 50 μm. c-d, Comparison of scRNA-seq (c) and HCR-FISH (d) measuring the correlation in expression for dpr17 and beat-VI across LPLC2 neurons at 48 h APF. Smoothed lines: linear regression fits; shaded bands: ± 95% confidence intervals. r, Spearman’s rank correlation coefficient. e-f, Assessment of dpr13 (e) and beat-VI (f) expression levels in sparsely labeled LPLC2 neurons using HCR-FISH. Left: representative images (scale bar, 20 μm). Right, cell bodies of dorsal, ventral, and central LPLC2 neurons (scale bar, 5 μm). Insets: comparison of dpr13 (e) and beat-VI (f) puncta count in dorsal and ventral LPLC2 neurons. Circles represent single neurons (one per brain); data from one experiment. Error bars: mean ± 95% confidence intervals. Unpaired t-test with Welch’s correction (two-sided). **P = 0.002 for dpr13; ***P = 0.0002 for beat-VI. n = 5 neurons per location. g-h, Comparison of dpr13 and beat-VI expression levels in dorsal and ventral LPLC2 neurons during UAS-dpr13 (g) and UAS-beat-VI (h) overexpression in LPLC2. Circles, individual neurons (1-3 neurons per brain). The mean values were calculated for the control and experimental groups, and the percentage increase was reported. No statistical test was performed. Error bars, mean ± 95% confidence intervals. i-l, Assessment of Beat-VI and Dpr13 gradients at the protein level. Individual sparsely labeled LPLC2 neurons with dendrites sampling either dorsal, or ventral regions of the visual space, are co-localized with Dpr13 (i) and Beat-VI (k) constitutive protein traps (GFP-fusion proteins). GFP levels in dorsal vs ventral cell bodies are measured via mean pixel intensity (j, l). Circles represent individual neurons (n = 5 for each protein and each location). Error bars: means ± 95% confidence intervals. Unpaired t-test with Welch’s correction. **P = 0.00351 for Dpr13; ***P = 0.000221 for Beat-VI. Data from a single experiment. Scale bars, 20 μm and 5 μm on whole-cell and somata images, respectively. D, dorsal; L, lateral; M, medial. Source data
Extended Data Fig. 5
Extended Data Fig. 5. (related to Fig. 2). Retinotopic correlates of molecular gradients in LPLC2 and LPLC1.
a, Subsets of LPLC2 neurons expressing CG44422 and Cad87A at 48 h APF. White arrows indicate ventral regions of the lobula lacking expression of both CG44422 and Cad87A. Dashed ovals, partial overlap of expression in somas, i.e., different LPLC2 neurons express different levels of CG44422 and Cad87A. n = 4. b, Positive correlation between expression levels of Cad87A, CG44422 and dpr13 (inferred from scRNA-seq), along PC1 across the LPLC2 population at 48 h APF, indicating that both CG44422 and Cad87A can be considered “dorsal” genes. c, Additional examples of genes expressed by ventral subpopulation of LPLC2 neurons. Red, dendrites of LPLC2 (lateral view of the lobula) that express stacl (n = 5 for 48 h and n = 3 for 96 h), Tsp42Ef (n = 4 for 48 h and n = 3 for 96 h) and CG30419 (n = 6 for 48 h and n = 3 for 96 h). d, Positive correlation between expression levels of stacl, Tsp42Ef and CG30419 (inferred from scRNA-seq), along PC1 across the LPLC2 population at 48 h APF. e, Retinotopically biased gene expression across LPLC1 neurons. Red, subsets of LPLC1 neurons expressing DIP-kappa, sdk and dpr17 across development (n = 9, 7, 6 for DIP-kappa; n = 8, 9, 5 for sdk; n = 4, 3, 3 for dpr17). f, Positive correlation between expression levels of DIP-kappa and sdk (top), and negative correlation between expression levels of DIP-kappa and dpr17 (bottom), (from scRNA-seq, Fig. 1h–m), along PC1 across the LPLC1 population at 48 h APF, reflecting the retinotopically biased expression of these genes in e. n, brains (one side per animal). Scale bars, 20 μm. Panels b, d, f: Smoothed lines represent the estimated mean expression trend. Error bands: ± 95% confidence intervals. r, Spearman’s rank correlation coefficient. D, dorsal; L, lateral; A, anterior.
Extended Data Fig. 6
Extended Data Fig. 6. (related to Fig. 3). Synaptic gradient between LPLC2 and the GF is established through a gradient of DIP-ε::Dpr13 molecular interactions.
a, Suggested model: to establish a synaptic gradient with LPLC2 based on dorsoventral expression gradient of any of the candidate molecules (Dpr13, Beat-VI, Dpr17), GF needs to express a molecular binding partner to recognize one or more of these molecules. b, Validation of VT049479-GAL4 expression in LPLC2 using GMR75G12-LexA as a reference. A complete overlap confirms that VT049479-GAL4 targets the entire LPLC2 population. n = 5 for 48 h APF, n = 4 for 96 h APF. Scale bars, 20 μm. c, Confocal projections of LPLC2 axon terminals and the GF dendrites in wild-type animals, as well as animals expressing control RNAi and two different DIP-ε RNAi in the GF (n = 19, 19, 11). d, Same as c for the DIP-ε rescue experiment (overexpression of DIP-ε cDNA in the GF in DIP-null background). n = 14, 16, 13. e, Same as c for control animals and animals overexpressing dpr13 in LPLC2. n = 14, 15. f, Same as c for control and dpr13null animals. n = 14, 13. g, LPLC2-GF axo-dendritic overlap in control and dpr13null animals. Circles, brains (one side per animal). Error bars: means ± 95% confidence intervals. Unpaired t-test with Welch’s correction (two-sided). NSP = 0.405. NS, not significant. h, Protein interaction map showing binding strength (affinity values are inversely proportional to edge thickness) between DIP-ε and multiple Dpr paralogs expressed in LPLC2. i, Expression levels of genes encoding DIP-ε binding Dpr paralogs in LPLC2 at 48 h and 96 h APF (inferred from scRNA-seq data generated in this study). j, Correlation between expression levels of genes encoding DIP-ε binding Dprs in LPLC2 at 48 h and 96 h APF (inferred from scRNA-seq), along PC1 across the LPLC2 population at 48 h and 96 h APF. Smoothed lines represent the estimated mean expression trend. Error bands: ± 95% confidence intervals. r, Spearman’s rank correlation coefficient. k, Same as c for control animals and animals overexpressing DIP-ε in LPLC2. n = 15, 15. l, FISH puncta count across LPLC2 neurons in controls and animals overexpressing DIP-ε in LPLC2. Circles, averaged values across all LPLC2 neurons per hemibrain. Error bars: mean ± 95% confidence intervals. Unpaired t-test with Welch’s correction (two-sided). ***P = 0.0001. Panels b-f, k: n, brains (one side per animal tested); data represent single experiments. Panels b-f, k: scale bars, 5 μm. D, dorsal; L, lateral; M, medial. Source data
Extended Data Fig. 7
Extended Data Fig. 7. (related to Fig. 3). Analysis of LPLC2-GF connections using synaptic labeling.
a, Genetic strategy (LexAop-STaR, Synaptic Tagging with Recombination) for generating sparsely labeled clones of LPLC2 neurons (with a fluorescent membrane marker) and visualizing their presynaptic sites (T-bars) with Brp-smGdP-V5. Adapted from ref. , Springer Nature. b, LPLC2 neurons labeled using LexAop-STaR. Left: confocal projection of LPLC2 glomerulus (axon terminals of ~30 LPLC2 neurons, labeled using long heat shock) co-localized with the GF dendrites (n = 6; scale bar, 5 μm). Middle: light sheet projection of a single LPLC2 neuron, imaged with 4x tissue expansion (n = 4; scale bar, 20 μm). Right: high-resolution image of the magnified view of presynaptic sites (T-bars) of a single LPLC2 neuron, co-localized with the GF dendrites (n = 4; scale bar, 1 μm). White arrows indicate individual T-bars, characterized by their distinctive ring-like shape and a typical diameter of 200–250 nm. n, brains (one neuron/optic glomerulus per brain). c, Same as b. Left to right: control animals (n = 8), dpr13null animals (n = 9), and animals expressing DIP-ε RNAi in the GF (n = 9). n, brains (one neuron per brain). Scale bars, 5 μm. d, Fraction of T-bars per single LPLC2 neuron overlapping with the GF dendrites. Left: control vs. dpr13null; right: control vs. GF > UAS-DIP-ε RNAi. Dots represent single neurons. Error bars: mean ± 95% confidence intervals. Unpaired t-test with Welch’s correction (two-sided). NSP = 0.239; ****P = 0.000047. NS, not significant. e, Same as in d, measuring the number of T-bars overlapping with the GF dendrites. NSP = 0.372; ****P = 0.00003. f, Same as in d, measuring the total number of T-bars per single LPLC2 neuron. NSP = 0.785; NSP = 0.125. In d–f, green lines indicate corresponding values inferred from the hemibrain connectome reconstruction. In d, the discrepancy between connectome-based and anatomy-based values likely reflects additional T-bars in the lobula/lobula plate not included in this analysis. Panels d-f: data from a single experiment. D, dorsal; L, lateral. Source data
Extended Data Fig. 8
Extended Data Fig. 8. (related to Fig. 3). Electrophysiology of the GF.
a, GF responses to looming stimuli, in r/v = 10, 20, 40 and 80 ms. Control (average: black, individual fly: grey) and DIP-εnull (average: orange, individual fly: light orange) traces are overlayed. Looming stimulus profile over time is displayed below the GF responses. n = 5 for controls; n = 7 for DIP-εnull flies. b, Quantification of expansion peak amplitudes in a from individual flies. n, biologically independent animals; circles, mean values of two recordings per animal. Error bars: median and 25th/75th percentiles. Mann-Whitney U test. r/v = 10 ms: U = 8, NSP = 0.149. r/v = 20 ms: U = 6, NSP = 0.07323. r/v = 40 ms: U = 4, *P = 0.0303. r/v = 80 ms: U = 14, NSP = 0.6389. c, Same as a for controls (grey) and animals overexpressing DIP-ε RNAi in the GF (light blue). n = 5 for controls and DIP-ε RNAi. d, Quantification of expansion peak amplitudes in c from individual flies. n, biologically independent animals (two trials per animal); circles, mean values of two recordings per animal. Error bars: median and 25th/75th percentiles. Mann-Whitney U test. r/v = 10 ms: U = 6, NSP = 0.222. r/v = 20 ms: U = 1, *P = 0.01587. r/v = 40 ms: U = 2, *P = 0.03175. r/v = 80 ms: U = 2, *P = 0.03175. Source data
Extended Data Fig. 9
Extended Data Fig. 9. (related to Fig. 3). Effects of Dpr13 and DIP-ε on GF-mediated takeoff behavior.
a, Left, Histograms showing the distribution of takeoff sequence durations at different stimulus elevations (0°, 45°, and 77°) in wild-type and DIP-εnull flies. Short-mode and long-mode takeoffs are distinguished by red dashed lines. n, number of trials. Right, total takeoff percentages at different elevations for wild-type and DIP-εnull flies. Error bars, ± 95% confidence intervals. Numbers, total number of trials. Chi-squared test. NSP = 0.1164 (0° elevation), **P = 0.0021 (45° elevation), ****P = 1.122 × 10−6. (77° elevation) NS, not significant. b, Same as a for controls and flies expressing DIP-ε RNAi in the GF. Error bars, ± 95% confidence intervals. Numbers, total number of trials. NSP = 0.1380 (0° elevation), NSP = 0.9581 (45° elevation), *P = 0.0167 (77° elevation). c, Same as a for controls and flies overexpressing dpr13 in LPLC2 neurons. Error bars, ± 95% confidence intervals. Numbers, total number of trials. ****P = 7.523 × 10−5 (0° elevation), ***P = 9.44 × 10−4 (45° elevation), *P = 0.0234 (77° elevation). d, Same as a for controls and dpr13null flies. Error bars, ± 95% confidence intervals. Numbers, total number of trials. ***P = 5.35 × 10−4, (0° elevation) NSP = 0.2358 (45° elevation), NSP = 0.9229 (77° elevation). Source data
Extended Data Fig. 10
Extended Data Fig. 10. (related to Fig. 4). Graded expression of beat-VI across LPLC2 neurons differentially affects LoP4 dendritic wiring.
a, Expression of beat-VI is biased towards the dorsal part of LPLC2 population. Red, subsets of LPLC2 neurons expressing beat-VI at 48 h APF (top) and 96 h APF (bottom). Green, all LPCL2 neurons. n = 8 brains at 48 h APF; n = 4 brains for 96 h APF. Scale bar, 50 μm. b-c, Comparison of axo-dendritic overlap between LPLC2 and the GF in controls (n = 12) vs side-IInull (n = 12) animals (b), and in animals expressing control RNAi (n = 13, 14) vs two beat-VI RNAi (n = 12, 12) in LPLC2 (c). Circles, brains (one side per animal). Error bars: mean ± 95% confidence intervals. Unpaired t-test with Welch’s correction (two-sided). NSP = 0.3884 (control vs side-IInull); NSP = 0.149 (UAS-control vs UAS-beat-VI RNAi KK); NSP = 0.2956 (UAS-control vs UAS-beat-VI RNAi GD). NS, not significant. d, Confocal projections of LPLC2 dendrites (entire LPLC2 population labeled) in the lobula plate in control animals (n = 16) and in animals with beat-VI RNAi expressed in LPLC2 (n = 18). Left panels: posterior views of the LPLC2 population with dashed rectangles indicating the location of cross-sections for dorsal, central, and ventral subsets of LPLC2. Numbers, LoP layers. Yellow arrows, LoP4 layer. Scale bars, 10 μm. e, Same as d for two different LPLC2 GAL4 driver lines and two different beat-VI RNAi lines. f, Confocal projections of LPLC2 dendrites (entire LPLC2 population labeled, dorsal and ventral cross-sections compared) in the lobula plate in control animals (left, n = 4), animals overexpressing beat-VI cDNA (middle, n = 4), and animals overexpressing beat-VI cDNA while also expressing beat-VI RNAi (right, n = 3). Yellow arrowheads indicate changes in LoP4 dendritic density. Scale bars, 20 μm. g, Length of LoP4 dendritic branches for dorsal, central and ventral LPLC2 neurons in control (n = 12, 14, 16 dorsal, central, and ventral) and LPLC2 > UAS-beat-VI (n = 15, 14, 12 dorsal, central, and ventral) flies. n, individual neurons (one cell per brain). Dots, individual neurons. Error bars: mean ± 95% confidence intervals. Unpaired t-test with Welch’s correction (two-sided). NSP = 0.073; NSP = 0.643; **P = 0.006. h, Confocal projections of sparsely labeled LPLC2 neurons. Representative images of control animals (left) and animals overexpressing beat-VI in LPLC2 (right). Differences in the length of LoP4 dendritic branches across ventral LPLC2 neurons are highlighted. Scale bars, 20 μm. Panels df, h: data represent single experiments. Panels d-f: n, brains (one side per animal). D, dorsal; V, ventral; P, posterior; M, medial; L, lateral. Source data
Extended Data Fig. 11
Extended Data Fig. 11. (related to Fig. 5). Beat-VI::Side-II molecular gradient regulates T4d/T5d-LPLC2 synaptic gradient.
a, 3D reconstruction of LPLC2 neurons from a Z-stack taken using the two-photon microscope in a head-fixed fly (lateral view, scale bar: 10 μm). Dashed lines highlight the two Z-planes where LPLC2 dendrites responded to dark looming at positions 16 (red) and 40 (blue) on the LED display (top). White solid lines approximately define the reference neuropils. Schematic of the procedure used to identify the putative neurons in the fly connectome stimulated by two representative grid positions (bottom, see Methods). D, dorsal; V, ventral. b, Polar plots of the peak responses to moving dark edges in dorsal (14) and ventral (30) regions in two representative flies (color-coded by position). c, Polar plots of the average peak responses to moving dark edges in dorsal (16) and ventral (40) regions for control, LPLC2>beat-VI RNAi, and LPLC2 > UAS-beat-VI flies. Error band, ± s.e.m. d, Polar plots of the average peak responses to moving dark edges in aggregated dorsal (above the equator) and ventral (below the equator) regions for control, LPLC2>beat-VI RNAi, and LPLC2 > UAS-beat-VI flies. Error band, ± s.e.m. e, Average calcium transient in response to a dark looming in dorsal (above the equator) and ventral (below the equator) regions for control, LPLC2>beat-VI RNAi, and LPLC2 > UAS-beat-VI flies. As the looming response is the non-linear sum of the response of dendrites in all for LoP layers, the small effects on the response to motion in LoP4 do not alter the measurement of the looming response in this assay. Error band, s.e.m. f, Average calcium transients in response to dark edges moving in 24 (from 0° to 345°) different orientations for control, LPLC2>beat-VI RNAi, and LPLC2 > UAS-beat-VI flies. Dorsal (left) and ventral (right) regions. Error band, ± s.e.m. Panels c-d: n values represent biologically independent animals (multiple trials per animal). Source data

References

    1. Shin, S., Crapse, T. B., Angeles, L., Mayo, J. P. & Sommer, M. A. in Encyclopedia of Neuroscience (eds Binder, M. D., Hirokawa, N. & Windhorst, U.) 4354–4359 (Springer, 2009).
    1. Andersen, R. A., Snyder, L. H., Li, C. S. & Stricanne, B. Coordinate transformations in the representation of spatial information. Curr. Opin. Neurobiol.3, 171–176 (1993). - PubMed
    1. Otsuna, H. & Ito, K. Systematic analysis of the visual projection neurons of Drosophila melanogaster. I. Lobula-specific pathways. J. Comp. Neurol.497, 928–958 (2006). - PubMed
    1. Wu, M. et al. Visual projection neurons in the Drosophila lobula link feature detection to distinct behavioral programs. eLife5, e21022 (2016). - PMC - PubMed
    1. Dombrovski, M. et al. Synaptic gradients transform object location to action. Nature613, 534–542 (2023). - PMC - PubMed

Substances

LinkOut - more resources