. 2025 Jul;643(8073):1076-1086.
doi: 10.1038/s41586-025-09087-8. Epub 2025 Jun 4.

CREM is a regulatory checkpoint of CAR and IL-15 signalling in NK cells

Hind Rafei  1   2 Rafet Basar #  1   2 Sunil Acharya #  1   2 Yu-Sung Hsu #  1   2   3 Pinghua Liu #  1   2 Deqiang Zhang #  1   2 Toszka Bohn  4   5   6 Qingnan Liang  7 Vakul Mohanty  7 Ranjan Upadhyay  1   8 Ping Li  1   2 Pravin Phadatare  1   2 Merve Dede  7 Donghai Xiong  1   2 Huihui Fan  9 Corry Mathew Jones  1   2 Sebastian Kunz  4 May Daher  1   2 Ana Karen Nunez Cortes  1   2 Mayra Shanley  1   2 Bin Liu  1   2 Sadie Mae Moseley  1 Chenyu Zhang  1   2 Dexing Fang  1   2 Pinaki Banerjee  1   2 Nadima Uprety  1   2 Ye Li  1   2 Rejeena Shrestha  1   2 Xinhai Wan  1   10 Hong Shen  1   2 Vernikka Woods  1   2 April Lamour Gilbert  1   2 Seema Rawal  1   2 Jinzhuang Dou  7 Yukun Tan  7 Jeong-Min Park  1   2 Francia Reyes Silva  1   2 Alexander Biederstädt  1   11 Mecit Kaplan  1   2   3 Xin Ru Jiang  1   2   3 Inci Biederstädt  1 Bijender Kumar  1   2 Silvia Tiberti  1   2 Madison Moore  1   2 Jingling Jin  1   2 Ryan Z Yang  1 Luis Muniz-Feliciano  1   2 Samuel Rosemore  1   12 Paul Lin  1   2 Gary M Deyter  1   2 Natalie Wall Fowlkes  13 Abhinav K Jain  14 David Marin  1   2 Anirban Maitra  15   16 Ken Chen  7 Tobias Bopp  4   5   6   17   18 Elizabeth J Shpall  1 Katayoun Rezvani  19   20
Affiliations

CREM is a regulatory checkpoint of CAR and IL-15 signalling in NK cells

Hind Rafei et al. Nature. 2025 Jul.

Abstract

Chimeric antigen receptor (CAR) natural killer (NK) cell immunotherapy offers a promising approach against cancer1-3. However, the molecular mechanisms that regulate CAR-NK cell activity remain unclear. Here we identify the transcription factor cyclic AMP response element modulator (CREM) as a crucial regulator of NK cell function. Transcriptomic analysis revealed a significant induction of CREM in CAR-NK cells during the peak of effector function after adoptive transfer in a tumour mouse model, and this peak coincided with signatures of both activation and dysfunction. We demonstrate that both CAR activation and interleukin-15 signalling rapidly induce CREM upregulation in NK cells. Functionally, CREM deletion enhances CAR-NK cell effector function both in vitro and in vivo and increases resistance to tumour-induced immunosuppression after rechallenge. Mechanistically, we establish that induction of CREM is mediated by the PKA-CREB signalling pathway, which can be activated by immunoreceptor tyrosine-based activation motif signalling downstream of CAR activation or by interleukin-15. Finally, our findings reveal that CREM exerts its regulatory functions through epigenetic reprogramming of CAR-NK cells. Our results provide support for CREM as a therapeutic target to enhance the antitumour efficacy of CAR-NK cells.


Conflict of interest statement

Competing interests: H.R., R.B., S.A., M.S., M. Daher, P.B., N.U., Y.L., P. Lin, D.M., E.J.S. and K.R. and The University of Texas MD Anderson Cancer Center have an institutional financial conflict of interest with Takeda Pharmaceutical. S.A., R.B., D.M., E.J.S. and K.R. have an institutional financial conflict of interest with Affimed. A.M. is listed as an inventor on a patent that has been licensed by Johns Hopkins University to ThriveEarlier Detection. A.M. serves as a consultant for Tezcat Biotechnology. A.M. receives royalties from a patent that is licensed to Exact Sciences. K.R. participates on the Scientific Advisory Board for Avenge Bio, Virogin Biotech, Navan Technologies, Caribou Biosciences, Bit Bio, Replay, oNKo Innate, The Alliance for Cancer Gene Therapy ACGT, Innate Pharma and Shinobi Therapeutics. K.R. is the scientific founder of Syena. E.J.S. participates on the Scientific Advisory Board for Adaptimmune Limited, Axio Research, Celaid Therapeutics, FibroBiologics, Navan Technologies, New York Blood Center and Zelluna Immunotherapy. M. Daher participates on the Scientific Advisory Board of Cellsbin. The remaining authors declare that they have no competing interests.

Figures
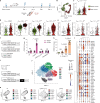
Fig. 1
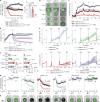
Fig. 1. CREM is induced by CAR signalling and IL-15 stimulation.
a, Schematic of the in vivo experiment for the scRNA-seq data from the Raji mouse model treated with CAR19–IL-15 NK cells (n = 2 mice each, euthanized on day 7 and day 14). i.v., intravenous. Created in BioRender. Rafei, H. (2025) https://BioRender.com/9xq1zl4b, UMAP depicting CAR19–IL-15 NK cells before (green) and after (red) infusion (data pooled from day 7 and day 14 after infusion). c, Quantification of CREM expression before and after infusion. d,e, Expression of select genes encoding NK cell activation markers (d) or inhibitory markers (e) before (green) and after (red) infusion. f, Schematic of the constructs encoding CAR70, CAR70.3ζ.Y6F and CD27(ECD). ICD, intracellular domain; TMD, transmembrane domain. g, CREM expression in NT and CAR-transduced NK cells with or without CD70 antigen stimulation as assessed by qPCR (n = 4 donors). h, CREM expression in NT NK cells stimulated with IL-15 as assessed by qPCR (n = 7 donors). i, Schematic of the constructs encoding IL-15, CAR70–IL-15 and CAR70. j, t-SNE CUDA analysis of the phenotypic signature of NK cells from NT, IL-15, CAR70–IL-15 and CAR70 NK cells after co-culture with UMRC3 cells at an effector-to-target (E/T) ratio of 1:1 as assessed by mass cytometry (n = 3 donors). k, Contour plots showing t-SNE CUDA cluster prevalence in the indicated NK cell conditions. l, Heatmap of expression levels of NK cell markers across NK cell clusters. The expression of each marker is represented by the robust z score for expression normalized across the clusters, with a colour scale ranging from blue (z = −1) to orange (z = +1) and the size of the circle for percentage of expression. Statistical comparisons were performed using two-sided Wilcox rank-sum tests (ce), two-way analysis of variance (ANOVA) with Tukey’s correction (g), one-way ANOVA with Tukey’s correction (h) or one minus Pearson’s hierarchical clustering (l). Data are presented as the mean ± s.e.m. NS, not significant. Source Data
Fig. 2
Fig. 2. CREM upregulation is mediated through the PKA–pCREB axis.
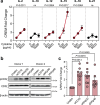
a, Schematic of experiments for bd. Created in BioRender. Rafei, H. (2025) https://BioRender.com/cczoc8f. b, pCREB expression measured by phospho-flow in NT, CAR70, CAR70.3ζ.Y6F and CD27(ECD) NK cells that were treated with (+) or without (–) CD70 antigen for stimulation, H89 (PKA inhibitor) or EGTA (calcium chelator) (n = 5 donors). c, FACS plots of pCREB in CAR70 NK cells under the indicated conditions. Forskolin (FSK) was used as the positive control. d, CREM expression by qPCR in the indicated NK cell conditions treated with or without CD70 antigen, H89 or EGTA for 24 h (n = 3 donors). e, Schematic of the experiments in fj. Created in BioRender. Rafei, H. (2025) https://BioRender.com/j6djzbh. f,g, FACS plots (f) and quantification (g) of pCREB in NT NK cells that were unstimulated or stimulated for 30 min with increasing concentrations of IL-15 (n = 14 donors). h, Whole-cell lysates from NT NK cells that were treated as in f and g were analysed by western blotting for pCREB and total CREB. β-actin served as the loading control. A representative blot is shown. i, Densitometry analysis quantifying the relative band intensity of pCREB normalized to total CREB (n = 5 donors). j, CREM expression by qPCR in NT NK cells that were stimulated or not for 24 h with increasing concentrations of IL-15 in the presence or absence of H89 (n = 3 donors). k, ChIP–qPCR for the enrichment of CREB in the promoter region of CREM and a region of no enrichment (negative control) in the indicated conditions (n = 3 donors). l, ChIP–qPCR for the enrichment of pCREB in the promoter region of CREM in NT NK cells incubated for 6 h in the absence or presence of increasing concentrations of IL-15 (n = 3 donors). Statistical comparisons were performed using two-way ANOVA with Bonferroni correction (b,d), one-way ANOVA with Tukey’s correction (g,i) or two-sided multiple t-tests with Holm–Šídák correction (jl). Data are presented as the mean ± s.e.m. Source Data
Fig. 3
Fig. 3. CREM KO ameliorates CAR-NK cell function.
a, Spheroid killing assay of GFP+ UMRC3 cells by CREM WT NT and CREM WT or KO CAR70–IL-15 NK cells (n = 3 donors). The spheroid green image mean determines spheroid growth over time. The black arrow indicates the time of NK cell addition. The bar graph shows the area under the curve (AUC) for the normalized spheroid green image mean. b, Representative images over time of the spheroid assay in a. c, Tumour rechallenge assay with CREM WT NT and CREM WT or KO CAR70–IL-15 NK cells against Raji–mCherry. Tumour cells were added every 2–3 days (black arrows; n = 3 donors). d, Impedance killing assay of PATC148 cells by CREM WT NT and CREM WT or KO CAR.TROP2–IL-15 NK cells over time (n = 3 donors). The cell index (tumour growth) was normalized to the NK cell addition time (black arrow). e, Tumour rechallenge assay with CREM WT or KO NT, IL-15, CAR70–IL-15 and CAR70 NK cells against UMRC3 cells using xCELLigence (n = 3 donors). The black arrow indicates the time of NK cell addition. RC, tumour rechallenge, indicated by vertical black lines. The cell index was normalized to the time of NK cell addition, and negative values were transformed to 0. f, Percentage of tumour necrosis factor (TNF) and interferon γ (IFNγ) (intracellular staining) response of the indicated CREM WT or KO NK cells after 6 h of incubation with UMRC3 cells (1:1 E/T ratio; n = 3 donors). g,h, Spheroid killing assay of GFP+ UMRC3 cells by CREM WT or KO NT, IL-15, CAR70–IL-15, CAR70, CAR70.3ζ.Y6F and CD27(ECD) NK cells (2:1 E/T ratio; n = 3 donors). Data were quantified and normalized as in a. Images in h were taken on day 3 of the assay. Statistical comparisons were performed using two-way ANOVA with Tukey’s correction (a (left),c,d,e,g), one-way ANOVA with Tukey correction (a, right) or one-way ANOVA (Fisher’s least significance difference test; f). Data are presented as the mean ± s.e.m. Scale bars, 400 µm (b,h). Source Data
Fig. 4
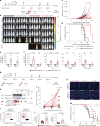
Fig. 4. CREM KO improves CAR-NK cell efficacy in vivo.
a, Schematic of the experimental plan for the Raji mouse model. Created in BioRender. Rafei, H. (2025) https://BioRender.com/83ud7ql. b,c, Bioluminescence imaging (b) and quantification (c) of tumour burden over time (n = 5 mice per group). d, Kaplan–Meier survival curves. e,f, Quantification of CAR+ NK cells (human CD45+ (hCD45+)CD56+CD16+CD27+) in the blood (e) and the indicated organs (f) of mice 10 or 20 days after NK cell infusion by flow cytometry (n = 5 mice per group). g, Schematic of the experiment for the BCX.010 metastatic PDX model (the timed euthanasia and survival experiments were performed independently using three donors, one for the timed euthanasia and two for survival). Created in BioRender. Rafei, H. (2025) https://BioRender.com/8dgkmca. h, Number of metastatic nodules in mice in the indicated groups at day 35 (n = 5 mice per group). i, Representative FACS plots of human NK cells (hCD45+) at day 35 after NK cell treatment in the blood of mice treated with CREM WT or KO CAR70–IL-15 NK cells. j, Flow cytometry analysis of hCD45+CD56+CD16+CD27+ cells in the blood of mice 10, 20 or 35 days after NK cell infusion (n = 5 mice per group). k,l, Representative fused and deconvoluted images (k) and quantification (l) of immunohistochemistry (IHC) staining of hCD45 (green) and GZMB (red) in adjacent serial lung sections (k) or sections from metastatic sites (lung and liver) (l) of mice at day 35 after NK cell infusion (n = 5 mice per group). Scale bars, 100 µm. m, Kaplan–Meier survival curves. Data were pooled from two donors (n = 4 mice in BCX.010 alone group and n = 10 mice in each of the NT, CREM WT CAR70–IL-15 and CREM KO CAR70–IL-15 groups with 5 mice per donor). Statistical comparisons were performed using two-way ANOVA with Tukey’s correction (c), log-rank test (Mantel–Cox; d,m), two-way ANOVA with Šídák’s correction (e,f,j), one-way ANOVA (uncorrected Dunn’s test; h) or two-sided Mann–Whitney test (l). Red P values indicate CREM WT versus KO CAR70–IL-15 NK cell group comparisons. Data are presented as the mean ± s.e.m. Source Data
Fig. 5
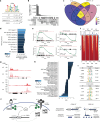
Fig. 5. CREM drives NK cell dysfunction through transcriptional and epigenetic reprogramming.
a, CREM-binding motif enrichment in CREM ChIP–seq in NT, IL-15, CAR70–IL-15 and CAR70 NK cells (n = 3 donors for NT, IL-15 and CAR70 and one donor for CAR70–IL-15 NK cells; Methods). b, UpSet plot of CREM-binding sites in CAR70–IL-15 NK cells from one representative donor. c, Venn diagram of CREM target genes (within 1 kb vicinity of the transcription start site (TSS) of a gene) in NT, IL-15, CAR70–IL-15 and CAR70 NK cells, with colours referring to the number of targets (blue, lowest to yellow, highest count). d, Hallmark gene sets enriched among the CREM targets in CAR70–IL-15 NK cells and proportion of genes in each set that were recovered among the targets. e, GSEA enrichment plots of upregulated and downregulated Hallmark pathways (only direct targets of CREM from ChIP–seq were considered in each Hallmark pathway) in CREM KO versus WT CAR70–IL-15 NK cells by RNA-seq (n = 2 donors); the red dashed lines indicate the top and bottom of the enrichment score. f, Averaged line graphs and heatmaps showing the ATAC–seq signal intensities surrounding the TSS of all genes in CREM KO and WT CAR70–IL-15 NK cells cultured with or without UMRC3 cells for 24 h (1:1 E/T ratio; n = 2 donors). g, Chromatin accessibility tracks for select genes in CREM WT and KO CAR70–IL-15 NK cells in culture with UMRC3 cells from one representative donor. h, GSEA of transcription factor motif families differentially accessible in CREM KO versus WT CAR70–IL-15 NK cells cultured with UMRC3 cells. i, Motif analyses of top open and closed peaks in CREM KO CAR70–IL-15 NK cells cultured with UMRC3 cells. Motif activities were quantified using ChromVar. j, Schematic of CREM-induction pathways in CAR–IL-15 NK cells, and its mechanism as an activation checkpoint. Created in BioRender. Rafei, H. (2025) https://BioRender.com/9ifmaz6. Statistical comparisons were performed using one-sided Fisher’s method with false-discovery rate (FDR) correction (a), one-sided hypergeometric test with FDR correction (d) or GSEA modelling one-sided Kolmogorov–Smirnov test with FDR correction (e,h).
Extended Data Fig. 1
Extended Data Fig. 1. CREM is upregulated in CAR-NK cells following adoptive transfer.
(a) Heatmap of differentially expressed genes (DEGs; adjusted P value < 0.01 and absolute log2 fold change (FC) > 0.5) in CAR19/IL-15 NK cells post-infusion (day 7 and day 14) vs. pre-infusion from scRNA-seq data (Li et al. dataset) based on Raji mouse model presented in Fig. 1; (b) UMAP expression plot of CREM; (c) CREM expression in the pre-infusion CAR-NK cell product and in CAR-NK cells isolated from mice over time; (d) Expression of select genes encoding calcium binding proteins that were identified to be overexpressed in post-infusion NK cells relative to pre-infusion NK cells; (e) UMAP distribution of cell cycle stages in CAR19/IL-15 NK cells; (f) Quantification of CREM expression pre- and post-infusion by stages of the cell cycle; (g) UMAP expression plot of IL-15 activity inferred by CytoSig (refer to Methods); (h) Quantification of IL-15 activity pre- and post-infusion; (i) Quantification of IL-15 activity pre- and post-infusion by stages of the cell cycle; (j) Scatter plot depicting the correlation between CREM and IL-15 activity pre- and post-infusion. Statistical comparisons were performed using one-way ANOVA followed by Tukey’s test for pairwise comparisons (c), one-way ANOVA (f,i), Wilcox Rank Sum test (d,h), and Spearman correlation (j).
Extended Data Fig. 2
Extended Data Fig. 2. CREM is induced by CAR-CD3ζ and interleukin 15 (IL-15) stimulation.
(a) Transduction efficiency of CAR70, CAR70.3ζ.Y6F and CD27 ECD NK cells; ECD: extracellular domain; (b) Whole cell lysates from NT, CAR70, CAR70.3ζ.Y6F and CD27 ECD NK cell groups were analyzed by western blot for phospho-CD3ζ (Y142; pCD3ζ). NK cells were unstimulated (−) or stimulated (+) with CD70 antigen (Ag) for 30 min. β-actin was used as loading control. Representative blot is shown; (c) Densitometry analysis quantifying the relative band intensity of CAR-specific pCD3ζ normalized to loading control (n = 3 donors); (d) CREM expression in NK cells that were either unstimulated or stimulated with IL-2 or IL-15 at increasing concentrations (50, 500, and 5000 pg/ml) for 24 h as assessed by qPCR (n = 3 donors); (e) CREM expression in NK cells stimulated with IL-15 (500 pg/ml) for 24 h in the presence or absence of an IL-15 antagonist (IL-15 Ab) as assessed by qPCR (n = 4 donors); (f) CREM expression in NT and CAR70 NK cells that were either unstimulated or stimulated with either IL-15 (500 pg/ml) or CD70 antigen (Ag) or both for 24 h as assessed by qPCR (n = 3 donors); (g) Representative FACS plot of CREM and IL-15R expression in NK cells stimulated with IL-15 (5000 pg/ml) for 24 h compared to unstimulated cells; (h) Percentage CREM expression in IL-15R+ vs. IL-15R- NK cells stimulated with increasing concentrations of IL-15 (n = 3 donors); (i,j) Longitudinal analysis of CREM (i) and Ki67 (j) expression in NK cells following stimulation with IL-15 (5000 pg/ml), assessed by flow cytometry (n = 3 donors); gMFI FC: geometric mean fluorescence intensity fold change; (k) Longitudinal analysis of CREM expression in NK cells following stimulation with IL-15 (5000 pg/ml), as assessed by qPCR (n = 6 donors); (l) CREM expression in NT and CAR70/IL-15 NK cells both 48 h post-transduction (Before) as well as one week later following expansion with universal antigen presenting cells (uAPCs) and IL-2 (After) as assessed by qPCR (n = 2 donors). ns: non-significant. Statistical comparisons were performed using one-way ANOVA with Tukey correction (a,c,e), two-way ANOVA with Tukey correction (d), and two-way ANOVA (Fisher’s LSD test, f,h,i,j,k,l). Data are represented as mean ± SEM. Source Data
Extended Data Fig. 3
Extended Data Fig. 3. Differential upregulation of the various splicing isoforms of CREM in NK cells.
(a) Overview of the CREM gene. Created in BioRender. Rafei, H. (2025) https://BioRender.com/q33z837; (b) CREM expression in NT and CAR70/IL-15 NK cells using primers designed against CREM-specific exon, ICER-specific exon #1 or ICER-specific exon #2 as assessed by qPCR (n = 11 donors); (c) CREM expression in NK cells stimulated with increasing concentrations of IL-15 using primers designed against CREM-specific exon, ICER-specific exon #1 or ICER-specific exon #2 as assessed by qPCR (n = 10 donors); (d,e) whole cell lysates from CREM wild-type (WT) NT, CREM WT CAR70/IL-15 (d) or CAR.TROP2/IL-15 (e), and CAR-NK cells following CRISPR/Cas9 knockout (KO) using guides targeting the CREM-exon or ICER-exon or both as analyzed by western blot for CREM with β-actin serving as a loading control. ns: non-significant. Statistical comparisons were performed using t-tests (b) and two-way ANOVA with Tukey correction (c). Source Data
Extended Data Fig. 4
Extended Data Fig. 4. CREM is induced in NK cells stimulated by certain cytokines and through CD16, NKp30, and NKp46.
(a) CREM expression in NK cells stimulated with increasing concentrations of indicated cytokines as assessed by qPCR (n = 3 donors); (b) Whole cell lysates from NK cells that were either unstimulated or stimulated with plate-bound anti-CD16, anti-NKp30, or anti-NKp46 antibodies for 30 min were analyzed by western blot for pCD3ζ as well as total CD3ζ. β-actin was used as loading control for the pCD3ζ gel (n = 2 donors); (c) CREM expression in NK cells that were either unstimulated or stimulated with plate-bound anti-CD16 (αCD16), anti-NKp30 (αNKp30), or anti-NKp46 (αNKp46) antibodies for 24 h, assessed by qPCR (n = 9 donors). unstim: unstimulated; ns: non-significant. Statistical comparisons were performed using one-way ANOVA individually for each cytokine (a) and one-way ANOVA (Fisher’s LSD test, c). Data are represented as mean ± SEM. Source Data
Extended Data Fig. 5
Extended Data Fig. 5. CREM expression in NK cells from patient samples and the TCGA.
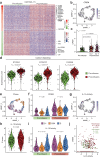
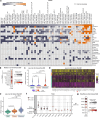
(a) Normalized CREM expression in various cell types from scRNA-seq cancer datasets available from the TISCH2 database (available at http://tisch.comp-genomics.org),. Datasets with available data for NK cell expression were included; (b) CREM expression in tumor-infiltrating NK cells in patients with various cancer types compared to PBMC NK cells from the publicly available dataset GSE245690 (ref. ); (c) CREM expression in tumor-infiltrating NK cells in patients with pancreatic adenocarcinoma in PBMC, primary or metastatic samples from the publicly available dataset GSE156405 (ref. ); (d) Heatmap for the top 50 differentially active regulons (adjusted P < 0.01) for tumor-infiltrating NK cells in metastases samples compared to those in primary samples or PBMC NK cells; (e) CREM regulon activity in the various NK cells; (f) Forest plot depicting CREM overall survival hazard ratios (HRs) across TCGA cancers; (g) Heatmap showing CREM expression across various NK cell clusters from the publicly available dataset (Rebuffet et al.) Statistical comparisons were performed using pairwise Wilcoxon rank‐sum tests followed by Bonferroni correction for multiple comparisons (c,e).
Extended Data Fig. 6
Extended Data Fig. 6. CREM is expressed in CAR70/IL-15 NK cells upon encounter with CD70+ tumor cells and is associated with an activated phenotype.
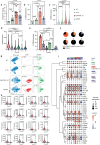
(a) CREM expression in non-transduced (NT), IL-15, CAR70/IL-15, and CAR70 NK cells as assessed by qPCR (n = 8 donors); (b) Percentage of CREM positive cells in live CD45+ GFP- CD56+ NK cells from NT, IL-15, CAR70/IL-15, and CAR70 NK cells following 24 h coculture with UMRC3 tumor cells at an effector-to-target (E:T) ratio of 1:1 as assessed by mass cytometry (n = 3 donors); (c) Violin plots of CREM expression in the various NK cell conditions at the single cell level as assessed by mass cytometry (n = 3 donors); the gray dashed line represents the median expression in NT NK cells; (d) Violin plots of CREM expression at the single cell level compared between the various clusters of the merged tSNE_CUDA analysis of the various conditions (n = 3 donors); (e) Percentage of CREM positive NK cells in the tSNE_CUDA clusters (n = 3 donors); (f) Frequencies of NK cells expressing CREM in the tSNE_CUDA clusters (colored portion); the degree of the color reflects the robust z-score of CREM expression in the corresponding cluster on a scale ranging from dark orange (z = +1) to dark blue (z = −1); (g) Total cells (blue), cells expressing the CAR (based on CD27 staining; red) and CREM (green) are shown on the tSNE_CUDA plots. Inset numbers indicate the percentages (%) of CAR expression on and CREM expression in the corresponding NK cell conditions; (h) Violin plots of expression of select markers of activation, inhibition as well as checkpoints in NK cells from clusters 1 (most abundant in CAR70/IL-15 NK cells) and 5 (most abundant in NT NK cells) at the single cell level as assessed by mass cytometry (n = 3 donors); (i) Heatmap showing expression of key NK cell phenotypic markers on fractions of positive CREM expression (CREM+) and negative CREM expression (CREM-) in the various NK cell conditions. Expression of each marker is represented by the robust z-score for the expression normalized across the conditions with a color scale ranging from blue (z = −1) to orange (z = +1) and the size of the circle for percentage expression. GZMB: granzyme B. ns: non-significant. Statistical comparisons were performed using one-way ANOVA (Fisher’s LSD test, a-e), t-tests (h), and one minus pearson hierarchical clustering (i). Data are represented as mean ± SEM. Source Data
Extended Data Fig. 7
Extended Data Fig. 7. IL-15 and CD16, NKp30, and NKp46 stimulations of NK cells lead to CREB phosphorylation; and CREM regulation by STAT3 and STAT5.
(a) Representative FACS plots of NK cells showing pCREB levels under the denoted conditions; (b) pCREB expression by phospho-flow cytometry in NK cells that were either untreated (−) or treated (+) with plate-bound anti-CD16, anti-NKp30, or anti-NKp46 for stimulation for 30 min, the PKA inhibitor H89, or the calcium chelator EGTA as indicated prior to profiling (n = 3 donors); (c) PKA activity assessed in whole cell lysates from NT NK cells that were either unstimulated or stimulated for 30 min with increasing concentrations of IL-15 (n = 3 donors); (d,e) pCREB expression by phospho-flow cytometry in NT NK cells that were either unstimulated or stimulated for 30 min with increasing concentrations of IL-15 (50, 500, and 5000 pg/ml) in the presence or absence of the PKA inhibitor H89 for up to 2 h prior to stimulation (n = 5 donors); FSK: forskolin; gMFI FC: geometric mean fluorescence intensity fold change; control: unstained; (f) pCREB expression by phospho-flow cytometry in NT NK cells that were either unstimulated or stimulated for 30 min with increasing concentrations of IL-15 in the presence or absence of the calcium chelator EGTA for up to 2 h prior to stimulation (n = 3 donors); (g) CREM expression as assessed by qPCR in NT NK cells that were either unstimulated or stimulated for 24 h with IL-15 (500 pg/ml) in the presence or absence of EGTA during the stimulation time (n = 3 donors); (h,i) Whole cell lysates from NT NK cells following 30 min stimulation with increasing doses of IL-15 as analyzed by western blot for phospho- and total STAT3 (h) and STAT5 (i) with β-actin serving as a loading control (n = 3 donors); (j,k) Whole cell lysates from NT, CAR70/IL-15, and CAR70 NK cells following stimulation of the CAR for 30 min as analyzed by western blot for phospho- and total STAT3 (j) and STAT5 (k) with β-actin serving as a loading control (n = 2 donors); (l,m) Whole cell lysates from NK cells that were either wild-type (WT) or knockout (KO) for STAT3 (l) or STAT5a/STAT5b (m) as analyzed by western blot for total STAT3 (l) and STAT5 (m) with β-actin serving as a loading control for STAT3 (l) and STAT5a (m) gels (n = 3 donors); (n) CREM expression in NK cells that were either WT, STAT3 KO, STAT5a/b KO, or CREM KO that were either unstimulated or stimulated with IL-15 (5000 pg/ml), assessed by qPCR (n = 5 donors); (o,p) ChIP-qPCR for the enrichment for pSTAT3 (o) and STAT5b (p) in the promoter region of CREM as well as a positive control promoter (STAT3 for both) in NT NK cells incubated for 1 h in the absence or presence of IL-15 (n = 4 donors). ns: non-significant; unstim: unstimulated. Statistical comparisons were performed using two-way ANOVA with Tukey correction (b,n), one-way ANOVA (Fisher’s LSD test, c), multiple t-tests with Holm-Šídák correction (e,f), one-way ANOVA with Tukey correction (g), and t-tests (o,p). Data are represented as mean ± SEM. Source Data
Extended Data Fig. 8
Extended Data Fig. 8. CREM KO improves CAR-NK cell function in multiple tumor models.
(a,b) Spheroid killing assay of GFP+ UMRC3 cells by CREM WT NT, CREM WT CAR70/IL-15, and CREM KO CAR70/IL-15 NK cells at an E:T ratio of (a) 1:1 and (b) 2:1 (n = 3 donors per group; the assays at the different E:T ratios were performed as part of the same experiment using the same donors as the ones used in Fig. 3a). The spheroid green image mean determines the spheroid growth over time. Data were normalized to the spheroid green image mean at T = 0 when the spheroid was formed and before adding the NK cells (black arrow); the bar graphs show the area under the curve (AUC) for the normalized spheroid green image mean (n = 3 donors); (c) Spheroid killing assay of GFP+ BCX.010 cells by CREM WT NT, CREM WT CAR70/IL-15, and CREM KO CAR70/IL-15 NK cells (n = 2 donors). Data were quantified and normalized as in (a,b); (d) Impedance killing assay of SKOV3 cells by CREM WT NT, CREM WT CAR.TROP2/IL-15, and CREM KO CAR.TROP2/IL-15 NK cells over time by xCELLigence device (n = 2 donors). The cell index which reflects tumor growth was normalized to the time of NK cell addition (black arrow); (e) KO efficiency of CREM in NT, IL-15, CAR70/IL-15 and CAR70 NK cells as assessed by PCR followed by gel electrophoresis; (f) Histograms of CD70 expression by flow cytometry in CD70 WT vs. CD70 KO UMRC3 cells; FMO: fluorescence minus one (negative control); (g) Impedance killing assay of CD70 WT or CD70 KO UMRC3 cells by NT, IL-15, CAR70/IL-15, or CAR70 NK cells that are either CREM WT or CREM KO (n = 2 donors). The cell index which reflects tumor growth was normalized to the time of NK cell addition (black arrow); (h) Impedance killing assay of UMRC3 cells by CREM WT or CREM KO NT NK cells that were either unstimulated or stimulated by incubation with increasing concentrations of IL-15 (50, 500, or 5000 pg/ml) for 24 h prior to adding them to UMRC3 cells plated the day before in xCELLigence device (n = 3 donors). The cell index which reflects tumor growth was normalized to the time of NK cell addition (black arrow). ns: non-significant. Statistical comparisons were performed using one-way (a-right,b-right) or two-way ANOVA with Tukey correction (a-left,b-left,c,d,g,h), Data are represented as mean ± SEM. Source Data
Extended Data Fig. 9
Extended Data Fig. 9. CREM KO improves CAR-NK cell function in multiple in vivo models.
(a) Body weight of the mice over time in the various groups in experiment depicted in Fig. 4a (n = 5 mice/group); (b) Ex vivo cytotoxicity of CREM WT and CREM KO CAR70/IL-15 NK cells harvested from mice sacrificed at day 10 and day 20 following NK cell infusion compared to the infusion products against mCherry+ K562 (n = 5 mice in each group); (c) Representative images from the assay in (b) at day 10; (d) Ex vivo cytotoxicity of CREM WT and CREM KO CAR70/IL-15 NK cells harvested from mice sacrificed at day 10 and day 20 following infusion compared to the infusion products against GFP+ Raji (n = 5 mice in each group); (e) Representative images from the assay in (d) at day 10; (f) Heatmap for the concentrations of the various cytokines in the serum of mice from day 10 and day 20 post-infusion in pg/ml; (g) Representative H&E staining of full lung sections from mice injected intravenously with BCX.010 PDX cell line and treated with CREM WT NT, CREM WT CAR70/IL-15, or CREM KO CAR70/IL-15 NK cells from the timed sacrifice experiment depicted in Fig. 4g; (h) Body weight of the mice over time in the various groups of the survival experiment depicted in Fig. 4g; (i) Quantification of flow cytometry analysis of the number of hCD45 + CD56 + CD16 + CAR+ (CD27 + ) cells (a marker of CAR+ NK cell engraftment) in the blood of mice 10 or 20 days after NK cell infusion in the various groups; data in (h) and (i) were pooled from two CB donors (n = 4 mice in BCX.010 alone group and n = 10 mice in each of the NT, CREM WT CAR70/IL-15 and CREM KO CAR70/IL-15 groups with 5 mice/CB donor); (j) Schematic illustration of the in vivo experimental plan for the PATC148 orthotopic mouse model. Created in BioRender. Rafei, H. (2025) https://BioRender.com/ryvr1mz; (k) Number of pancreatic tumor nodules in mice that were treated with CREM WT or KO CAR.TROP2/IL-15 NK cells (n = 4-5 mice per group); (l) Graph depicting flow cytometry analysis of the number of hCD45+ CD56+ CD16+ cells (a marker of NK cell engraftment) in the blood of mice 10 or 20 days after NK cell infusion in the CREM WT or KO CAR.TROP2/IL-15 NK cell groups (n = 4-5 mice per group). ns: non-significant. Statistical comparisons were performed using two-way ANOVA with Tukey correction (a,b-left,d-left,h,i), two-way ANOVA (b-right,d-right); two-tailed t-test (k), and two-way ANOVA (Fisher’s LSD test, l). Data are represented as mean ± SEM. Source Data
Extended Data Fig. 10
Extended Data Fig. 10. CREM KO CAR70/IL-15 NK cells do not cause toxicity in mice in a patient-derived xenograft (PDX) mouse model of metastatic breast cancer.
(a) Hematoxylin and eosin [H&E] stained tissues from mice treated with either CREM KO CAR70/IL-15 NK cells (in BCX.010 tumor-bearing (n = 5 mice) or non-tumor bearing (n = 3 mice) mice) or CREM WT CAR70/IL-15 NK cells in BCX.010 bearing mice (n = 3 mice). Mice were euthanized on day 14 post-treatment. Magnification: 10x. Scale bar: 100 μm; (b-d) Assessment of blood cell populations (b), kidney (c) and liver (d) function parameters in the blood of mice engrafted with BCX.010 tumors, at day 30 post-treatment with CREM WT CAR70/IL-15 NK cells (n = 4 mice) or CREM KO CAR70/IL-15 NK cells (n = 5 mice). WBC, white blood cells; HGB, hemoglobin; BUN, blood urea nitrogen; ALP, alkaline phosphatase; ALT, alanine transaminase; AST, aspartate aminotransferase; LDH, lactate dehydrogenase; ns, non-significant. Statistical comparisons were performed using Student’s t-test (b-d). Data are represented as mean ± SEM. Source Data
Extended Data Fig. 11
Extended Data Fig. 11. CREM modulates NK cell function through its transcriptional and epigenetic activities.
(a) UpSet plots of CREM binding sites in NT, IL-15, and CAR70 NK cells from one representative donor (same donor used to generate CAR70/IL-15 NK cells in Fig. 5b) as analyzed by CREM ChIP-seq; (b) Hallmark gene sets enriched in the CREM targets in NT, IL-15, and CAR70 NK cells and the proportion of genes in each set that was recovered among the targets (n = 3 donors per group); (c) Gene set enrichment analysis (GSEA) enrichment plot of upregulated and downregulated direct targets of CREM (based on CREM ChIP-seq data from CAR70/IL-15 NK cells) in CREM KO vs. CREM WT CAR70/IL-15 NK cells as assessed by bulk RNA-seq (n = 2 donors); (d) Venn diagram of the overlap between 2 donors in CREM ChIP-seq targets in CAR70/IL-15 NK cells that are downregulated (top) or upregulated (bottom) in CREM KO CAR70/IL-15 NK cells; (e) GSEA bar plots of downregulated (top) and upregulated (bottom) pathways (only direct targets of CREM from CREM ChIP-seq in CAR70/IL-15 NK cells were considered in each pathway) in CREM KO CAR70/IL-15 NK cells as assessed by bulk RNA-seq (n = 2 donors); (f) GSEA enrichment plots of upregulated and downregulated pathways (only direct targets of CREM from CREM ChIP-seq in CAR70/IL-15 NK cells were considered in each pathway) in CREM KO vs. CREM WT CAR70/IL-15 NK cells as assessed by bulk RNA-seq (n = 2 donors); (g) Hallmark gene sets reflecting enriched pathways in gained and lost accessible chromatin peaks in CREM KO CAR70/IL-15 NK cells in coculture with UMRC3 tumor cells as analyzed by ATAC-seq (n = 2 donors); GSEA was used for pathway enrichment between gained and lost accessible chromatin peaks; (h) GSEA analyses reflecting enriched Hallmark gene sets in accessible peaks in CREM KO vs. WT CAR70/IL-15 NK cells in coculture with tumor cells; (i) Chromatin accessibility tracks for select genes in CREM WT (top) vs. CREM KO (bottom) CAR70/IL-15 NK cells in coculture with UMRC3 cells from one representative donor; (j) Heatmap and hierarchical clustering of differentially accessible transcription factor motifs in CREM WT and CREM KO CAR70/IL-15 NK cells with UMRC3 tumor cell coculture. Heatmap was generated by merging data from two donors; NES: normalized enrichment score. Statistical comparisons were performed using one-sided hypergeometric test with FDR correction (b), and GSEA modeling one-sided Kolmogorov-Smirnov test with FDR correction (c,e-h).
Extended Data Fig. 12
Extended Data Fig. 12. CREM KO does not impact IL-15 receptor (IL-15R) proximal signaling but enhances the metabolic fitness of CAR70/IL-15 NK cells.
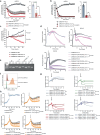
(a) Whole cell lysates from NK cells that were either wild-type (WT) or knockout (KO) for CREM 0, 30 min and 2 h following stimulation with IL-15 (5000 pg/ml) as analyzed by western blot for IL-15R proximal signaling components. β-actin serves as a loading control (n = 5 donors); (b) Densitometry analysis quantifying the relative band intensity of pSTAT3 and pSTAT5 normalized to total STAT3 and STAT5, respectively (n = 5 donors); (c) CISH expression in NK cells that were either WT or CREM KO that were either unstimulated or stimulated with IL-15, assessed by qPCR (n = 3 donors); (d-f) Measures of extracellular acidification rate (ECAR) upon addition of glucose, oligomycin (oligo), and 2-deoxy-D-glucose (2-DG) (d) and quantified basal glycolysis (e) and glycolytic capacity (f) of NK cells in the indicated groups (n = 3 donors); (g-i) Measures of oxygen consumption rate (OCR) upon addition of oligo, FCCP, and rotenone and antimycin A (R/A) (g) and quantified basal respiration (h) and maximal respiration (i) of NK cells in the various conditions (n = 3 donors). ns: non-significant. Statistical comparisons were performed using two-way ANOVA with Šídák correction (b,c), and one-way ANOVA with Tukey correction (e,f,h,i). Data are represented as mean ± SEM. Source Data

References

    1. Li, Y., Rezvani, K. & Rafei, H. Next-generation chimeric antigen receptors for T- and natural killer-cell therapies against cancer. Immunol. Rev.320, 217–235 (2023). - PMC - PubMed
    1. Liu, E. et al. Use of CAR-transduced natural killer cells in CD19-positive lymphoid tumors. N. Engl. J. Med.382, 545–553 (2020). - PMC - PubMed
    1. Marin, D. et al. Safety, efficacy and determinants of response of allogeneic CD19-specific CAR-NK cells in CD19+ B cell tumors: a phase 1/2 trial. Nat. Med.30, 772–784 (2024). - PMC - PubMed
    1. Lanier, L. L. Up on the tightrope: natural killer cell activation and inhibition. Nat. Immunol.9, 495–502 (2008). - PMC - PubMed
    1. Cózar, B. et al. Tumor-infiltrating natural killer cells. Cancer Discov.11, 34–44 (2021). - PMC - PubMed

MeSH terms

Substances

LinkOut - more resources