. 2025 Jun 4;26(1):561.
doi: 10.1186/s12864-025-11750-3.

Integrated transcriptomic and metabolomic analyses reveal tissue-specific accumulation and expression patterns of monoterpene glycosides, gallaglycosides, and flavonoids in Paeonia Lactiflora Pall

Affiliations

Integrated transcriptomic and metabolomic analyses reveal tissue-specific accumulation and expression patterns of monoterpene glycosides, gallaglycosides, and flavonoids in Paeonia Lactiflora Pall

Pan Xu et al. BMC Genomics. .

Abstract

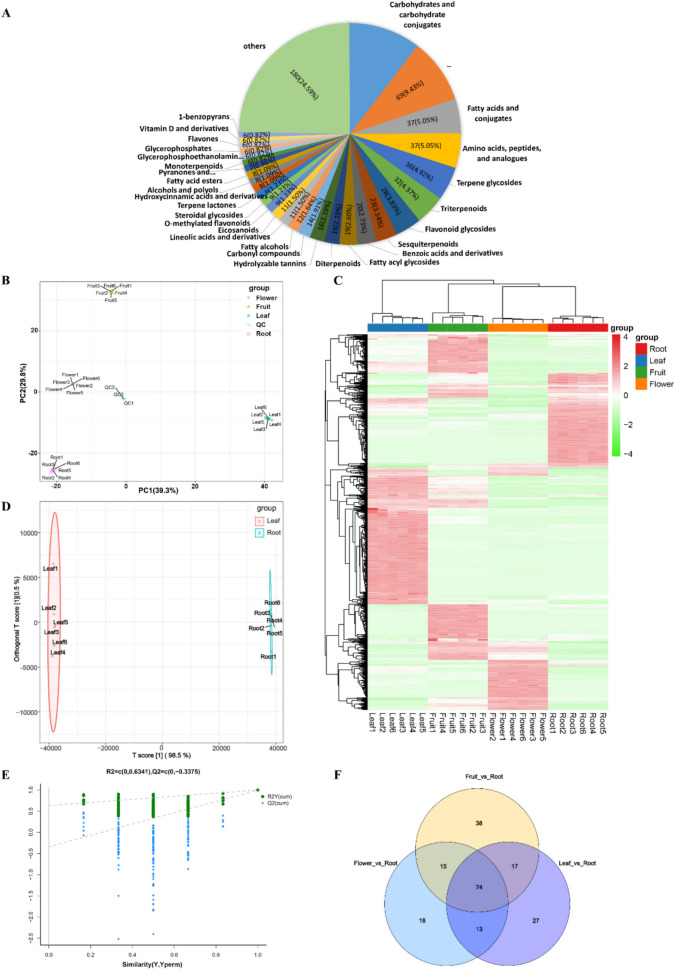
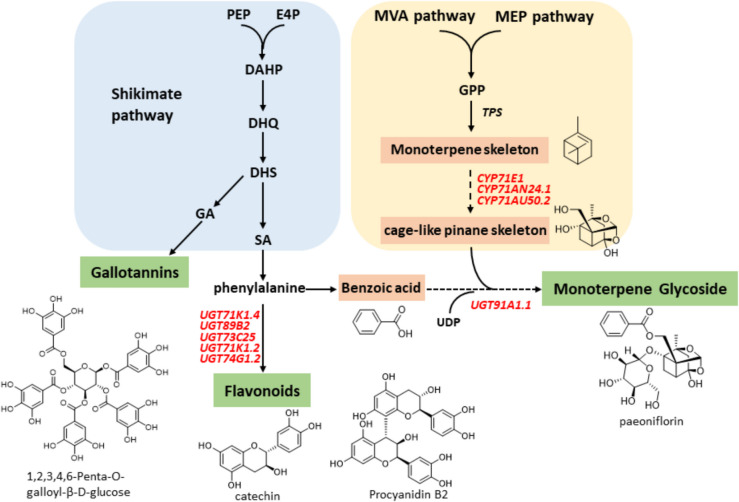
Background: Paeonia lactiflora Pall. (PL) is widely recognized for its ornamental, edible, and medicinal properties. Its principle bioactive constituents include monoterpene glycosides (MGs), gallaglycosides (GGs), and flavonoids. However, the metabolic and molecular basis underlying their biosynthesis in PL remain poorly understood. In this study, an integrated non-targeted metabolomics and transcriptomics approach was employed to investigate the metabolic profiles and gene expression patterns in four distinct PL tissues.

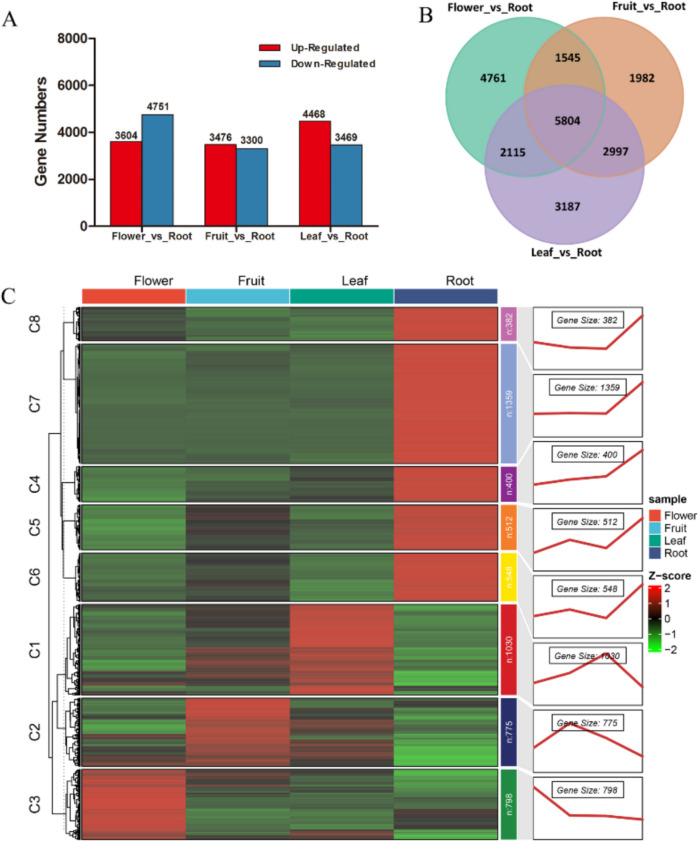
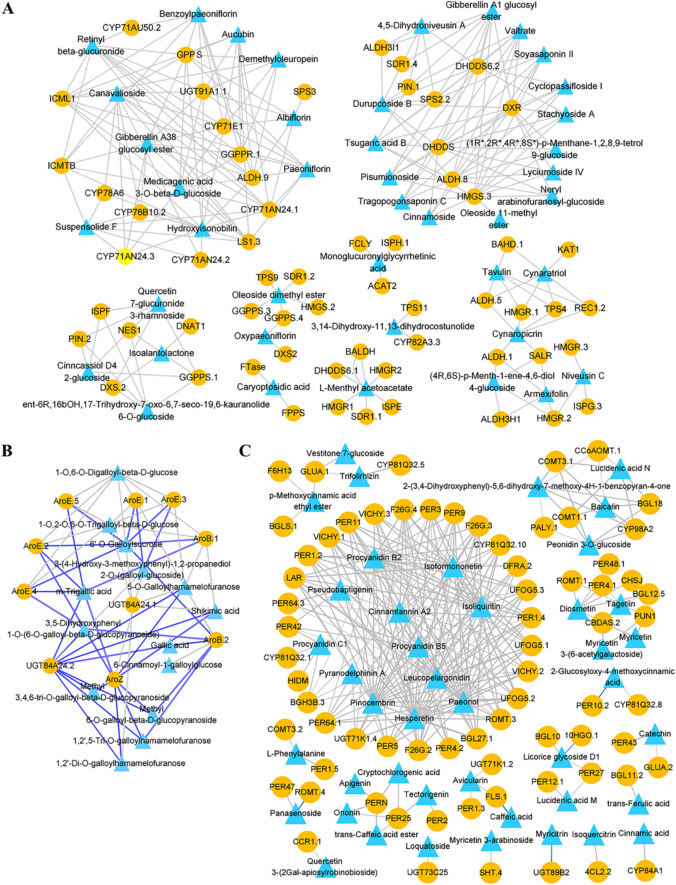
Results: Metabolomic and transcriptome profiling revealed tissue-specific patterns of metabolite accumulation and gene expression. KEGG enrichment analysis of differentially expressed metabolites (DEMs) showed that secondary metabolites biosynthesis and transport processes play vital roles in the tissue-specific accumulation of bioactive constituents. A total of 19 DEMs and 90 differentially expressed genes (DEGs) associated with MGs, 10 DEMs and 14 DEGs associated with GGs, and 205 DEMs and 67 DEGs associated with flavonoids were identified. Roots, the primary medicinal tissue, exhibited substantial accumulation of eight MGs, two GGs, and 18 flavonoids, as well as elevated expression levels of 16, two and nine structural genes, respectively. Nine CYP450 s and two UGTs associated with MGs, and 14 UGTs associated with flavonoids, were identified as new candidate genes through phylogenetic and expression analyses. CYP71E1, CYP71 AN24.1, CYP71 AU50.2, and UGT91 A1.1 for MGs biosynthesis, and UGT71 K1.4, UGT89B2, UGT73 C25, and UGT71 K1.2 for flavonoids biosynthesis were prioritized through correlation analysis. WGCNA revealed that turquoise, green, and blue modules were significantly correlated with MGs and flavonoids biosynthesis, identifying 24 hub genes for MGs and 18 for flavonoids. The overlap of phylogenetic, expression, correlation and WGCNA analyses identified CYP71 AN24.1 and UGT91 A1.1 as putative MGs biosynthetic genes, and UGT89B2 as a flavonoid-related gene. Protein structure prediction and similarity analysis further supported their functional conservation with known terpenoid-modifying enzymes and flavonoid-specific glycosyltransferases, respectively.

Conclusions: These findings identified CYP71 AN24.1, UGT91 A1.1, and UGT89B2 as novel genes involved in MGs and flavonoids biosynthesis. The study provides a valuable theoretical foundation for future metabolic engineering aimed at optimizing the biosynthetic pathways of these primary active constituents in PL.

Keywords: Paeonia Lactiflora; Biosynthesis; Flavonoids; Gallaglycoside; Metabolomic; Monoterpene glycosides; Transcriptome.


Conflict of interest statement

Declarations. Ethics approval and consent to participate: Not applicable. Consent for publication: Not applicable. Competing interests: The authors declare no competing interests.

Figures

Fig. 1
Fig. 1
Classification and differential metabolites analysis of Paeonia Lactiflora Pall. A Classification of Paeonia Lactiflora Pall. compounds based on the HMDB database. B Principal component analysis (PCA) Scores Plot among different tissues (flower, fruit, leaf, root). C Heatmap based on hierarchical clustering analysis among different tissues (flower, fruit, leaf, root). Upregulated and downregulated genes are shown in red and green, respectively. D Orthogonal projection to latent structures discriminant analysis (OPLS-DA) scores plot between leaf and root. E Response permutation test plot (n = 6) for the OPLS-DA model between leaf and root. F Venn diagram of DEMs in the Flower_vs_Root, Fruit_vs_Root, and Leaf_vs_Root groups
Fig. 2
Fig. 2
K-means clustering analysis of differentially expressed metabolites (DEMs) among four tissues (root, leaf, fruit, flower)
Fig. 3
Fig. 3
KEGG enrichment analysis of DEMs in four tissues of Paeonia Lactiflora Pall. A Flower_vs_Root, (B) Fruit_vs_Root, (C) Leaf_vs_Root. Numbers indicate enriched metabolites in each term, the Top 20 most significant categories with p value < 0.05 are shown
Fig. 4
Fig. 4
Differentially expressed genes (DEGs) in three comparison groups (Flower_vs_Root, Fruit_vs_Root, Leaf_vs_Root). A Number of significant upregulated and downregulated DEGs across comparisons. Venn diagram of overlapping DEGs among three comparison groups. C Cluster analysis of DEGs illustrating expression trends across modules
Fig. 5
Fig. 5
Phylogenetic analysis of CYP450 s (A) and UGTs (B). Phylogenetic trees were constructed using Muscle alignment and the Maximum-likelihood method. Bootstrap analysis (1000 replicates) was used to evaluate tree quality. Different CYP450 s and UGTs families were color-coded. The outer heatmap in the CYP450 s phylogenetic tree illustrated differential expression levels across four tissues. Expression data were normalized and centered, ranging from −2 to 2
Fig. 6
Fig. 6
Schematic diagram of the proposed monoterpene glycosides (MGs) biosynthesis pathway, including mevalonate (MVA) pathway, methylerythritol 4-phosphate (MEP) pathway, benzoic acid biosynthesis (non-β-oxidative and core β-oxidative) pathway, and monoterpene modification and glycosylation. DEMs are highlighted in red font alongside heatmaps; DEGs are labeled in black font alongside heatmaps. Solid arrows represent single-step reactions; and dashed arrows represent multi-step reactions. Black and red abbreviations adjacent to arrows indicate validated and unverified enzymes, respectively. Corresponding full enzyme names and compounds names are provided in the Abbreviations section
Fig. 7
Fig. 7
Schematic diagram of the proposed gallaglycosides (GGs) biosynthesis pathway. DEMs are highlighted in red font alongside heatmaps; DEGs are labeled in black font alongside heatmaps. Solid arrows represent single-step reactions; and dashed arrows represent multi-step reactions. Black and red abbreviations adjacent to arrows indicate validated and unverified enzymes, respectively. Corresponding full enzyme names and compounds names are provided in the Abbreviations section
Fig. 8
Fig. 8
Schematic diagram of the proposed flavonoids biosynthesis pathway. DEMs are highlighted in red font alongside heatmaps; DEGs are labeled in black font alongside heatmaps. Solid arrows represent single-step reactions; and dashed arrows represent multi-step reactions. Black and red abbreviations adjacent to arrows indicate validated and unverified enzymes, respectively. Corresponding full enzyme names and compounds names are provided in the Abbreviations section
Fig. 9
Fig. 9
Correlation network of DEGs and DEMs related to (A) monoterpene glycosides (MGs), (B) gallaglycosides (GGs), and (C) flavonoids. Yellow circles represent DEGs and blue triangles represent DEMs. Grey edges indicate positive correlations, and blue edges indicate negative correlations between DEGs and DEMs
Fig. 10
Fig. 10
Correlation analysis between modules and physiological traits using WGCNA. A Gene clustering dendrogram; and (B) Module heatmap of 6028 unigenes among tissues. C Relationships between module and constituent contents. D Eigengenes expression patterns of seven WGCNA clustering modules across tissues. E KEGG enrichment scatterplots of turquoise, green, and blue modules
Fig. 11
Fig. 11
Co-expression networks of the top 20 DEGs related to MGs and flavonoid in different modules by WGCNA. A-C Co-expression network of MGs. D-F Co-expression network of flavonoids. A, D Turquoise module. B, E Green module; C, F Blue module
Fig. 12
Fig. 12
Structural prediction and similarity analysis. A-C Predicted tertiary 3D structures of CYP71 AN24.1, UGT91 A1.1 and UGT89B2. D-F Superimposed structures of CYP71 AN24.1 and PmCYP71 AN24, UGT91 A1.1 and GpUGT91 A1, UGT89B2 and SrUGT89B2
Fig. 13
Fig. 13
Correlation analysis between qRT-PCR and RNA-seq results. r represents Pearson`s correlation coefficient, p < 0.05 indicates statistical significance
Fig. 14
Fig. 14
Schematic networks of main active constituent biosynthesis in Paeonia lactiflora Pall. Red fonts indicate novel candidate genes

References

    1. Tan YQ, Chen HW, Li J, Wu QJ. Efficacy, chemical constituents, and pharmacological actions of Radix Paeoniae Rubra and Radix Paeoniae Alba. Front Pharmacol. 2020;11:1054. 10.3389/fphar.2020.01054. - PMC - PubMed
    1. Parker S, May B, Zhang C, Zhang AL, Lu C, Xue CC. A pharmacological review of bioactive constituents of Paeonia lactiflora Pall. and Paeonia veitchii Lynch. Phytother Res. 2016;30:1445–73. 10.1002/ptr.5653. - PubMed
    1. Ma X, Wen JX, Gao SJ, He X, Li PY, Yang YX, et al. Paeonia lactiflora Pall. regulates the NF-κB-NLRP3 inflammasome pathway to alleviate cholestasis in rats. J Pharma Pharmacol. 2018;70:1675–87. 10.1111/jphp.13008. - PubMed
    1. Lee HS, Kim Y. Paeonia lactiflora inhibits cell wall synthesis and triggers membrane depolarization in Candida albicans. J Microbiol Biotechnol. 2017;27:395–404. 10.4014/jmb.1611.11064. - PubMed
    1. Zhao Y, Zhang Y, Kong H, Zhang M, Cheng J, Wu J, et al. Carbon dots from paeoniae radix alba carbonisata: hepatoprotective effect. Int J Nanomedicine. 2020;15:9049–59. 10.2147/IJN.S281976. - PMC - PubMed

LinkOut - more resources