Comparative Study
. 2025 Jun 4;26(1):560.
doi: 10.1186/s12864-025-11648-0.

Comparative study on the mechanism of yellow petal formation in Paphiopedilum armeniacum: an integrated transcriptomic and metabolomic analysis of three Paphiopedilum species

Affiliations
Comparative Study

Comparative study on the mechanism of yellow petal formation in Paphiopedilum armeniacum: an integrated transcriptomic and metabolomic analysis of three Paphiopedilum species

Yaqin Ye et al. BMC Genomics. .

Abstract

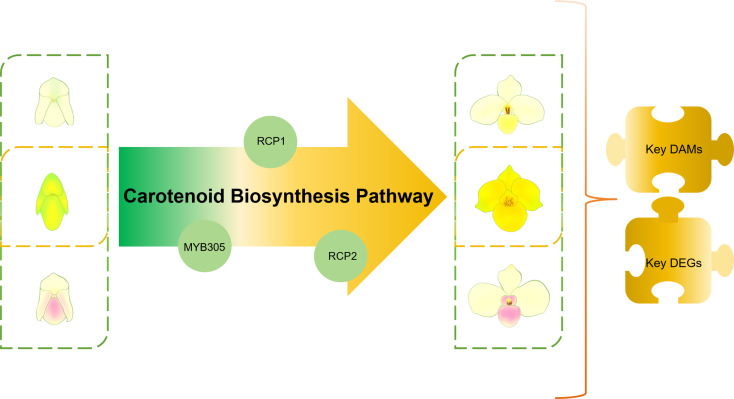
Backgrounds: Paphiopedilum orchids, particularly the Chinese endemic Paphiopedilum armeniacum, are prized for their commercial and ornamental value, with the latter serving as a vital breeding resource owing to its distinctive yellow petals. However, the molecular mechanisms underlying yellow petal formation remain unclear.

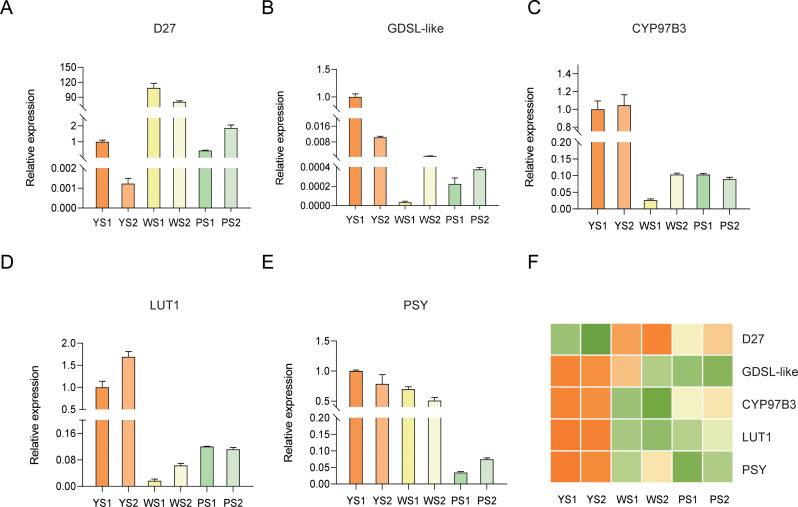
Results: This work employed an integrated transcriptomic and metabolomic comparative analysis of P. armeniacum and two lighter-colored Paphiopedilum species (The sepals and petals are white.) to identify carotenoid-related differentially expressed genes and metabolites before and after blooming in all three species. Metabolomic analysis revealed a marked increase in six differential metabolites, including zeaxanthin, precorrin 2, and β-D-gentiobiosyl crocetin, in P. armeniacum, highlighting their critical role in yellow petal formation. Transcriptomic comparison identified 40 DEGs (including D27, GDSL-like, CYP97B3, LUT1, and PSY) linked to yellow pigmentation, most of which were consistently upregulated in P. armeniacum before and after blooming Integrative metabolomic and transcriptomic analyses demonstrated significant correlations between these genes and metabolites, suggesting their role in regulating carotenoid synthesis and accumulation in yellow petal formation. Furthermore, qRT-PCR elucidates the expression levels of candidate genes, identifying RPL13AD as the optimal reference gene across these three orchid species.

Conclusions: These works elucidate the expression patterns and regulatory roles of carotenoid-related genes in metabolic pathways during P. armeniacum blooming, providing new insights into the molecular mechanisms of carotenoid-mediated plant coloration.

Keywords: Biochemical pathways; Carotenoids; Orchid; RNA sequencing.


Conflict of interest statement

Declarations. Ethics approval and consent to participate: Not applicable. Consent for publication: Not applicable. Competing interests: The authors declare no competing interests.

Figures

Fig. 1
Fig. 1
Graphical Abstract. This study compares the transcriptomes and metabolomes of P. armeniacum and two light-colored species at two developmental stages to identify carotenoid-related genes and metabolites responsible for P. armeniacum’s bright yellow pigmentation. The research will then be expanded to predict associated transcription factors and explore their correlations
Fig. 2
Fig. 2
Comparative Metabolomic Analysis of Three Paphiopedilum Species Across Flowering Stages. (A) PCA of Three Paphiopedilum Species. Assessing inter-group differences among the three Paphiopedilum Species. Color codes: Red-Pink: YS1, Dark Yellow: YS2, Green: WS1, Cyan: WS2, Blue: PS1, Purple: PS2. (B) HCA Heatmap of Three Paphiopedilum Species. The clustering of the three Paphiopedilum Species reflects their similar metabolite expression patterns. The color of the samples has the same meaning as (A). (C) Volcano plots showing DAMs between P. armeniacum and P. emersonii, and between P. armeniacum and P. delenatii at respective pre- and post-bloom stages. (D) Venn diagram of yellow DAMs before blooming. Common DAMs between P. armeniacum and two light-colored Paphiopedilum species before blooming of Paphiopedilum. (E) Venn diagram of yellow DAMs after blooming. Common DAMs between Paphiopedilum and two light-colored Paphiopedilum species after blooming of Paphiopedilum. (F) Relative contents of Five DAMs in Three Paphiopedilum Species
Fig. 3
Fig. 3
Transcriptomic and Functional Analysis of Carotenoid-related Genes in Three Paphiopedilum Species During Flowering Transition. (A) Venn diagram of DEGs before blooming. Common DEGs between P. armeniacum and two light-colored Paphiopedilum species before blooming of Paphiopedilum. (B) Venn diagram of yellow DEGs after blooming. Common DEGs between Paphiopedilum and two light-colored Paphiopedilum species after blooming of Paphiopedilum. (C) GO enrichment results of 150 carotenoid-related genes. (D) KEGG enrichment results of pathway genes related to 150 carotenoid genes. (E) Heatmap of Carotenoid-Related Differential Gene Metabolic Pathways in Three Orchid Species. GGPP, geranylgeranyl diphosphate; PSY, phytoene synthase; PDS, phytoene desaturase; Z-ISO, ζ -carotene isomerase; ZDS, ζ -carotene desaturase; CrtISO, carotenoid isomerase; LCYE, lycopeneε-cyclase; LCYB, lycopene β-cyclase; BCH, β-carotene hydroxylase; CYP97A, cytochrome P450 carotene β-hydroxylase; CYP97C, cytochrome P450 carotene ε-hydroxylase; ZEP, zeaxanthin epoxidase; VDE, violaxanthin de-epoxidase; NXY, neoxanthin synthase; CCD, carotenoid cleavage dioxygenase; NCED, 9-cis-epoxycarotenoid dioxygenase; ABA, abscisic acid
Fig. 4
Fig. 4
Regulatory Network and Correlation Analysis of Carotenoid Biosynthesis in Three Paphiopedilum Species. (A) Correlation Network of Transcription Factors and Differential Carotenoid Functional Genes. Blue nodes represent MYB305, and reddish-brown nodes represent RCP1. Key genes in the CBP metabolic pathway are divided into two clusters around CRTISO: orange-red and orange-yellow sections. (B) Pearson Correlation Heatmap of 6 Key Differential Metabolites and 40 Differential Genes. *: P ≤ 0.05, **: P≤ 0.01, ***: P≤ 0.001
Fig. 5
Fig. 5
qRT-PCR Results of Five Genes in P. armeniacum, with Expression Levels Normalized to RPL13AD Expression in YS1. (A) qRT-PCR results for D27 (B) qRT-PCR results for GDAL-like (C) qRT-PCR results for CYP97B3 (D) qRT-PCR results for LUT1 (E) qRT-PCR results for PSY (F) Heatmap of gene expression levels for the five genes based on transcriptome sequencing. The progressive darkening of orange corresponds to increased degrees of gene up-regulation, while intensifying green coloration indicates stronger down-regulation, with pale yellow denoting baseline expression levels showing no statistically significant changes
Fig. 6
Fig. 6
Morphology of Three Paphiopedilum Species at Various Stages. (A) P. armeniacum before blooming (YS1). (B) P. emersonii before blooming (WS1). (C) P. delenatii before blooming (PS1). (D) P. armeniacum after blooming (YS2). (E) P. emersonii after blooming (WS2). (F) P. delenatii after blooming (PS2)

Similar articles

References

    1. Teoh ES. Orchids of Asia. 3rd ed. Singapore: Times Editions-Marshall Cavendish; 2005.
    1. Wang M, Li SZ, Chen LJ, Li J, Li LQ, Rao WH, et al. Conservation and reintroduction of the rare and endangered Orchid Paphiopedilum armeniacum. Ecosyst Health Sustain. 2021;7(1):1903817.
    1. Mou ZMM, Yang N, Li SY, Hu H. Nitrogen requirements for vegetative growth, blooming, seed production, and Ramet growth of Paphiopedilum Armeniacum (Orchid). HortScience. 2012;47:585–8.
    1. Chen XQ, Stephan W. Flora of China. Vol. 25, Orchidaceae. Beijing: Science; St. Louis: Botanical Garden Press;; 2009. pp. 36–7.
    1. Averyanov L, Cribb P, Loc PK, Hiep NT. Slipper orchids of Vietnam. Compass Press Limited; 2003.

Publication types

LinkOut - more resources